Location via proxy:   [ UP ]  
[Report a bug]   [Manage cookies]                
Article

Cartography and Neural Networks: A Scientometric Analysis Based on CiteSpace

1
College of Geography and Environmental Science, Henan University, Kaifeng 475004, China
2
Henan Industrial Technology Academy of Spatial-Temporal Big Data, Henan University, Zhengzhou 450046, China
3
Key Laboratory of Geospatial Technology for the Middle and Lower Yellow River Regions, Ministry of Education, Henan University, Kaifeng 475004, China
4
Henan Technology Innovation Center of Spatio-Temporal Big Data, Henan University, Zhengzhou 450046, China
5
Key Research Institute of Yellow River Civilization and Sustainable Development, Henan University, Kaifeng 475001, China
6
Henan Urban Planning Institute & Corporation, Zhengzhou 450053, China
*
Author to whom correspondence should be addressed.
ISPRS Int. J. Geo-Inf. 2024, 13(6), 178; https://doi.org/10.3390/ijgi13060178
Submission received: 15 March 2024 / Revised: 30 April 2024 / Accepted: 23 May 2024 / Published: 29 May 2024

Abstract

:
Propelled by emerging technologies such as artificial intelligence and deep learning, the essence and scope of cartography have significantly expanded. The rapid progress in neuroscience has raised high expectations for related disciplines, furnishing theoretical support for revealing and deepening the essence of maps. In this study, CiteSpace was used to examine the confluence of cartography and neural networks over the past decade (2013–2023), thus revealing the prevailing research trends and cutting-edge investigations in the field of machine learning and its application in mapping. In addition, this analysis included the systematic categorization of knowledge clusters arising from the fusion of cartography and neural networks, which was followed by the discernment of pivotal clusters in the field of knowledge mapping. Crucially, this study diligently identified the critical studies (milestones) that have made significant contributions to the development of these elucidated clusters. Timeline analysis was used to track these studies’ origins, evolution, and current status. Finally, we constructed collaborative networks among the contributing authors, journals, institutions, and countries. This mapping aids in identifying and visualizing the primary contributing factors of the evolution of knowledge mapping encompassing cartography and neural networks, thus facilitating interdisciplinary and multidisciplinary research and investigations.

1. Introduction

1.1. Cartography and Neural Networks

As a comprehensive ‘encyclopedia’ for reconstructing the complex nonlinear geographical world, maps have been integral to human civilization, aiding in the understanding and transforming the world [1]. As an independent discipline, cartography encompasses the art, science, and technology related to the production and utilization of maps [2]. During the past century, the field of cartography, including maps and cartographic studies, has seen rapid development. It has absorbed and integrated theories, methods, and technologies from adjacent disciplines, forming a systematic and comprehensive modern cartographic theory [3]. Furthermore, the Geographic Information System (GIS), which was born from cartography, has found extensive and deep applications across various national economy and defense sectors.
In recent decades, the rapid progress in neuroscience and its interdisciplinary connections, like cognitive science, have generated considerable expectations. This progress has provided a theoretical foundation for the discovery and deepening of our understanding of maps, thus expanding the horizons of cartography [4]. Discovering spatial cells, such as place and grid cells, has laid the neural foundation for spatial cognition, elucidating the brain mechanisms underlying navigation, spatial behavior, and map making. These spatial cells encode human spatial behaviors, enabling functions such as mapping coordinate positioning, measurement, spatial scale representation, distance calculation, and facilitating spatial navigation within the brain [4]. Furthermore, traditional cartography theories have sought explanations from neuroscience, including the fundamental visual variable theory originally proposed in the seminal work by Bertin [5]. Despite its widespread application in cartography as an empirical indicator, cartographers aspire to gain insights from neuroscience to elucidate its underpinnings.
The contemporary trend in science and technology development emphasizes high differentiation and high synthesis—a trend that cartography does not escape. The primary driver of this trend is rapid advancement in science and technology, coupled with an accelerated pace of technological innovation [6]. Since 2015, the integration of geographical spatial science with deep learning techniques, such as convolutional neural networks, adversarial generative networks, and graph neural networks, has witnessed continuous growth [7,8]. The advent of artificial intelligence offers a historical turning point for the next zenith of cartography. Simultaneously, it poses formidable challenges. The research and application of deep learning algorithm cartography are necessary to capitalize on the wave of machine learning in the era of big data. This involves transitioning from neural networks based on statistical methods to those grounded in spatio-temporal big data methods, allowing machines to learn independently. This approach aims to overcome bottleneck problems in cartography, particularly in map design and map generalization, through a knowledge engineering approach [6].

1.2. Importance of Reviewing and Evaluating Previous Work

Reviewing and evaluating previous research findings are considered valuable activities in academia [9,10]. This is because the advancement of disciplinary knowledge and theory is based on the theoretical and experiential contributions of individual research [11]. Researchers have also suggested that journal articles serve as indicators of research directions, and periodic analyzes are necessary as the focus of scientific research evolves over time [12,13]. Many scholars find it challenging to directly comprehend the overall knowledge structure, research progress, frontiers, and hotspots in complex research fields.
Several comprehensive reviews and analyses have been conducted in cartography. The study of WANG Yan [14] used bibliometric methods to analyze the progress of cartography research, and it provided visual representations of the results, including author distribution and the evolution of keywords over time. The study of Clarke et al. [15] employed a latent Dirichlet allocation and visual analysis to analyze 245 articles published between 2015 and 2019 in four major cartography journals, identifying 1109 unique terms. They reviewed recent cartography research trends, identified gaps between American and global cartography, and outlined prospects for future research. The study of Griffin et al. [16] surveyed developments in geographic visualization, geographic visual analytics, representation techniques, and interaction paradigms. The literature review by Shi and Jie [17] utilized studies related to cognitive maps published between 1948 and 2020, as indexed in the Web of Science. They used the CiteSpace bibliographic analysis method and combined it with a review of classic literature to analyze the multidisciplinary development trends of cognitive maps, the progress of cognitive map research in geography, and the directions of the geographic development of cognitive maps supported by multidisciplinary integration. The study of Wu Guangying [18] conducted a bibliometric analysis of research related to dynamic map visualizations from 1986 to 2021. They utilized methods such as the co-occurrence of keywords, co-occurrence of central words, and the identification of burst keywords to assess the research trends in dynamic map visualization. The book ‘The Geographical Sciences During 1986–2015’ by Leng et al. [19] provides a retrospective on the development of geographical sciences from 1986 to 2015. Furthermore, several studies have reviewed neuroscientific principles related to cognitive maps, including those related to advanced brain mapping principles [20,21,22], neuroscience principles of spatial navigation and their relation to artificial intelligence [23], and the application of digital elevation models to landform classification [24]. In addition, there have been reviews on map updating [25] and cognitive maps [17], among other related research topics.
However, previous reviews in cartography have not analyzed the research progress in the domain of neural networks when combined with cartography or the innovative applications of neural networks in mapping. These studies have either been quantitative (e.g., [26,27,28]) or qualitative (e.g., [29,30,31]). Few studies have attempted to visualize knowledge mapping. Therefore, based on visual analysis software—CiteSpace—and employing scientometric analysis on 3604 papers published over the past decade, we describe the core research strengths, development trajectories, frontiers, and emerging trends in various domains where neural networks are combined with cartography. The results of this study provide valuable reference information for scholars and researchers in related fields.

1.3. Knowledge Mapping and CiteSpace

Knowledge mapping is defined as the process, methods, and tools for analyzing the characteristics or significance of a knowledge domain and visualizing it comprehensively and transparently [11,32]. It is one of the most crucial steps in knowledge management and involves presenting concepts, knowledge, and links in a visual or graphical format. Various techniques can be used to create knowledge maps, such as using CiteSpace for bibliographic coupling, social network analysis, and the visualization of knowledge domains.
CiteSpace, a tool for analyzing, detecting, and visualizing trends and patterns in the scientific literature, is one of the most representative tools for knowledge mapping and bibliometric analysis [33,34,35,36,37]. It provides accurate and efficient metrics for scientific literature analysis, and it identifies and displays emerging trends and dynamics in research fields [33]. Moreover, studying research hotspots and trends helps capture a discipline’s development trends and frontiers. CiteSpace takes a set of bibliographic records as the input and models the knowledge structure of underlying domains based on a comprehensive network of publication time series [38]. It can analyze connections between authors, institutions, countries, keywords, journals, or references in the scientific literature.
An essential tool in the CiteSpace software package helps identify betweenness centrality in the scientific literature. It measures the importance of nodes in a network by calculating the shortest path number between all nodes in the network that pass through the nodes of interest [39]. Typically, nodes with high betweenness centrality are used to identify distinct research clusters because of their bridging capability [40]. These nodes can be considered essential bridges that provide ‘hidden’ connections between two research interests that are usually unconnected.

1.4. Paper Structure

Therefore, this paper conducts a quantitative study of the literature on the neural network methods that are applied in cartography and the application of neural networks in cartography using literature mapping and visualization analysis software—CiteSpace. The aim is to analyze this field’s overall framework and fundamental research trends. Additionally, by critically reviewing the highly cited literature, this paper further examines the research hotspots, themes, and trends in this field, thus providing a scientific basis for addressing research challenges.
This paper is organized as follows. In the next section, the methodology is introduced. This section details the establishment strategy of the target literature database, including the string search strategy, and presents the distribution of publications over time within the dataset. Additionally, it comprehensively outlines the process, content, and parameters of visualization and analysis, including data cleaning by merging semantically duplicate nodes. The results are then shown in Section 3, including key publications, central research themes, core scholars, core journals, collaboration among institutions, and the distribution of countries. The discussions and conclusions are presented in Section 4.

2. Method

2.1. Data Collection

We collected data from the Web of Science Core Collection, including the Science Citation Index Expanded (SCI-EXPANDED), Social Sciences Citation Index (SSCI), Arts & Humanities Citation Index (AHCI), Emerging Sources Citation Index (ESCI), Conference Proceedings Citation Index–Science (CPCI-S), and Conference Proceedings Citation Index–Social Science & Humanities (CPCI-SSH). We used appropriate keywords to select the relevant literature for analysis (Table 1). This study focuses exclusively on journal articles and conference papers, excluding books, patents, and other publications outside of our scope of data collection. The search was conducted until 26 April 2023.
The data collection process involved several steps. First, we retrieved the literature containing the keyword ‘neural network’ in its theme, including titles, abstracts, author keywords, and Keywords Plus, generating 521,498 records as Set #1. The asterisk (*) represents any group of characters, including no character. For example, searching for “neural network*” will yield search results containing “neural network” and “neural networks”. Second, to ensure a comprehensive dataset that covers various map types, we selected topic search queries related to different aspects of cartography based on the comprehensive classification of modern maps and the scientific framework of modern cartography proposed by Wang et al. [41,42], as shown in Figure 1. We considered map topics (content), scales, mapping regions, and cartographic purposes as our criteria. We selected topic search queries that included keywords such as topographic map, topological map, geographic map, geological map, thematic map, web mapping, digital mapping, mental mapping, cognitive map, digital line graphic, digital orthophoto map, and digital raster graphic, as shown in Set #2. However, it is important to note that our query did not include all the map categories mentioned by Wang et al. [41,42]. The reason for is was that, through our testing, we found that some studies did not combine the use of neural network methods with specific map categories. As mentioned by Liqiu [43], Dong et al. [44], it appears that, at present, the technical methods from fields such as neuroscience and cognitive science have not yet been successfully integrated with various domains of cartography. This query generated 26,314 records in Set #2.
Next, we focused on combining neural networks and cartography in various aspects, including specific map applications and theoretical contributions within cartography. We conducted queries related to topics such as ‘map spatial cognition’ and ‘map information transmission and map model’, which resulted in 8407 records (Set #3). Among these, the ‘information transmission’ included terms from other queries that may have ambiguous relevance, such as ‘web mapping’, as they can be used in contexts unrelated to cartography. We will assess these terms’ relevance in the subsequent analysis phase.
Our fourth query emphasized the application of neural networks in various cartographic techniques, including map design, map visualization, map recognition, map analysis, and cartographic generalization. This query produced 3388 records (Set #4).
To ensure a comprehensive dataset, we conducted additional searches using terms related to ‘cartography’ (e.g., cartography, cartographic, and cartographer) and ‘map’ (e.g., mapping and map) in the topic search query. However, because research in fields like engineering, electrical engineering, electronic engineering, computer science, and robotics may also include studies related to cartography and maps, we aimed to narrow down our research scope to geography. Two search approaches were conducted: one requiring geography-related terms in titles, abstracts, or keywords, generating 48,030 records (Set #5); and the other specifying the research areas as ‘geography’ and ‘physical geography’, which led to 30,194 records (Set #6).
Finally, we merged all search results and identified the intersection with Set #1, resulting in Sets #7 and #8. To ensure the relevance of the publications, we removed duplicates and unpublished papers—the final sample comprised 3604 relevant publications. Detailed bibliographic records of these publications, including titles, authors, keywords, abstracts, journals, publication years, and other publication information, were exported to CiteSpace [33] for further analysis. As shown in Figure 2, the analysis showed a steady growth in the number of publications on the intersection of neural networks and cartography from 2013 to 2016. In 2017, there was a significant increase in publications, with the annual count rising from 176 to 572, thus indicating a growing interest in this interdisciplinary field. The lower number of articles published in 2023 was due to our data collection ending in April 2023.

2.2. Visualization and Analysis

Using CiteSpace, we initially plotted the significant pathways for integrating cartography and neural networks. The analysis involved document co-citation analysis; keyword co-occurrence analysis; the classification of knowledge clusters related to the integration of cartography and neural networks; identification of the major clusters within the knowledge mapping; determination of critical studies contributing to knowledge development; and a timeline analysis of the origin, development, and current status of these studies. Next, we determined the milestone papers in cartography and neural network integration based on the frequency of the citations in journal articles. The burst of specific articles can be analyzed to understand the evolution of research in integrating cartography and neural networks and to identify recent research trends. A burst refers to a significant change in the value of a variable that occurs over a relatively short period. CiteSpace considers this type of change as a way to determine research frontiers. Thirdly, we created maps of the contributing authors, journals, institutions, and countries. This helped to identify and visualize the major contributing factors to the evolution of knowledge maps related to the integration of cartography and neural networks.
Our analysis encompassed keyword co-occurrence analysis, author/institution/country collaboration network analysis, reference/cited author/cited journal co-citation analysis, and burst word analysis. We mainly focused on document co-citation analysis from 2013 to 2023. Document co-citation analysis [45] involves clustering a batch of documents (or authors, journals, etc.) using multivariate statistical analysis methods such as cluster analysis and multidimensional scaling. It simplifies the complex co-citation network relationships among numerous analysis objects into the relationships among a relatively small cluster, which are visually represented. Simultaneously, we clustered the keywords based on the reference co-citation network generated through document co-citation analysis, creating a landscape view of the co-citation network and a time view for analysis. The specific meanings of the network nodes, node size, node color, links, link strength, and link color in the co-citation network and collaboration network generated in this study are described in Table 2. The nodes in the network represent items such as citations, authors, journals, countries, and institutions. Each node is depicted as a series of tree rings in different colors, which correspond to different years. The thickness of the outermost purple ring indicates a relatively high intermediary centrality of that node. The influence of a node increases with higher citations and centrality. The links represent shared citations or co-occurrences between nodes, and the color of the link indicates the year of the first citation or co-occurrence between the two nodes [46].
The following parameters in CiteSpace were used (as shown in Table 3): (1) time slice from 2013 to 2023; (2) term source = title/abstract/author/keywords/keywords plus; (3) node type = keyword/author/reference/institution/country/cited author/cited journal; (4) links = cosine/within slices; and (5) select the 50 most-cited articles per slice. After running CiteSpace, we identified that, due to language recognition issues in the software, some nodes with similar meanings were distinguished as different nodes, such as ‘gis’, ‘geographic information system’, ‘geographic information systems’, etc. Therefore, we merged the duplicate nodes (as shown in Table 4).
Finally, since the software can only provide an overview of the research in this field and cannot offer more in-depth details about the literature, this paper combines the software analysis results with a critical review of highly cited classic domestic and international literature. This was performed to further summarize the hot topics and research trends in integrating cartography and neural networks, providing insights and inspiration for future research.

3. Results

This study focused on document co-citation analysis from 2013 to 2023. As shown in Figure 3, the document co-citation network comprised 395 nodes and 1922 links. Firstly, the colors of the nodes and links directly corresponded to each time slice. The color of the outer circle of a node represents the years in which the document was cited. For example, if a node has outer circles in purple, yellow, orange, and red, the document was cited in 2014, 2021, 2022, and 2023, respectively. Individual links follow the color of the first time slice in which the paper was cited. For instance, if a paper was first cited in 2014, its link color is purple. Secondly, larger nodes indicate that the publication is cited more frequently, thus representing a vital knowledge domain. Thirdly, the outermost purple circle indicates that the node has a relatively high betweenness centrality in the network, and thicker purple circles represent higher values of this metric. In summary, publications with larger node sizes and purple outer circles are worth further research and discussion, reflecting a prominent or dominant position in this knowledge domain. Therefore, based on the document co-citation network analysis, we identified vital publications and conducted keyword clustering analysis to categorize the research phases. We analyzed the field from six perspectives: research hotspots and trends, core scholars, core journals, institutional collaborations, and national distributions.

3.1. Key Publications

In a research field, the term key publication signifies significant breakthroughs and innovations in the field’s theory or technology, reflecting the specific themes and focal points of research during a particular period [47].
The milestones in the interdisciplinary research of combining cartography and neural networks from 2013 to 2023 can be identified from a list of references with strong citation bursts, as depicted in Figure 4. Notably, references with prominent citation bursts often represent significant milestones in scientific mapping research [38]. For instance, a pioneering milestone paper in this research field is the remarkable deep learning study [48] with a citation burst strength of 33.08. This study introduced a learnable module called a spatial transformer into convolutional neural networks, enabling these neural networks to actively perform spatial transformations on feature maps. This method found a widespread application (e.g., road extraction [49]) in cartographic generalization. Other milestones in the deep learning and machine learning category include fully convolutional networks for semantic segmentation [50], deep residual learning for image recognition [51], and deep learning [52]. In addition to the deep learning and machine learning studies applied in cartography, there has been a notable burst of research in the application area of landslide susceptibility mapping [53,54].
Figure 4 also illustrates the burst periods of these milestones, including the publication year of the literature (Year), the intensity of burst citations (Strength), and the start and end years of burst citations (Begin and End, respectively). In the last column of Figure 4, the blue bolded timeline represents the publication period of the literature, while the red timeline indicates the period during which the literature was cited in bursts. A longer red timeline signifies that the literature was cited in bursts for a longer period. The more to the right the red timeline is, the later the study was cited during the burst period. For example, one of the earliest burst milestones in our study period was landslide susceptibility [53]. The aforementioned study employed a Back Propagation Artificial Neural Network model to analyze the landslide susceptibility in the Baling Valley region of Malaysia. It produced thematic maps indicating landslide-prone areas. This research experienced a surge in citation frequency and impact from 2013 to 2015, gradually diminishing in influence after 2015. In contrast, some of the research with ongoing strong influence have focused on machine learning and deep learning methods, and they have been primarily centered on convolutional neural networks. This includes studies like the Squeeze-and-Excitation Networks [55]; SegNet, a deep convolutional encoder for image segmentation [56]; encoders with atrous separable convolution for semantic image segmentation [57]; the Convolutional Block Attention Module [58]; Feature Pyramid Networks for object detection [59]; and pyramid networks for scene parsing. Furthermore, Ma et al. [29] analyzed the current state of remote sensing deep learning, covering the entire process from preprocessing to cartographic production. These milestones indicate significant advancements and critical focal points in the interdisciplinary field of cartography and neural networks during the specified time frame (2013–2023).

3.2. Major Research Theme

The first step in identifying research hotspots and development trends is to cluster keywords and understand the nature, composition, and characteristics of the main clusters [38]. Keywords serve as the indicators of the literature, and they provide highly summarized insights into the topics and central themes, thus representing the core essence of the literature. The clusters obtained from keyword clustering in this study represent different fundamental research directions. We focused on the cluster members determined by temporal metrics within each cluster, highlighting research hotspots and their transitions. The landscape view (Figure 5) was constructed from the keywords of the top 50 most-cited publications each year from 2013 to 2023, resulting in 11 keyword clusters containing 199 keywords.
Based on the clustering results, we observed that cartographic research has gradually developed a strong interdisciplinary foundation and characteristics as maps and mapping have been introduced and applied in various disciplines. Specifically, the research in cartography and neural networks comprises contributions from multiple domains, encompassing the various aspects of this field. Among these, the top five largest cluster groups comprised 193 nodes, accounting for approximately 9% of the entire network. Therefore, our analysis primarily focused on these top five clusters, including ‘landslide susceptibility mapping’, ‘deep learning’, ‘fuzzy cognitive map’, ‘machine learning’, and ‘digital soil mapping’. Table 5 presents these five major clusters. The size value indicates the cluster’s size, with larger clusters having more related publications. Large clusters typically represent major research directions, and they correspond to research hotspots. The silhouette value reflects the similarity of the clusters, with values closer to 1 indicating better cluster quality. All the silhouette values shown in Table 5 were greater than 0.6, indicating that all the clusters were highly homogeneous. The average year represents the average publication year of the literature within each cluster. A higher value suggests that the publications within the cluster are more recent and closer to the current research frontier. Term selection and labeling for each cluster were achieved by detecting and selecting the most representative terms using the Log-Likelihood Ratio (LLR) test and labeling them accordingly for discussion.
We labeled Cluster #0 ‘landslide susceptibility’ because it primarily contains articles on landslide susceptibility mapping. This cluster encompasses methods such as support vector machines, frequency ratios, decision trees, and logistic regression. Cluster #1 was labeled ‘deep learning’ because the articles within this cluster mainly concentrate on applying deep learning methods in cartographic theory, techniques, and applications, including feature extraction and convolutional neural networks. Cluster #2 was labeled ‘fuzzy cognitive maps’ as the articles within this cluster are closer to ontological research in cartography. Cluster #3 was marked ‘machine learning’. When ignoring the semantic differences, Clusters #1 and #3 can be categorized as the same family, i.e., neural network methods. Cluster #4 was titled ‘Digital soil mapping’ as the articles in this category use neural network methods to focus on specific cartographic applications related to digital soil mapping, covering topics such as land use and land cover. These labels help categorize and understand the main research directions represented by each cluster, thus facilitating the identification of research hotspots and trends in cartography and neural networks.

3.2.1. Temporal Analysis

Another way to examine these clusters and their relationships is through a timeline visualization (Figure 6). This technique provides a temporal overview of nodes, links, and cluster co-occurrence years. It is a two-dimensional network that maps the co-occurrence years of the keywords derived from clusters, allowing us to visualize the knowledge structure of a discipline and how it evolves over time [38].
Throughout the research process, we can observe the changes in research focus. From 2013 to 2016, keywords like ‘conditional probability, ‘fuzzy logic’, ‘statistical analysis’, and ‘likelihood ratio’ were prominent in cartographic research methods. Starting from 2019, new keywords emerged, including ‘feature extraction’, ‘task analysis’, ‘attention mechanism’, and ‘semantic segmentation’, and the citation bursts of these keywords have continued to be present. The appearance of geographical keywords like ‘China’ and ‘United States’ reflects the close connection of cartographic research to specific regions. As shown in the timeline overview, the sustainability of the top five clusters was quite robust, extending from 2013 to 2023, thus indicating continuous activity in these areas. These results suggest that the integration of neural network methods into cartographic research is expanding into new domains, and they have also been applied across a broader range of disciplinary backgrounds, demonstrating increasing maturity.

3.2.2. Cluster #0—Landslide Susceptibility Mapping

The severe threat of landslides to the safety of residents and the ecological environment is a significant concern. Maps generated based on Landslide Susceptibility Prediction (LSP) can effectively reflect the spatial probability distribution of landslides in a specific area [60]. Cluster #0, named Landslide Susceptibility Mapping, is the largest cluster and comprises 48 keywords from 2013 to 2023, accounting for approximately 24% of the co-occurrence network. The median publication year of all the references in this cluster is 2014. In Cluster #0, the node with the highest betweenness centrality was ‘Artificial Neural Network’, which was found in 502 references. This node first appeared before 2013 and has seen a continuous increase in appearances, reaching 72 times in 2022. The most-cited paper within this node is the study by Devkota et al. [61], which has been cited 417 times. This paper conducted landslide susceptibility mapping based on topography, water resources maps, road maps, and geological maps, utilizing deterministic factors, entropy index, and logistic regression models within a GIS environment. Following that, Kavzoglu et al. [62] proposed a landslide susceptibility mapping method using Multi-Criteria Decision Analysis (MCDA) and Support Vector Regression (SVR) based on GIS. This method has been cited 358 times.
Through a comprehensive review and analysis of the key references in Cluster #0 (Figure 7), it is evident that machine learning models can address the nonlinear calibration between landslides and conditioning factors, as well as automatically determine model parameters [63]. Such models include Binary Logistic Regression (BLR) [64,65], Fuzzy Logic [66], Decision Trees (DTs) [67], Random Forests [68], Support Vector Machines (SVMs) [62,69], Artificial Neural Networks (ANNs) [64,70,71,72], Bayesian Networks [73], Neuro-Fuzzy Algorithms [74], and Naive Bayesian Algorithms [75]. Among these, Artificial Neural Network models primarily consist of Single-Layer Neural Networks (NNET) and Multilayer Perceptron (MLP) neural networks [76]. The citation counts of the core literature in this field have steadily increased, indicating a growing trend in combining this field with neural networks.

3.2.3. Cluster #1 and #3—Deep Learning and Machine Learning

Cluster #1 (deep learning) and Cluster #3 (machine learning) are the second and fourth largest clusters, respectively, spanning the entire research period from 2013 to 2023. These two clusters comprise 75 keywords, accounting for approximately 38% of all co-occurring keywords in the network. In the deep learning cluster, the median publication year for all cited references was 2018, while for the machine learning cluster, it was 2014. Deep learning, a specialized form of machine learning, was introduced into cartography later than machine learning because it involves learning to represent the world as a nested hierarchy of concepts, which enables its powerful functionality and flexibility. In the research period from 2013 to 2023, the field of machine learning for cartography research underwent two phases. The first phase was from 2013 to 2018, and it was characterized by rapid growth in research. In contrast, from 2018 to 2023, the research in this area stabilized. Compared to the deep learning cluster, which started rapid development around 2018, research frequency in the machine learning domain related to cartography gradually decreased. In both of these clusters, key nodes with significant bursts included ‘neural network’, ‘convolutional neural network’, ‘classification’, ‘deep learning’, ‘machine learning’, ‘algorithm’, ‘feature extraction’, ‘semantic segmentation’, ‘object detection’, and ‘task analysis’. These keywords appeared 628, 410, 379, 373, 211, 160, 150, 96, 64, and 55 times, respectively.
The rapid development of the deep learning cluster starting in 2018 is closely associated with the node ‘Convolutional neural network’. This theory was first applied to cartography in 2016, with five co-occurrences. It continued to rise and reached 116 co-occurrences in 2022. However, due to our data collection ending in April 2023, this keyword only co-occurred 32 times in 2023. The specific co-occurrence trend is illustrated in Figure 8. The top five nodes with strong prominence included ‘classification’, which is a task of convolutional neural networks aimed at identifying the content depicted in data such as images and texts, including 3D classification [77], feature classification in cartographic generalization [78,79,80], emotion classification in map sentiment analysis [81,82,83,84,85,86], classification in model generalization operations [87,88], image (especially map) classification [89,90], classification in thematic tap design, etc. One of the earliest convolutional neural networks that fully addressed this task was AlexNet [91], which consists of five convolutional layers and three fully connected layers. Another task of convolutional neural networks is object detection, which is also reflected in the node ‘object detection’.
Finally, through an analysis of the clusters, key nodes, and highly cited articles, we found that key technologies such as ‘Artificial Neural Network’ [78,89,92], ‘Self Organizing Map’ [87,93,94,95,96,97,98], ‘Back Propagation Neural Network’ [93,99,100,101], ‘Particle Swarm Optimization’ [102], ‘Radial Basis Function Networks’ [102], ‘Convolutional Neural Network’ [81,90,101,103,104,105,106,107,108], ‘Graph Neural Network’ [88,109,110,111,112,113,114], ‘Support Vector Machine’ [79,99], etc., are widely applied in various domains of cartography. Firstly, these technologies have automated cartographic workflows in map generalization [104,115], including polyline simplification [78,92,114,115], river network generalization [87,98,99], selective omission of road networks [79,93,96,110,114,116], simplification and aggregation of building polygons [88,92,97,100,101,104,111,113,117,118,119], and automated generalization of residential areas [80]. Furthermore, deep convolutional models were used to automatically extract the multi-class land cover objects, map symbols, and text annotations from maps and images [120,121,122], thus completing tasks related to map recognition based on neural networks [90,103,113]. Finally, various machine learning techniques have found wide applications in theme map design (e.g., land use maps [89], indoor maps [105,106,107]), crime mapping [95], transfer learning for map style and aesthetics [113,123], and automated shading in topographic maps [124].

3.2.4. Cluster #2—Fuzzy Cognitive Map

The fuzzy cognitive map cluster is the third-largest cluster, comprising 40 keywords and accounting for approximately 20% of all co-occurrence network keywords. In Cluster #2, the node with the highest betweenness centrality was ‘model’, containing 377 articles. The second most prominent node was ‘cognitive map’, with 114 articles, followed by ‘map’ with 74 articles. The primary focus of combining fuzzy cognitive maps with neural networks is applying neural network modeling methods to cognitive map research. The node ‘cognitive map’ first appeared before 2013, and the overall term frequency has shown a fluctuating upward trend, increasing from 6 co-occurrences in 2013 to 19 in 2022. Table 6 lists the top twenty most highly cited references in the fuzzy cognitive map field. The study of Felix et al. [125] was the most-cited article in this node, with 117 citations. It defines fuzzy cognitive maps as interpretable recursive neural networks that include fuzzy logic elements during the knowledge engineering phase.
Fuzzy cognitive maps (FCMs were proposed by Kosko [126] as a graph-based knowledge representation method, where the aim is describing a set of concepts interconnected by causal relationships in an area of interest. Research in this field mainly focuses on understanding human memory, path integration methods, spatial navigation, and decision behavior related to cognition in the brain [18]. According to the development trajectory of the fuzzy cognitive map field presented in Table 5, we identified the research hotspots when combining cartography with neural networks in the fuzzy cognitive map domain.
First, it involved simulating human cognitive processes and converting them into digital models [127,128,129,130,131,132]. Second, we analyzed the psychological and neuroscientific aspects of the changes in the brain during cognitive mapping processes [45,133]. Third, we analyzed hidden knowledge and emotional preferences in cognitive map analysis [134]. Fourth, we explored the interaction between humans and the environment in cognitive processes involving geography, environmental science, and urban and regional planning [135].
Furthermore, the introduction of neural network modeling methods into fuzzy cognitive map research includes two aspects: learning map structures [45,129,136] and classification based on FCMs [125,128,130,132,137,138,139]. Essential algorithms in FCM learning can be categorized into three types based on their underlying learning paradigms: Hebbian-based, error-driven, and hybrid learning algorithms. For instance, Song et al. [140,141] designed an FCM-based network to predict chaotic time series using neural networks and fuzzy sets. A four-layer fuzzy neural network was developed to enhance FCM learning capabilities, thus combining the inference mechanism of traditional FCMs with fuzzy membership function learning.
Finally, some research proposes software tools tailored to fuzzy cognitive maps. Among them, is the most influential is the Intelligent Expert System based on Cognitive Maps (ISEMK) proposed by Poczęta et al. [142], Papageorgiou et al. [143]. ISEMK is a decision support system modeling software based on fuzzy cognitive maps and artificial neural networks. We found that fuzzy cognitive maps, as a method for simulating complex systems, are the most prominent research area in cognitive mapping, wherein they are widely applied in computer science, artificial intelligence, theoretical methods, information systems, software engineering, and other domains.

3.2.5. Cluster #4—Digital Soil Mapping
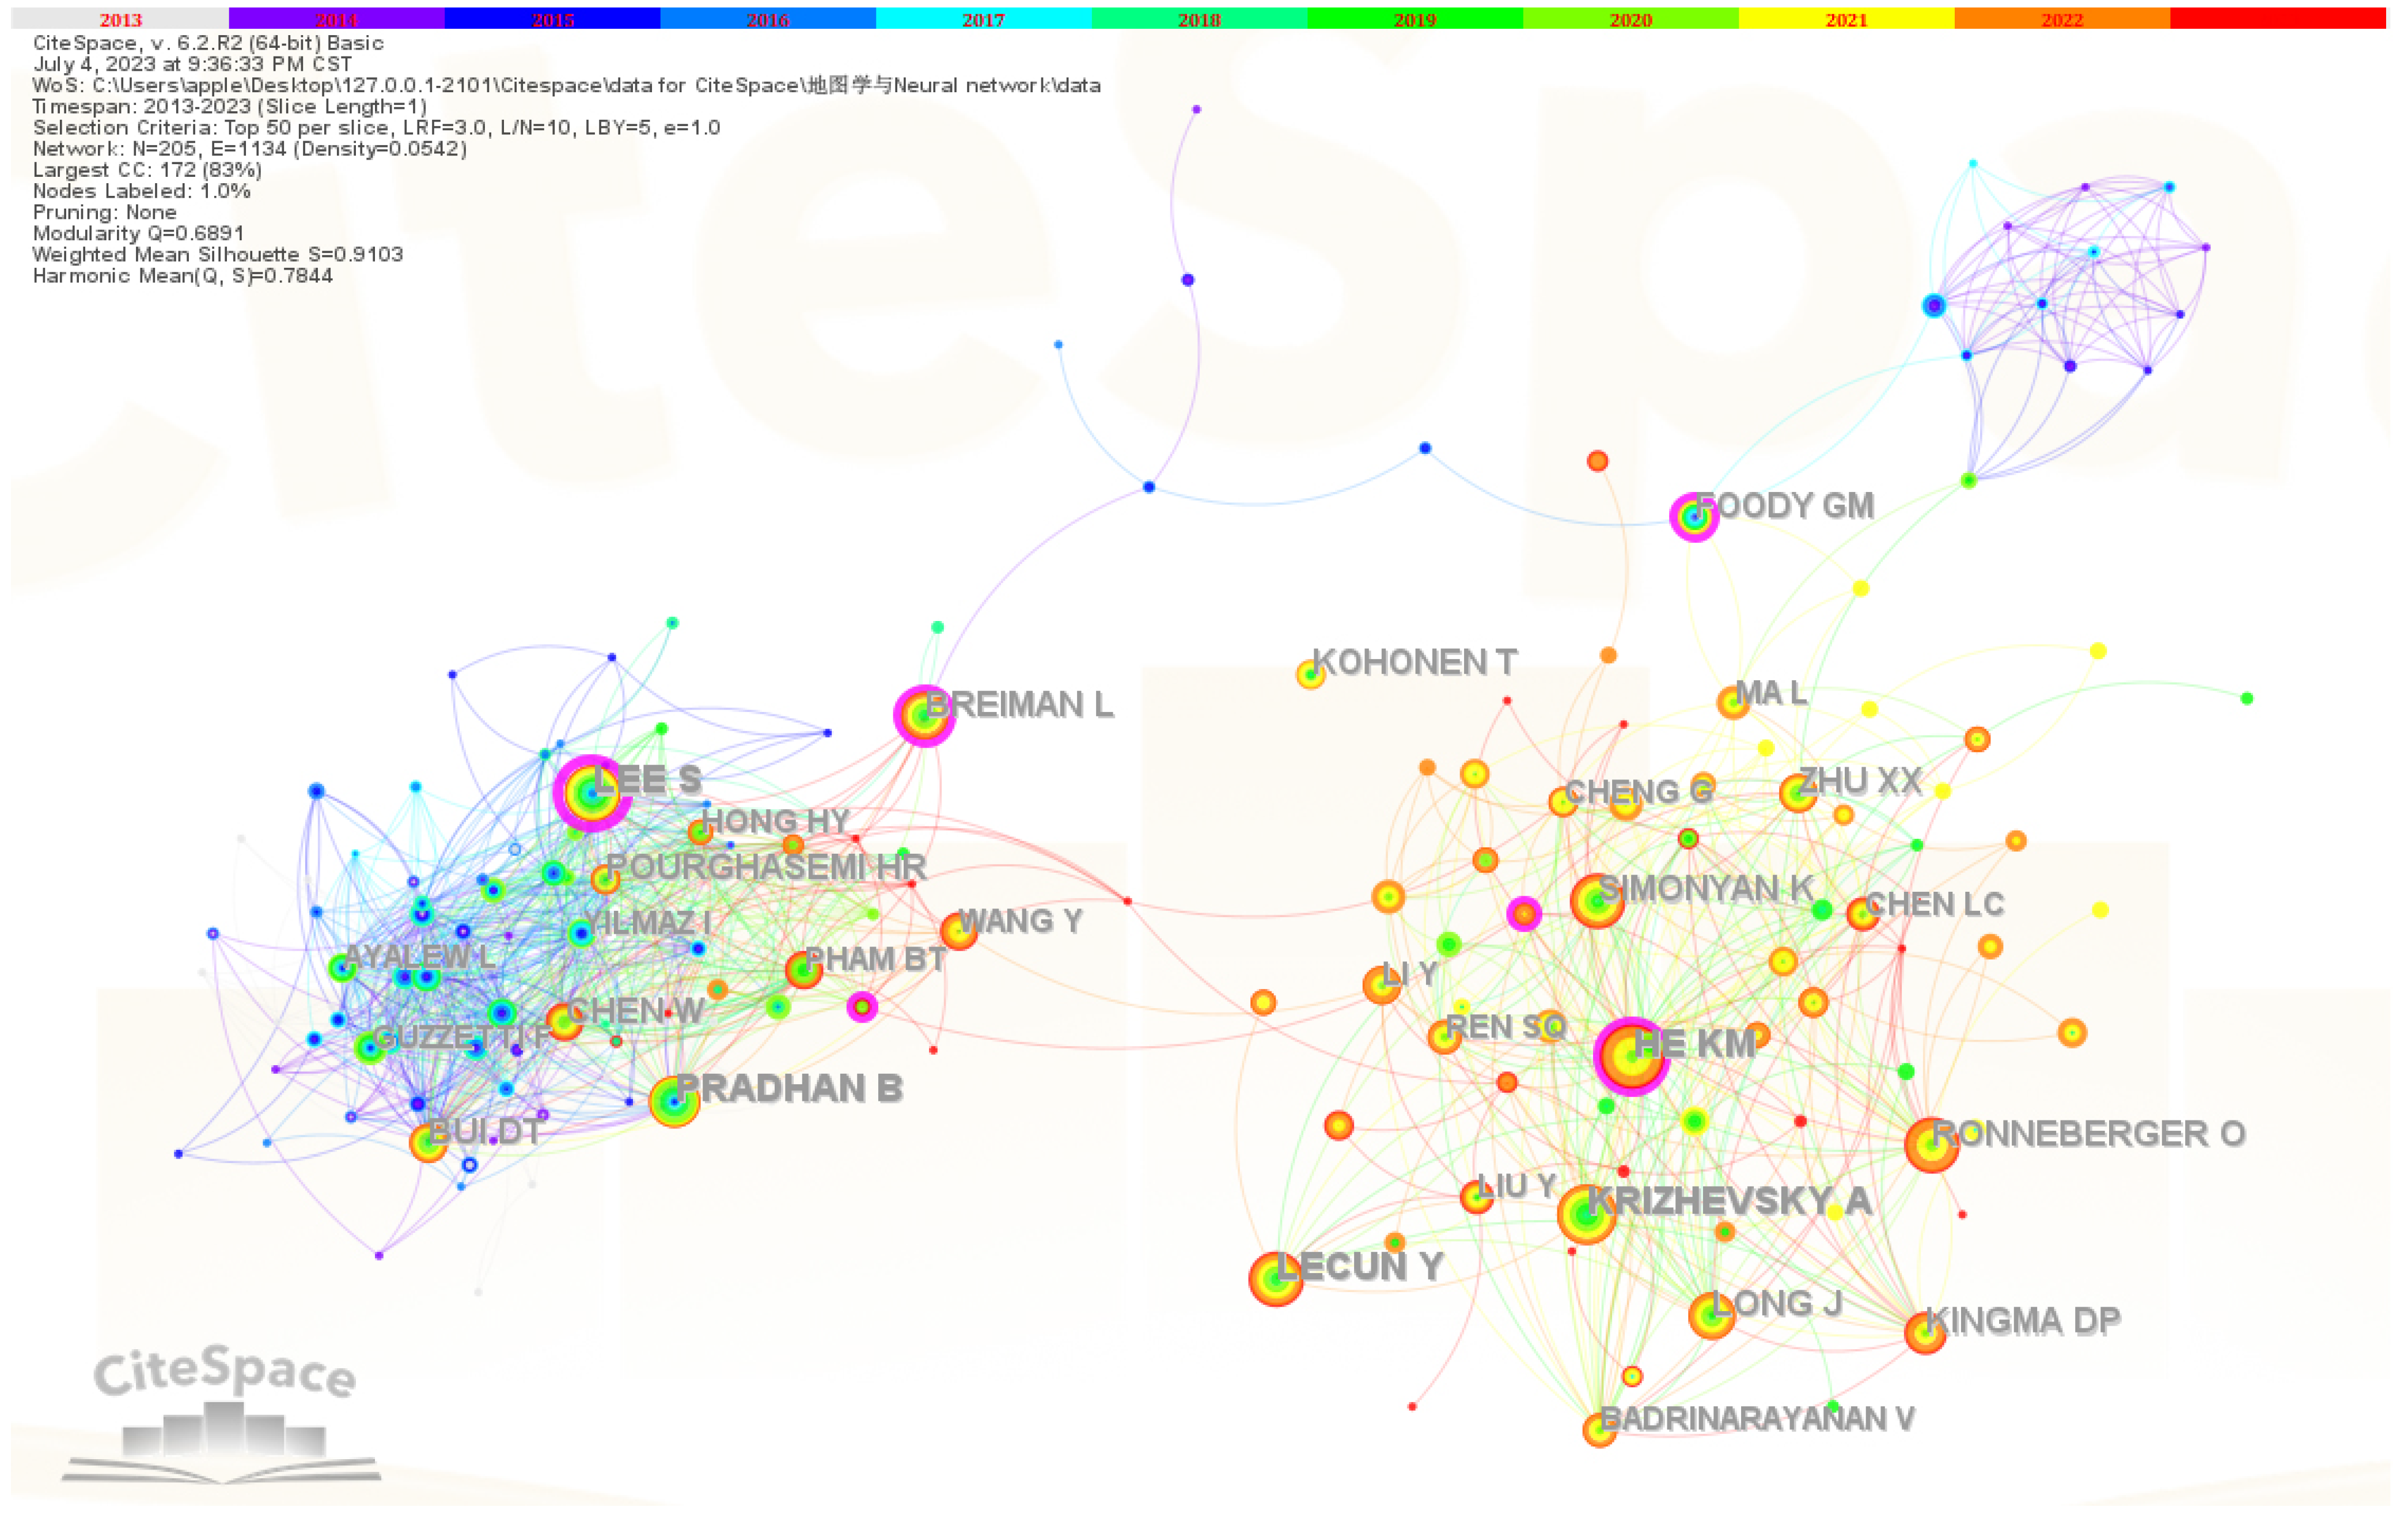
Digital soil mapping represents the fifth major cluster among these categories, comprising 30 keywords from 2013 to 2023 and making up roughly 15% of the entire keyword co-occurrence network. Unlike the other four categories, it has experienced a relatively steady citation pattern over the past decade, lacking any prominent spikes or sudden increases in citation frequency. Within this category, the node with the highest betweenness centrality was ‘random forest’. This particular node first appeared in 2014 and consistently co-occurred thrice annually in 2014, 2015, and 2016. Starting in 2017, it escalated rapidly, reaching a peak of 31 co-occurrences in 2021. However, there was a turning point in 2022, with a noticeable decline to 26 co-occurrences. The researches of Brungard et al. [144] authored the most frequently cited paper within this node, which has been cited 201 times. In this study, Brungard et al. conducted a comparative analysis of six models, including neural networks, to predict soil classifications in three distinct geographical regions within the semi-arid western United States. Following closely, a study by Taghizadeh-Mehrjardi et al. [145] combined artificial neural networks, Support Vector Regression, k-nearest neighbors, random forests, regression tree models, and genetic programming with equal area spline to map lateral and vertical variations of SOC below 1-meter depth in the semi-arid Kurdistan province of Iran. This study has garnered 131 citations. In the research of [146], it was observed that predictive models for digital soil mapping have transitioned from linear models to machine learning (ML) techniques. Mixed models within the regression kriging (RK) framework have outperformed single models. While multiple linear regression (MLR) remains the most commonly employed approach for predicting soil organic carbon, its performance often surpasses other ML techniques in most studies. Random forests (RF) outperform MLR and other ML techniques in most comparative studies. Other commonly utilized and competitive techniques include geostatistics, neural networks (NN), boosted regression trees (BRTs), SVMs, and geographically weighted regression (GWR). Several other highly cited studies [147,148,149] within this cluster also employ various neural network models for digital soil mapping.
Our analysis of this cluster and an in-depth examination of the specific highly cited publications revealed that, due to the semantic ambiguity associated with ‘Cartography’, ‘Map’, and ‘Mapping’, the literature within the database for literature analysis encompassed not only fundamental research in cartographic theory, map design, and geographic information related to maps, but also to research that addressess the application of maps in specific contexts, such as land use, land cover, landslide susceptibility, etc. We observed that within the interdisciplinary intersection of neural networks and cartography, the purposes, objects, and environments related to cartography exhibited significant differences compared to traditional cartography, as emphasized by Renzhong et al. [150]. This includes distinctions in map types, spatial entities, dimensions of representation, and map roles, which display prominent generalized characteristics.

3.3. Core Scholars

Researchers represent the primary sources of authority in cartographic studies. Figure 9 provides a chronological graph of author collaborations. The radius of each node is proportional to the respective author’s publication volume. Lines connecting nodes symbolize collaborative relationships between two authors. The color transitions from cool to warm tones represent the publication years, ranging from earlier (inner rings) to later (outer rings). Authors clustered closely together indicate a higher level of collaboration. Table 7 presents the top 30 authors by publication volume.
When considering the graph and the table, it becomes evident that global cartographic researchers are generally dispersed but partially concentrated into three major clusters. This suggests greater collaboration within specific research directions in the intersection of cartography and neural networks, with relatively less cross-directional exchange. Due to the broad applicability of computer science research within this domain, some pioneering studies on neural network algorithms and models have been included in the database. The widespread application of these computer science studies has resulted in significantly higher citation and co-occurrence frequencies than related research within the field of neural network-based cartography.
The cluster at the lower right of the graph, centered around HE KM, extended a collaborative network linked to scholars like KRIZHEVSKY A, LECUN Y, RONNEBERGER O, SIMONYAN K, and others. This network primarily consists of scholars researching fundamental theories, algorithms, and models related to neural networks, who are also the core scholars in Clusters #1 and #3. They provide the theoretical basis and method models for the fusion of neural networks and cartography. Among them, HE KM specializes in computer vision and deep learning, thus becoming one of the most influential AI scholars in 2022. Alex Krizhevsky is a professor at the University of Toronto, Canada, researching deep learning and neural networks. His 2012 proposal of the AlexNet network provided a solid theoretical foundation for the widespread application of artificial intelligence techniques, particularly in fields like image classification and object recognition. Yann LeCun, the father of CNNs, is a lifelong professor at New York University and one of the ‘big three’ in deep learning, alongside Geoffrey Hinton and Yoshua Bengio. RONNEBERGER O is the creator of the convolutional neural network U-Net, which is widely applied in biomedical image segmentation.
In the clustered area at the bottom left of Figure 9, researchers that specialize in landslide susceptibility mapping belong to Cluster #0. The collaborative network centered around LEE S includes researchers like PRADHAN B, BREIMAN L, and BUI DT. Saro Lee is a researcher at the Korea Institute of Geoscience and Mineral Resources. Professor Biswajeet Pradhan specializes in applying remote sensing GIS and soft computing techniques to natural disasters and environmental issues in the Faculty of Engineering and Information Technology. Leo Breiman was an American statistician and probabilist, as well as one of the four authors of Classification and Regression Trees (CART) and its associated software, CARTR. He and Jerome Friedman pioneered the ACE (alternating conditional expectations) algorithm. His innovative algorithms and models have provided groundbreaking methods and tools for the fusion of cartography and neural networks.
The smaller cluster at the top of Figure 9, led by G. M. Foody, mainly consists of researchers specializing in land cover and digital soil mapping, thus representing the core scholars in Cluster #4. Giles M. Foody’s research interests focus on the interface between remote sensing, ecology, and informatics, particularly those involving image classification in land cover mapping and monitoring applications, i.e., where issues from sub-pixel to global scales are addressed.

3.4. Core Journals

Figure 10 illustrates a journal co-citation network composed of publications from 2013 to 2023 in cartography and neural networks. This network exhibits robust modularity. Over time, top-tier journals play a central role in this network, as evidenced by the number of links connected to each node. Density decreases with time while the number of clusters increases, indicating that more recent journals contribute to the intersection of cartography and neural networks, thus leading to a more diversified network of connections among top-tier journals. Table 8 presents the top twenty journals with the highest citation counts. ‘REMOTE SENS-BASEL’ had the highest citation count, with a remarkable 1109 citations, which was followed by ‘IEEE T GEOSCI REMOTE’ with 973 citations, ‘REMOTE SENS ENVIRON’ with 966 citations, and ‘INT J REMOTE SENS’ with 950 citations. From 2013 to 2018, ‘ENVIRON GEOL’ had the highest citation count, which was followed by ‘ECOL MODEL’, while ‘THESIS’ held the top position from 2014 to 2020. Notably, ‘IEEE ACCESS’, ‘PR MACH LEARN RES’, ‘APPL SCI-BASEL’, and ‘IEEE T NEUR NET LEAR’ garnered the most citations between 2021 and 2023. Furthermore, several journals with relatively high burst values were identified, including ‘ECOL MODEL’, ‘NATURE’, ‘NAT HAZARD EARTH SYS’, ‘WATER RESOUR RES’, ‘HYDROL PROCESS’, and ‘IEEE T NEURAL NETWOR’. These journals primarily belong to non-cartography disciplines.

3.5. Collaboration among Institutions

Through an analysis of the collaboration network, insights into the collaborative relationships among the research institutions in this field were revealed, shedding light on the major research forces in the intersection of cartography and neural networks. It can also facilitate the establishment of collaborative relationships between different research entities. Figure 11 displays a significant volume of research output from institutions such as the Chinese Academy of Sciences, Wuhan University, University of Chinese Academy of Sciences, China University of Geosciences, Helmholtz Association, Centre National de la Recherche Scientifique (CNRS), German Aerospace Center, University of Tehran, UDICE-French Research Universities, and the Ministry of Natural Resources of the People’s Republic of China. Table 9 ranks the top fifteen institutions by publication volume. These top fifteen institutions exhibit close cooperation and frequent exchanges among them. For example, the Chinese Academy of Sciences collaborates with Wuhan University, the University of Chinese Academy of Sciences, China University of Geosciences, Helmholtz Association, CNRS, German Aerospace Center, University of Tehran, UDICE-French Research Universities, and the Ministry of Natural Resources of the People’s Republic of China—these institutions with substantial research output share collaborative relationships. Additionally, there are several isolated institutions, as evident from the minor variations in the number of links each node possessed. Over time, as more organizations join the network, the connections between institutions become less clear and more dispersed.

3.6. Distribution of Countries

In addition to temporal analysis, the current developments at the intersection of cartography and neural networks can be comprehensively examined through spatial analysis. As delineated in Figure 12, this spatial analysis encompasses a network comprising 106 nodes interconnected by 660 links. This global perspective underscores the widespread international engagement in research endeavors that employ neural networks for cartographic applications. This collaborative network reveals that several nations actively participate, with the United States, Germany, China, Spain, France, and the United Kingdom serving as pivotal hubs in this intricate web of collaboration. Notably, China emerged as the foremost contributor to research output in this domain, boasting 992 publications. Following closely, the United States ranked second with 433 publications, while Iran, India, and Germany followed with 183, 180, and 155 publications, respectively. Consequently, it was discernible that China and the United States wield significant influence as the principal research entities in this field. To provide a more discernible portrayal of the spatial distribution of research output, we compiled a comprehensive tabulation, as depicted in Table 10. This tabulation was based on the publication volumes attributed to each nation. Remarkably, the top ten nations collectively contributed to nearly 80% of the total published papers, thus underscoring their predominant roles in shaping the trajectory of advancements in this field.

4. Limitations

This systematic review critically evaluated the citation patterns from datasets extracted from the scholarly literature. The breadth of the data was inherently limited by the source of the scientific databases and the specific queries utilized.
Firstly, our primary focus was on journal articles and conference papers published in English, intentionally excluding other forms of scholarly outputs like books, patents, and additional publications.
Secondly, significant limitations and constraints were associated with the use of Web of Science (WOS) data. WOS does not index every journal, conference, or their respective proceedings, which may lead to a more conservative depiction of inter-article connections compared to other indexing platforms such as Google Scholar. Our preference for WOS is driven by the lack of detailed information, such as abstracts and keywords, that are otherwise available in alternative databases.
Finally, it is essential to adopt a dialectical approach to interpreting the results of co-citation network analysis. The principle of co-citation analysis in CiteSpace means that the ranking of nodes—such as themes, scholars, or journals—is determined merely by the frequency with which they are cited, thus indicating their ‘popularity’ in the analysis. For instance, journals focusing on areas like remote sensing may receive more citations due to the significant attention they attract within certain fields. However, this does not imply that remote sensing is the mainstream within the field of cartography, nor does it suggest that the primary purpose of maps is merely to produce outputs.

5. Conclusions

Over the past century, maps and cartography have witnessed rapid development, assimilating theories, methods, and technologies from neighboring disciplines, thus ultimately culminating in a comprehensive and contemporary theory of cartography. The advent of the era of artificial intelligence presents a unique historical opportunity for the next phase of advancement in cartography while simultaneously posing formidable challenges.
In this study, CiteSpace was used to analyze the integration of cartography and neural networks over the past decade (2013–2023). This analysis unveiled the prevailing research trends and cutting-edge investigations within this domain. Additionally, we categorized knowledge clusters within the integration of cartography and neural networks, identifying primary clusters within the knowledge mapping and determining the key research contributions to their development. Temporal analysis was conducted to trace the origins, evolution and current status of these studies.
Furthermore, we mapped the contributions of authors, journals, institutions, and countries involved in this research. This mapping aided in identifying and visualizing the primary contributing factors to the evolution of knowledge mapping encompassing cartography and neural networks. Our findings indicate that, as different disciplines incorporate cartographic concepts and apply mapping techniques, the research in cartography is increasingly acquiring a robust interdisciplinary foundation and character.

Author Contributions

Conceptualization, Shiyuan Cheng, Jiayao Wang, Jianchen Zhang and Guangxia Wang; methodology, Shiyuan Cheng; software, Shiyuan Cheng; validation, Zheng Zhou, Jin Du and Lijun Wang; formal analysis, Shiyuan Cheng and Jianchen Zhang; investigation, Jianchen Zhang and Ning Li; resources, Jiayao Wang; data curation, Shiyuan Cheng; writing—original draft preparation, Shiyuan Cheng; writing—review and editing, Shiyuan Cheng, Jianchen Zhang, Zheng Zhou, Jin Du and Lijun Wang; visualization, Shiyuan Cheng and Jianchen Zhang; supervision, Jiayao Wang, Jianchen Zhang and Guangxia Wang; project administration, Jianchen Zhang; funding acquisition, Jiayao Wang. All authors have read and agreed to the published version of the manuscript.

Funding

This work was supported by the National Natural Science Foundation of China under grant [number U21A2014]; the Natural Science Foundation of Henan Province under grant [number 232300420436, 232300420432]; the Open Fund of Key Laboratory of Urban Land Resources Monitoring and Simulation, Ministry of Natural Resources under grant [number KF-2022-07-020]; the Key Laboratory of Geospatial Technology for Middle and Lower Yellow River Regions (Henan University) and the Ministry of Education open project under grant [number GTYR202203]; Henan Collaborative Innovation Center of Geo-Information Technology for Smart Central Plains under grant [number 2023C001]; and the Science and Technology Development Project of Henan Province under grant [number 242102210175].

Institutional Review Board Statement

Not applicable.

Informed Consent Statement

Not applicable.

Data Availability Statement

The data and codes that support the findings of this study are available with identifiers at the private link (https://github.com/CatherineCheng01/Cartography-and-Neural-Networks accessed on 27 May 2024).

Acknowledgments

We sincerely thank the anonymous reviewers for their constructive comments and insightful suggestions, which greatly improved the quality of this manuscript.

Conflicts of Interest

The authors declare no conflicts of interest.

Abbreviations

The following abbreviations are used in this manuscript:
GISGeographic Information System
SCI-EXPANDEDScience Citation Index Expanded
SSCISocial Sciences Citation Index
AHCIArts & Humanities Citation Index
ESCIEmerging Sources Citation Index
CPCI-SConference Proceedings Citation Index—Science
CPCI-SSHConference Proceedings Citation Index—Social Science & Humanities
ANNArtificial Neural Network
CNNConvolutional Neural Network
SVMSupport Vector Machine
LLRLog-Likelihood Ratio
LSPLandslide Susceptibility Prediction
MCDAMulti-Criteria Decision Analysis
SVRSupport Vector Regression
BLRBinary Logistic Regression
DTDecision Tree
MLPMultilayer Perceptron Neural Network
FCMFuzzy cognitive map
ISEMKIntelligent Expert System based on Cognitive Maps
MLMachine Learning
RKRegression Kriging
MLRMultiple Linear Regression
RFRandom forest
NNNeural Network
BRTBoosted Regression Tree
GWRGeographically Weighted Regression
CARTClassification and Regression Tree
ACEAlternating Conditional Expectation
CNRSCentre National de la Recherche Scientifique

References

  1. Tinghua, A. Some thoughts on deep learning enabling cartography. Acta Geod. Et Cartogr. Sin. 2021, 50, 1170. [Google Scholar]
  2. Jiayao, W. Cartography in the age of spatio-temporal big data. Acta Geod. Et Cartogr. Sin. 2017, 46, 1226. [Google Scholar]
  3. Konečný, M.; Cartwright, W. International Cartographic Association. In Joint Board of Geospatial Information Societies (JB GIS); United Nations Office for Outer Space Affairs (UNOOSA): Vienna, Austria, 2010. [Google Scholar]
  4. Zhong, E. Deep Mapping—A Critical Engagement of Cartography with Neuroscience. Geomat. Inf. Sci. Wuhan Univ. 2022, 47, 1988–2002. [Google Scholar]
  5. Bertin, J. Semiology of graphics: Diagrams, Networks, Maps. Ann. Assoc. Am. Geogr. 1983, 10, 10438353. [Google Scholar]
  6. Jiayao, W.; Fang, W.; Haowen, Y. Cartography: Its past, present and future. Acta Geod. Et Cartogr. Sin. 2022, 51, 829. [Google Scholar]
  7. Janowicz, K.; Gao, S.; McKenzie, G.; Hu, Y.; Bhaduri, B. GeoAI: Spatially explicit artificial intelligence techniques for geographic knowledge discovery and beyond. Int. J. Geogr. Inf. Sci. 2020, 34, 625–636. [Google Scholar] [CrossRef]
  8. Reichstein, M.; Camps-Valls, G.; Stevens, B.; Jung, M.; Denzler, J.; Carvalhais, N.; Prabhat, F. Deep learning and process understanding for data-driven Earth system science. Nature 2019, 566, 195–204. [Google Scholar] [CrossRef] [PubMed]
  9. Webster, J.; Watson, R.T. Analyzing the past to prepare for the future: Writing a literature review. Mis Q. 2002, 26, xiii–xxiii. [Google Scholar]
  10. Hart, C. Doing a Literature Review: Releasing the Research Imagination; Sage Publications Ltd.: Thousand Oaks, CA, USA, 2018; 352p. [Google Scholar]
  11. Li, X.; Ma, E.; Qu, H. Knowledge mapping of hospitality research- A visual analysis using CiteSpace. Int. J. Hosp. Manag. 2017, 60, 77–93. [Google Scholar] [CrossRef]
  12. Ma, J.; Law, R. Components of tourism research: Evidence from annals of tourism research. Anatolia 2009, 20, 62–74. [Google Scholar] [CrossRef]
  13. Crawford-Welch, S.; McCleary, K.W. An identification of the subject areas and research techniques used in five hospitality-related journals. Int. J. Hosp. Manag. 1992, 11, 155–167. [Google Scholar] [CrossRef]
  14. Yan, W.; Zhongxiang, C.; Shulei, Z.; Hongjian, L.; Linxiang, Z.; Ziyi, L. Visualized analysis of cartography research status. Geospat. Inf. 2018, 16, 5. [Google Scholar]
  15. Clarke, K.C.; Johnson, J.M.; Trainor, T. Contemporary American cartographic research: A review and prospective. Cartogr. Geogr. Inf. Sci. 2019, 46, 196–209. [Google Scholar] [CrossRef]
  16. Griffin, A.L.; Robinson, A.C.; Roth, R.E. Envisioning the future of cartographic research. Int. J. Cartogr. 2017, 3, 1–8. [Google Scholar] [CrossRef]
  17. Shi, H.; Jie, Y. Cognitive map research in the field of geography: A review and prospect. Prog. Geogr. 2022, 41, 13. [Google Scholar]
  18. Guangying, W.; Tinghua, A.; Lina, H.; Xiaoyu, B.; Leyi, F. Research progress analysis of map dynamic visualization based on bibliometrics. Sci. Surv. Mapp. 2021, 46, 10. [Google Scholar]
  19. Leng, S.; Gao, X.; Pei, T.; Zhang, G.; Chen, L.; Chen, X.; He, C.; He, D.; Li, X.; Lin, C.; et al. The Geographical Sciences during 1986—2015: From the Classics to the Frontiers; Springer: Berlin/Heidelberg, Germany, 2016. [Google Scholar]
  20. Bottini, R.; Doeller, C.F. Knowledge across reference frames: Cognitive maps and image spaces. Trends Cogn. Sci. 2020, 24, 606–619. [Google Scholar] [CrossRef] [PubMed]
  21. Musa, A.; Khan, S.; Mujahid, M.; El-Gaby, M. The shallow cognitive map hypothesis: A hippocampal framework for thought disorder in schizophrenia. Schizophrenia 2022, 8, 34. [Google Scholar] [CrossRef]
  22. Grossberg, S. Developmental designs and adult functions of cortical maps in multiple modalities: Perception, attention, navigation, numbers, streaming, speech, and cognition. Front. Neuroinform. 2020, 14, 4. [Google Scholar] [CrossRef]
  23. Bermudez-Contreras, E.; Clark, B.J.; Wilber, A. The neuroscience of spatial navigation and the relationship to artificial intelligence. Front. Comput. Neurosci. 2020, 14, 63. [Google Scholar] [CrossRef]
  24. Xu, Y.; Zhu, H.; Hu, C.; Liu, H.; Cheng, Y. Deep learning of DEM image texture for landform classification in the Shandong area, China. Front. Earth Sci. 2022, 16, 352–367. [Google Scholar] [CrossRef]
  25. Abdollahi, A.; Pradhan, B.; Shukla, N.; Chakraborty, S.; Alamri, A. Deep learning approaches applied to remote sensing datasets for road extraction: A state-of-the-art review. Remote Sens. 2020, 12, 1444. [Google Scholar] [CrossRef]
  26. Javan, F.D.; Samadzadegan, F.; Mehravar, S.; Toosi, A.; Khatami, R.; Stein, A. A review of image fusion techniques for pan-sharpening of high-resolution satellite imagery. ISPRS J. Photogramm. Remote Sens. 2021, 171, 101–117. [Google Scholar] [CrossRef]
  27. Pashaei, M.; Kamangir, H.; Starek, M.J.; Tissot, P. Review and evaluation of deep learning architectures for efficient land cover mapping with UAS hyper-spatial imagery: A case study over a wetland. Remote Sens. 2020, 12, 959. [Google Scholar] [CrossRef]
  28. Talukdar, S.; Singha, P.; Mahato, S.; Pal, S.; Liou, Y.A.; Rahman, A. Land-use land-cover classification by machine learning classifiers for satellite observations—A review. Remote Sens. 2020, 12, 1135. [Google Scholar] [CrossRef]
  29. Ma, L.; Liu, Y.; Zhang, X.; Ye, Y.; Yin, G.; Johnson, B.A. Deep learning in remote sensing applications: A meta-analysis and review. ISPRS J. Photogramm. Remote Sens. 2019, 152, 166–177. [Google Scholar] [CrossRef]
  30. Matin, S.S.; Pradhan, B. Challenges and limitations of earthquake-induced building damage mapping techniques using remote sensing images-A systematic review. Geocarto Int. 2022, 37, 6186–6212. [Google Scholar] [CrossRef]
  31. Kuras, A.; Brell, M.; Rizzi, J.; Burud, I. Hyperspectral and lidar data applied to the urban land cover machine learning and neural-network-based classification: A review. Remote Sens. 2021, 13, 3393. [Google Scholar] [CrossRef]
  32. Speel, P.H.; Shadbolt, N.; Vries, W.D.; Dam, P.H.V.; O’Hara, K. Knowledge Mapping for Industrial Purposes. 1999. Available online: https://api.semanticscholar.org/CorpusID:106808042 (accessed on 27 May 2024).
  33. Chen, C. CiteSpace II: Detecting and visualizing emerging trends and transient patterns in scientific literature. J. Am. Soc. Inf. Sci. Technol. 2006, 57, 359–377. [Google Scholar] [CrossRef]
  34. Chen, C.; Ibekwe-SanJuan, F.; Hou, J. The structure and dynamics of cocitation clusters: A multiple-perspective cocitation analysis. J. Am. Soc. Inf. Sci. Technol. 2010, 61, 1386–1409. [Google Scholar] [CrossRef]
  35. Chen, C.; Dubin, R.; Kim, M.C. Emerging trends and new developments in regenerative medicine: A scientometric update (2000–2014). Expert Opin. Biol. Ther. 2014, 14, 1295–1317. [Google Scholar] [CrossRef] [PubMed]
  36. Cui, X.P.M.; Yu, X.; Hua, W. How is CiteSpace Used and Cited in the Literature? An Analysis of the Articles Published in English and Chinese Core Journals; International Conference on Scientometrics and Informetrics: Wuhan, China, 2017. [Google Scholar]
  37. Cobo, M.J.; López-Herrera, A.G.; Herrera-Viedma, E.; Herrera, F. Science mapping software tools: Review, analysis, and cooperative study among tools. J. Am. Soc. Inf. Sci. Technol. 2011, 62, 1382–1402. [Google Scholar] [CrossRef]
  38. Chen, C. Science mapping: A systematic review of the literature. J. Data Inf. Sci. 2017, 2, 1–40. [Google Scholar] [CrossRef]
  39. Wei, F.; Grubesic, T.H.; Bishop, B.W. Exploring the GIS knowledge domain using CiteSpace. Prof. Geogr. 2015, 67, 374–384. [Google Scholar] [CrossRef]
  40. Grubesic, T.H.; Matisziw, T.C.; Murray, A.T.; Snediker, D. Comparative approaches for assessing network vulnerability. Int. Reg. Sci. Rev. 2008, 31, 88–112. [Google Scholar] [CrossRef]
  41. Wang, J.; Sun, Q.; Wang, G.; Jiang, N.; Li, X. Principles and Methods of Cartography; Science Press: Beijing, China, 2006. [Google Scholar]
  42. Wang, J.; Sun, Q.; Wang, G.; Jiang, N.; Li, X. Principles and Methods of Cartography-2; Science Press: Beijing, China, 2014. [Google Scholar]
  43. Liqiu, M. The constancy and volatility in cartography. Acta Geod. Et Cartogr. Sin. 2017, 46, 1637. [Google Scholar]
  44. Dong, W.; Zheng, L.; Liu, B.; Meng, L. Using eye tracking to explore differences in map-based spatial ability between geographers and non-geographers. ISPRS Int. J. Geo-Inf. 2018, 7, 337. [Google Scholar] [CrossRef]
  45. Wang, Y.; Wang, R.; Zhu, Y. Optimal path-finding through mental exploration based on neural energy field gradients. Cogn. Neurodynamics 2017, 11, 99–111. [Google Scholar] [CrossRef]
  46. Qin, F.; Zhu, Y.; Ao, T.; Chen, T. The development trend and research frontiers of distributed hydrological models—Visual bibliometric analysis based on citespace. Water 2021, 13, 174. [Google Scholar] [CrossRef]
  47. Rong, W.; Haowem, Y.; Zhonghui, W. Hotspots and trends visual analysis of Contour automated generalization. Sci. Surv. Mapp. 2021, 46, 167–176+193. [Google Scholar]
  48. Jaderberg, M.; Simonyan, K.; Zisserman, A.; Kavukcuoglu, K. Spatial transformer networks. Adv. Neural Inf. Process. Syst. 2015, 28. Available online: https://api.semanticscholar.org/CorpusID:6099034 (accessed on 27 May 2024).
  49. Wang, C.; Xu, R.; Xu, S.; Meng, W.; Wang, R.; Zhang, J.; Zhang, X. Towards accurate and efficient road extraction by leveraging the characteristics of road shapes. IEEE Trans. Geosci. Remote. Sens. 2023, 61, 4404616. [Google Scholar] [CrossRef]
  50. Long, J.; Shelhamer, E.; Darrell, T. Fully convolutional networks for semantic segmentation. In Proceedings of the IEEE Conference on Computer Vision and Pattern Recognition, Boston, MA, USA, 7–12 June 2015; pp. 3431–3440. [Google Scholar]
  51. He, K.; Zhang, X.; Ren, S.; Sun, J. Deep residual learning for image recognition. In Proceedings of the IEEE Conference on Computer Vision and Pattern Recognition, Las Vegas, NV, USA, 26 June–1 July 2016; pp. 770–778. [Google Scholar]
  52. LeCun, Y.; Bengio, Y.; Hinton, G. Deep learning. Nature 2015, 521, 436–444. [Google Scholar] [CrossRef] [PubMed]
  53. Pradhan, B.; Lee, S. Landslide susceptibility assessment and factor effect analysis: Backpropagation artificial neural networks and their comparison with frequency ratio and bivariate logistic regression modelling. Environ. Model. Softw. 2010, 25, 747–759. [Google Scholar] [CrossRef]
  54. Pradhan, B. A comparative study on the predictive ability of the decision tree, support vector machine and neuro-fuzzy models in landslide susceptibility mapping using GIS. Comput. Geosci. 2013, 51, 350–365. [Google Scholar] [CrossRef]
  55. Hu, J.; Shen, L.; Sun, G. Squeeze-and-excitation networks. In Proceedings of the IEEE Conference on Computer Vision and Pattern Recognition, Salt Lake, UT, USA, 18–23 June 2018; pp. 7132–7141. [Google Scholar]
  56. Badrinarayanan, V.; Kendall, A.; Cipolla, R. Segnet: A deep convolutional encoder-decoder architecture for image segmentation. IEEE Trans. Pattern Anal. Mach. Intell. 2017, 39, 2481–2495. [Google Scholar] [CrossRef] [PubMed]
  57. Chen, L.C.; Zhu, Y.; Papandreou, G.; Schroff, F.; Adam, H. Encoder-decoder with atrous separable convolution for semantic image segmentation. In Proceedings of the European Conference on Computer Vision (ECCV), Munich, Germany, 8–14 September 2018; pp. 801–818. [Google Scholar]
  58. Woo, S.; Park, J.; Lee, J.Y.; Kweon, I.S. Cbam: Convolutional block attention module. In Proceedings of the European Conference on Computer Vision (ECCV), Munich, Germany, 8–14 September 2018; pp. 3–19. [Google Scholar]
  59. Lin, T.Y.; Dollár, P.; Girshick, R.; He, K.; Hariharan, B.; Belongie, S. Feature pyramid networks for object detection. In Proceedings of the IEEE Conference on Computer Vision and Pattern Recognition, Honolulu, HI, USA, 21–26 July 2017; pp. 2117–2125. [Google Scholar]
  60. Huang, Y.; Zhao, L. Review on landslide susceptibility mapping using support vector machines. Catena 2018, 165, 520–529. [Google Scholar] [CrossRef]
  61. Devkota, K.C.; Regmi, A.D.; Pourghasemi, H.R.; Yoshida, K.; Pradhan, B.; Ryu, I.C.; Dhital, M.R.; Althuwaynee, O.F. Landslide susceptibility mapping using certainty factor, index of entropy and logistic regression models in GIS and their comparison at Mugling–Narayanghat road section in Nepal Himalaya. Nat. Hazards 2013, 65, 135–165. [Google Scholar] [CrossRef]
  62. Kavzoglu, T.; Sahin, E.K.; Colkesen, I. Landslide susceptibility mapping using GIS-based multi-criteria decision analysis, support vector machines, and logistic regression. Landslides 2014, 11, 425–439. [Google Scholar] [CrossRef]
  63. He, S.; Pan, P.; Dai, L.; Wang, H.; Liu, J. Application of kernel-based Fisher discriminant analysis to map landslide susceptibility in the Qinggan River delta, Three Gorges, China. Geomorphology 2012, 171, 30–41. [Google Scholar] [CrossRef]
  64. Aditian, A.; Kubota, T.; Shinohara, Y. Comparison of GIS-based landslide susceptibility models using frequency ratio, logistic regression, and artificial neural network in a tertiary region of Ambon, Indonesia. Geomorphology 2018, 318, 101–111. [Google Scholar] [CrossRef]
  65. Lin, G.F.; Chang, M.J.; Huang, Y.C.; Ho, J.Y. Assessment of susceptibility to rainfall-induced landslides using improved self-organizing linear output map, support vector machine, and logistic regression. Eng. Geol. 2017, 224, 62–74. [Google Scholar] [CrossRef]
  66. Vakhshoori, V.; Zare, M. Landslide susceptibility mapping by comparing weight of evidence, fuzzy logic, and frequency ratio methods. Geomat. Nat. Hazards Risk 2016, 7, 1731–1752. [Google Scholar] [CrossRef]
  67. Park, I.; Lee, S. Spatial prediction of landslide susceptibility using a decision tree approach: A case study of the Pyeongchang area, Korea. Int. J. Remote Sens. 2014, 35, 6089–6112. [Google Scholar] [CrossRef]
  68. Hong, H.; Pourghasemi, H.R.; Pourtaghi, Z.S. Landslide susceptibility assessment in Lianhua County (China): A comparison between a random forest data mining technique and bivariate and multivariate statistical models. Geomorphology 2016, 259, 105–118. [Google Scholar] [CrossRef]
  69. Huang, F.; Yao, C.; Liu, W.; Li, Y.; Liu, X. Landslide susceptibility assessment in the Nantian area of China: A comparison of frequency ratio model and support vector machine. Geomat. Nat. Hazards Risk 2018, 9, 919–938. [Google Scholar] [CrossRef]
  70. Huang, F.; Zhang, J.; Zhou, C.; Wang, Y.; Huang, J.; Zhu, L. A deep learning algorithm using a fully connected sparse autoencoder neural network for landslide susceptibility prediction. Landslides 2020, 17, 217–229. [Google Scholar] [CrossRef]
  71. Pradhan, B.; Lee, S. Landslide risk analysis using artificial neural network model focusing on different training sites. Int. J. Phys. Sci. 2009, 3, 1–15. [Google Scholar]
  72. Pourghasemi, H.R.; Mohammady, M.; Pradhan, B. Landslide susceptibility mapping using index of entropy and conditional probability models in GIS: Safarood Basin, Iran. Catena 2012, 97, 71–84. [Google Scholar] [CrossRef]
  73. Song, Y.; Gong, J.; Gao, S.; Wang, D.; Cui, T.; Li, Y.; Wei, B. Susceptibility assessment of earthquake-induced landslides using Bayesian network: A case study in Beichuan, China. Comput. Geosci. 2012, 42, 189–199. [Google Scholar] [CrossRef]
  74. Chen, W.; Panahi, M.; Tsangaratos, P.; Shahabi, H.; Ilia, I.; Panahi, S.; Li, S.; Jaafari, A.; Ahmad, B.B. Applying population-based evolutionary algorithms and a neuro-fuzzy system for modeling landslide susceptibility. Catena 2019, 172, 212–231. [Google Scholar] [CrossRef]
  75. Tien Bui, D.; Pradhan, B.; Lofman, O.; Revhaug, I. Landslide susceptibility assessment in vietnam using support vector machines, decision tree, and Naive Bayes Models. Math. Probl. Eng. 2012, 2012, 974638. [Google Scholar] [CrossRef]
  76. Huang, F.; Cao, Z.; Guo, J.; Jiang, S.H.; Li, S.; Guo, Z. Comparisons of heuristic, general statistical and machine learning models for landslide susceptibility prediction and mapping. Catena 2020, 191, 104580. [Google Scholar] [CrossRef]
  77. Qi, C.R.; Su, H.; Mo, K.; Guibas, L.J. Pointnet: Deep learning on point sets for 3d classification and segmentation. In Proceedings of the IEEE Conference on Computer Vision and Pattern Recognition, Honolulu, HI, USA, 21–26 July 2017; pp. 652–660. [Google Scholar]
  78. García Balboa, J.L.; Ariza López, F.J. Generalization-oriented road line classification by means of an artificial neural network. Geoinformatica 2008, 12, 289–312. [Google Scholar] [CrossRef]
  79. Liu, K.; Ma, J. Research on Intelligent Selection of Road Network Automatic Generalization Based on Kernel-Based Machine Learning; Nanjing University: Nanjing, China, 2017. [Google Scholar]
  80. He, H.; Qian, H.; Liu, C.; Xie, L. Auto generalization of settlement by using decision tree algorithm. J. Geomat. Sci. Technol. 2016, 33, 623–628. [Google Scholar]
  81. Xi, D.; Hu, X.; Yang, L.; Yang, N.; Liu, Y.; Jiang, H. Research on map emotional semantics using deep learning approach. Cartogr. Geogr. Inf. Sci. 2023, 50, 465–480. [Google Scholar] [CrossRef]
  82. Li, H.; Wang, Z.; Yin, G.; Deng, H.; Yang, X.; Yao, R.; Gao, P.; Cao, R. A multi-feature fusion and SSAE-Based deep network for image semantic recognition. In Proceedings of the 2019 IEEE Fifth International Conference on Big Data Computing Service and Applications (BigDataService), Newark, CA, USA, 4–9 April 2019; IEEE: Piscataway, NJ, USA, 2019; pp. 322–327. [Google Scholar]
  83. Das, P.; Ghosh, A.; Majumdar, R. Determining attention mechanism for visual sentiment analysis of an image using svm classifier in deep learning based architecture. In Proceedings of the 2020 8th International Conference on Reliability, Infocom Technologies and Optimization (Trends and Future Directions) (ICRITO), Noida, India, 4–5 June 2020; IEEE: Piscataway, NJ, USA, 2020; pp. 339–343. [Google Scholar]
  84. Zheng, W.; Haoyue, L.; Hongshan, X.; Meijun, S. Chinese Painting Emotion Classification Based onConvolution Neural Network and SVM. J. Nanjing Norm. Univ. 2017, 40, 74–79. [Google Scholar]
  85. Lu, X.; Suryanarayan, P.; Adams Jr, R.B.; Li, J.; Newman, M.G.; Wang, J.Z. On shape and the computability of emotions. In Proceedings of the 20th ACM International Conference on Multimedia, Nara, Japan, 29 October–2 November 2012; pp. 229–238. [Google Scholar]
  86. Zhao, S.; Gao, Y.; Jiang, X.; Yao, H.; Chua, T.S.; Sun, X. Exploring principles-of-art features for image emotion recognition. In Proceedings of the 22nd ACM International Conference on Multimedia, Orlando, FL, USA, 7 November 2014; pp. 47–56. [Google Scholar]
  87. Sen, A.; Gokgoz, T.; Sester, M. Model generalization of two different drainage patterns by self-organizing maps. Cartogr. Geogr. Inf. Sci. 2014, 41, 151–165. [Google Scholar] [CrossRef]
  88. Yan, X.; Ai, T.; Yang, M.; Yin, H. A graph convolutional neural network for classification of building patterns using spatial vector data. ISPRS J. Photogramm. Remote Sens. 2019, 150, 259–273. [Google Scholar] [CrossRef]
  89. Taravat, A.; Rajaei, M.; Emadodin, I. Urbanization dynamics of Tehran city (1975–2015) using artificial neural networks. J. Maps 2017, 13, 24–30. [Google Scholar] [CrossRef]
  90. Schnürer, R.; Sieber, R.; Schmid-Lanter, J.; Öztireli, A.C.; Hurni, L. Detection of pictorial map objects with convolutional neural networks. Cartogr. J. 2021, 58, 50–68. [Google Scholar] [CrossRef]
  91. Krizhevsky, A.; Sutskever, I.; Hinton, G.E. ImageNet classification with deep convolutional neural networks. Commun. ACM 2017, 60, 84–90. [Google Scholar] [CrossRef]
  92. Du, J.; Wu, F.; Yin, J.; Liu, C.; Gong, X. Polyline simplification based on the artificial neural network with constraints of generalization knowledge. Cartogr. Geogr. Inf. Sci. 2022, 49, 313–337. [Google Scholar] [CrossRef]
  93. Zhou, Q.; Li, Z. Use of artificial neural networks for selective omission in updating road networks. Cartogr. J. 2014, 51, 38–51. [Google Scholar] [CrossRef]
  94. Rousi, E.; Mimis, A.; Stamou, M.; Anagnostopoulou, C. Classification of circulation types over Eastern mediterranean using a self-organizing map approach. J. Maps 2014, 10, 232–237. [Google Scholar] [CrossRef]
  95. Helbich, M.; Hagenauer, J.; Leitner, M.; Edwards, R. Exploration of unstructured narrative crime reports: An unsupervised neural network and point pattern analysis approach. Cartogr. Geogr. Inf. Sci. 2013, 40, 326–336. [Google Scholar] [CrossRef]
  96. Jiang, B.; Harrie, L. Selection of streets from a network using self-organizing maps. Trans. GIS 2004, 8, 335–350. [Google Scholar] [CrossRef]
  97. Sester, M. Self-Organizing Maps for Density-Preserving Reduction of Objects in Cartographic Generalization. In Self-Organising Maps: Applications in Geographic Information Science; John Wiley & Sons: Hoboken, NJ, USA, 2008; pp. 107–120. [Google Scholar]
  98. Şen, A.; Gökgöz, T. Clustering approaches for hydrographic generalization. In Proceedings of the 9th International Symposium on Surface Models for Geosciences (GIS), Ostrava, Czech Republic, 23–25 October 2012; pp. 23–25. [Google Scholar]
  99. Yan, C.; Liu, X.; Boota, M.W.; Pan, Z. A Comparison of Machine Learning Methods Applied to the Automated Selection of River Networks. Cartogr. J. 2022, 59, 187–202. [Google Scholar] [CrossRef]
  100. Yang, M.; Kong, B.; Dang, R.; Yan, X. Classifying urban functional regions by integrating buildings and points-of-interest using a stacking ensemble method. Int. J. Appl. Earth Obs. Geoinf. 2022, 108, 102753. [Google Scholar] [CrossRef]
  101. Cheng, B.; Liu, Q.; Li, X.; Wang, Y. Building simplification using backpropagation neural networks: A combination of cartographers’ expertise and raster-based local perception. GIScience Remote Sens. 2013, 50, 527–542. [Google Scholar] [CrossRef]
  102. Wang, Y.; Lv, H.; Chen, X.; Du, Q. A PSO-neural network-based feature matching approach in data integration. In Proceedings of the Cartography-Maps Connecting the World: 27th International Cartographic Conference 2015-ICC2015, Rio de Janeiro, Brazil, 23–28 August 2015; Springer: Berlin/Heidelberg, Germany, 2015; pp. 189–219. [Google Scholar]
  103. Duan, W.; Chiang, Y.; Knoblock, C.A.; Leyk, S.; Uhl, J. Automatic generation of precisely delineated geographic features from georeferenced historical maps using deep learning. In Proceedings of the AutoCarto, Madison, WI, USA, 22–24 May 2018. [Google Scholar]
  104. Feng, Y.; Thiemann, F.; Sester, M. Learning cartographic building generalization with deep convolutional neural networks. ISPRS Int. J. Geo-Inf. 2019, 8, 258. [Google Scholar] [CrossRef]
  105. Dodge, S.; Xu, J.; Stenger, B. Parsing floor plan images. In Proceedings of the 2017 Fifteenth IAPR International Conference on Machine Vision Applications (MVA), Nagoya, Japan, 8–12 May 2017; IEEE: Piscataway, NJ, USA, 2017; pp. 358–361. [Google Scholar]
  106. Liu, C.; Wu, J.; Kohli, P.; Furukawa, Y. Raster-to-vector: Revisiting floorplan transformation. In Proceedings of the Proceedings of the IEEE International Conference on Computer Vision, Venice, Italy, 22–29 October 2017; pp. 2195–2203. [Google Scholar]
  107. Ziran, Z.; Marinai, S. Object detection in floor plan images. In Proceedings of the Artificial Neural Networks in Pattern Recognition: 8th IAPR TC3 Workshop, ANNPR 2018, Siena, Italy, 19–21 September 2018; Proceedings 8. Springer: Berlin/Heidelberg, Germany, 2018; pp. 383–394. [Google Scholar]
  108. Sester, M.; Feng, Y.; Thiemann, F. Building generalization using deep learning. ISPRS-Int. Arch. Photogramm. Remote Sens. Spat. Inf. Sci. XLII-4 2018, 42, 565–572. [Google Scholar] [CrossRef]
  109. Xiao, T.; Ai, T.; Yu, H.; Yang, M.; Liu, P. A point selection method in map generalization using graph convolutional network model. Cartogr. Geogr. Inf. Sci. 2023, 51, 20–40. [Google Scholar] [CrossRef]
  110. Wang, Y.; Yao, Q.; Kwok, J.T.; Ni, L.M. Generalizing from a few examples: A survey on few-shot learning. ACM Comput. Surv. 2020, 53, 1–34. [Google Scholar] [CrossRef]
  111. Zhao, R.; Ai, T.; Yu, W.; He, Y.; Shen, Y. Recognition of building group patterns using graph convolutional network. Cartogr. Geogr. Inf. Sci. 2020, 47, 400–417. [Google Scholar] [CrossRef]
  112. Du, J.; Wu, F.; Xing, R.; Gong, X.; Yu, L. Segmentation and sampling method for complex polyline generalization based on a generative adversarial network. Geocarto Int. 2022, 37, 4158–4180. [Google Scholar] [CrossRef]
  113. Kang, Y.; Gao, S.; Roth, R.E. Transferring multiscale map styles using generative adversarial networks. Int. J. Cartogr. 2019, 5, 115–141. [Google Scholar] [CrossRef]
  114. Yan, X.; Yang, M. A deep learning approach for polyline and building simplification based on graph autoencoder with flexible constraints. Cartogr. Geogr. Inf. Sci. 2023, 51, 79–96. [Google Scholar] [CrossRef]
  115. Touya, G.; Zhang, X.; Lokhat, I. Is deep learning the new agent for map generalization? Int. J. Cartogr. 2019, 5, 142–157. [Google Scholar] [CrossRef]
  116. Li, C.; Zhang, H.; Wu, P.; Yin, Y.; Liu, S. A complex junction recognition method based on GoogLeNet model. Trans. GIS 2020, 24, 1756–1778. [Google Scholar] [CrossRef]
  117. Sun, Y.; Guo, Q.; Liu, Y.; Ma, X.; Weng, J. An immune genetic algorithm to buildings displacement in cartographic generalization. Trans. GIS 2016, 20, 585–612. [Google Scholar] [CrossRef]
  118. Courtial, A.; Touya, G.; Zhang, X. Deriving map images of generalised mountain roads with generative adversarial networks. Int. J. Geogr. Inf. Sci. 2023, 37, 499–528. [Google Scholar] [CrossRef]
  119. Yu, W.; Chen, Y. Data-driven polyline simplification using a stacked autoencoder-based deep neural network. Trans. GIS 2022, 26, 2302–2325. [Google Scholar] [CrossRef]
  120. Li, W.; Hsu, C.Y. Automated terrain feature identification from remote sensing imagery: A deep learning approach. Int. J. Geogr. Inf. Sci. 2020, 34, 637–660. [Google Scholar] [CrossRef]
  121. Xie, Y.; Cai, J.; Bhojwani, R.; Shekhar, S.; Knight, J. A locally-constrained YOLO framework for detecting small and densely-distributed building footprints. Int. J. Geogr. Inf. Sci. 2020, 34, 777–801. [Google Scholar] [CrossRef]
  122. Yan, X.; Ai, T.; Yang, M.; Tong, X. Graph convolutional autoencoder model for the shape coding and cognition of buildings in maps. Int. J. Geogr. Inf. Sci. 2021, 35, 490–512. [Google Scholar] [CrossRef]
  123. Huang, X.; Xu, D.; Li, Z.; Wang, C. Translating multispectral imagery to nighttime imagery via conditional generative adversarial networks. In Proceedings of the IGARSS 2020–2020 IEEE International Geoscience and Remote Sensing Symposium, Waikoloa, HI, USA, 26 September–2 October 2020; IEEE: Piscataway, NJ, USA, 2020; pp. 6758–6761. [Google Scholar]
  124. Jenny, B.; Heitzler, M.; Singh, D.; Farmakis-Serebryakova, M.; Liu, J.C.; Hurni, L. Cartographic relief shading with neural networks. IEEE Trans. Vis. Comput. Graph. 2020, 27, 1225–1235. [Google Scholar] [CrossRef] [PubMed]
  125. Felix, G.; Nápoles, G.; Falcon, R.; Froelich, W.; Vanhoof, K.; Bello, R. A review on methods and software for fuzzy cognitive maps. Artif. Intell. Rev. 2019, 52, 1707–1737. [Google Scholar] [CrossRef]
  126. Kosko, B. Fuzzy cognitive maps. Int. J. Man-Mach. Stud. 1986, 24, 65–75. [Google Scholar] [CrossRef]
  127. Haeri, S.A.S.; Rezaei, J. A grey-based green supplier selection model for uncertain environments. J. Clean. Prod. 2019, 221, 768–784. [Google Scholar] [CrossRef]
  128. Nápoles, G.; Papageorgiou, E.; Bello, R.; Vanhoof, K. On the convergence of sigmoid fuzzy cognitive maps. Inf. Sci. 2016, 349, 154–171. [Google Scholar] [CrossRef]
  129. Chi, Y.; Liu, J. Learning of fuzzy cognitive maps with varying densities using a multiobjective evolutionary algorithm. IEEE Trans. Fuzzy Syst. 2015, 24, 71–81. [Google Scholar] [CrossRef]
  130. Nápoles, G.; Mosquera, C.; Falcon, R.; Grau, I.; Bello, R.; Vanhoof, K. Fuzzy-rough cognitive networks. Neural Netw. 2018, 97, 19–27. [Google Scholar] [CrossRef] [PubMed]
  131. Gao, R.; Du, L.; Yuen, K.F. Robust empirical wavelet fuzzy cognitive map for time series forecasting. Eng. Appl. Artif. Intell. 2020, 96, 103978. [Google Scholar] [CrossRef]
  132. Nápoles, G.; Falcon, R.; Papageorgiou, E.; Bello, R.; Vanhoof, K. Rough cognitive ensembles. Int. J. Approx. Reason. 2017, 85, 79–96. [Google Scholar] [CrossRef]
  133. Summerfield, C.; Luyckx, F.; Sheahan, H. Structure learning and the posterior parietal cortex. Prog. Neurobiol. 2020, 184, 101717. [Google Scholar] [CrossRef] [PubMed]
  134. Samarasinghe, S.; Strickert, G. Mixed-method integration and advances in fuzzy cognitive maps for computational policy simulations for natural hazard mitigation. Environ. Model. Softw. 2013, 39, 188–200. [Google Scholar] [CrossRef]
  135. Bakhtavar, E.; Hosseini, S.; Hewage, K.; Sadiq, R. Green blasting policy: Simultaneous forecast of vertical and horizontal distribution of dust emissions using artificial causality-weighted neural network. J. Clean. Prod. 2021, 283, 124562. [Google Scholar] [CrossRef]
  136. Tang, H.; Yan, R.; Tan, K.C. Cognitive navigation by neuro-inspired localization, mapping, and episodic memory. IEEE Trans. Cogn. Dev. Syst. 2017, 10, 751–761. [Google Scholar] [CrossRef]
  137. Froelich, W. Towards improving the efficiency of the fuzzy cognitive map classifier. Neurocomputing 2017, 232, 83–93. [Google Scholar] [CrossRef]
  138. Yuan, K.; Liu, J.; Yang, S.; Wu, K.; Shen, F. Time series forecasting based on kernel mapping and high-order fuzzy cognitive maps. Knowl.-Based Syst. 2020, 206, 106359. [Google Scholar] [CrossRef]
  139. Liu, P.; Liu, J.; Wu, K. CNN-FCM: System modeling promotes stability of deep learning in time series prediction. Knowl.-Based Syst. 2020, 203, 106081. [Google Scholar] [CrossRef]
  140. Song, H.; Miao, C.; Roel, W.; Shen, Z.; Catthoor, F. Implementation of fuzzy cognitive maps based on fuzzy neural network and application in prediction of time series. IEEE Trans. Fuzzy Syst. 2009, 18, 233–250. [Google Scholar]
  141. Song, H.; Miao, C.; Shen, Z.; Roel, W.; Maja, D.; Francky, C. Design of fuzzy cognitive maps using neural networks for predicting chaotic time series. Neural Netw. 2010, 23, 1264–1275. [Google Scholar] [CrossRef] [PubMed]
  142. Poczęta, K.; Yastrebov, A.; Papageorgiou, E.I. Learning fuzzy cognitive maps using structure optimization genetic algorithm. In Proceedings of the 2015 Federated Conference on Computer Science and Information Systems (FedCSIS), Lodz, Poland, 13–16 September 2015; IEEE: Piscataway, NJ, USA, 2015; pp. 547–554. [Google Scholar]
  143. Papageorgiou, E.I.; Poczęta, K.; Laspidou, C. Hybrid model for water demand prediction based on fuzzy cognitive maps and artificial neural networks. In Proceedings of the 2016 IEEE International Conference on Fuzzy Systems (FUZZ-IEEE), Vancouver, BC, Canada, 24–29 July 2016; IEEE: Piscataway, NJ, USA, 2016; pp. 1523–1530. [Google Scholar]
  144. Brungard, C.W.; Boettinger, J.L.; Duniway, M.C.; Wills, S.A.; Edwards Jr, T.C. Machine learning for predicting soil classes in three semi-arid landscapes. Geoderma 2015, 239, 68–83. [Google Scholar] [CrossRef]
  145. Taghizadeh-Mehrjardi, R.; Nabiollahi, K.; Kerry, R. Digital mapping of soil organic carbon at multiple depths using different data mining techniques in Baneh region, Iran. Geoderma 2016, 266, 98–110. [Google Scholar] [CrossRef]
  146. Were, K.; Bui, D.T.; Dick, Ø.B.; Singh, B.R. A comparative assessment of support vector regression, artificial neural networks, and random forests for predicting and mapping soil organic carbon stocks across an Afromontane landscape. Ecol. Indic. 2015, 52, 394–403. [Google Scholar] [CrossRef]
  147. Behrens, T.; Förster, H.; Scholten, T.; Steinrücken, U.; Spies, E.D.; Goldschmitt, M. Digital soil mapping using artificial neural networks. J. Plant Nutr. Soil Sci. 2005, 168, 21–33. [Google Scholar] [CrossRef]
  148. Jafari, A.; Ayoubi, S.; Khademi, H.; Finke, P.; Toomanian, N. Selection of a taxonomic level for soil mapping using diversity and map purity indices: A case study from an Iranian arid region. Geomorphology 2013, 201, 86–97. [Google Scholar] [CrossRef]
  149. Moonjun, R.; Farshad, A.; Shrestha, D.; Vaiphasa, C. Artificial neural network and decision tree in predictive soil mapping of Hoi Num Rin sub-watershed, Thailand. In Digital Soil Mapping: Bridging Research, Environmental Application, and Operation; Springer Science & Business Media: Berlin, Germany, 2010; pp. 151–164. [Google Scholar]
  150. Renzhong, G.; Yebin, C.; Zhigang, Z.; Biao, H.; Guonian, Y.; Zhilin, L.; Shen, Y.; Ding, M. A theoretical framework for the study of pan-maps. J. Geomat. 2021, 46, 9–15. [Google Scholar]
Figure 1. Classification of modern maps and the framework of modern cartographic disciplines [42].
Ijgi 13 00178 g001
Figure 2. The distribution of the bibliographic records in Set #8.
Ijgi 13 00178 g002
Figure 3. Reference co-citation network.
Ijgi 13 00178 g003
Figure 4. Top 25 references with the strongest citation bursts.
Ijgi 13 00178 g004
Figure 5. Landscape view.
Ijgi 13 00178 g005
Figure 6. Timeline view.
Ijgi 13 00178 g006
Figure 7. Major cited articles in Cluster #0.
Ijgi 13 00178 g007
Figure 8. The co-occurrence trend of the node ‘Convolutional neural network’.
Ijgi 13 00178 g008
Figure 9. Author co-citation network.
Ijgi 13 00178 g009
Figure 10. Journal co-citation network.
Ijgi 13 00178 g010
Figure 11. Collaborative network of institutions.
Ijgi 13 00178 g011
Figure 12. Collaborative network of countries.
Ijgi 13 00178 g012
Table 1. The topic search queries used for data collection.
SetResultsDetails
#1 AND #7
#83604Indexes=SCI-EXPANDED, SSCI, A&HCI, ESCI, CPCI-S, CPCI-SSH
Timespan=All years
#6 OR #5 OR #4 OR #3 OR #2
#798,729Indexes=SCI-EXPANDED, SSCI, A&HCI, ESCI, CPCI-S, CPCI-SSH
  Timespan=All years
(TS=(cartograph*) OR TS=(map*)) AND (SJ==(‘PHYSICAL GEOGRAPHY’ OR ‘GEOGRAPHY’))
#630,194Indexes=SCI-EXPANDED, SSCI, A&HCI, ESCI, CPCI-S, CPCI-SSH
  Timespan=All years
(TS=(cartograph*) OR TS=(map*)) AND TS=(geograph*)
#548,030Indexes=SCI-EXPANDED, SSCI, A&HCI, ESCI, CPCI-S, CPCI-SSH
  Timespan=All years
TS=(‘map visualization*’) OR TS=(‘cartographic visualization*’)
  OR TS=(‘geovisualization*’) OR TS=(geovisualisation*) OR TS=(‘map generalization*’)
  OR TS=(‘cartographic generalization*’) OR TS=(‘map design*’)
#43388OR TS=(‘cartographic design*’) OR TS=(‘integrated mapping*’) OR TS=(‘map updat*’)
  OR TS=(‘map recognition*’) OR TS=(‘symbol recognition*’) OR TS=(‘map simplif*’)
  OR TS=(‘map collapse*’) OR TS=(‘map enhance*’)
  Indexes=SCI-EXPANDED, SSCI, A&HCI, ESCI, CPCI-S, CPCI-SSH
  Timespan=All years
(TS=(cartograph*) OR TS=(map*)) AND (TS=(‘spatial cognition’)
  OR TS=(‘information transmission’) OR TS=(‘map model’)
#38407OR TS=(‘cartographic model’) OR TS=(‘digital elevation model’)
  OR TS=(‘digital surface model’) OR TS=(‘digital terrain model’))
  Indexes=SCI-EXPANDED, SSCI, A&HCI, ESCI, CPCI-S, CPCI-SSH
  Timespan=All years
TS=(‘topographic map*’) OR TS=(‘topological map*’) OR TS=(‘geographic map*’)
  OR TS=(‘geologic map*’) OR TS=(‘geological map*’) OR TS=(‘thematic map*’)
  OR TS=(‘thematic cartograph*’) OR TS=(‘web map*’) OR TS=(‘online atlase*’)
#226,314OR TS=(‘web cartograph*’) OR TS=(‘digital cartograph*’) OR TS=(‘computer cartograph*’)
  OR TS=(‘mental map*’) OR TS=(‘cognitive map*’) OR ((TS=(cartograph*) OR TS=(map*))
  AND (TS=(‘digital line’) OR TS=(‘digital orthophoto’) OR TS=(‘digital raster’)))
  Indexes=SCI-EXPANDED, SSCI, A&HCI, ESCI, CPCI-S, CPCI-SSH
  Timespan=All years
TS=(‘neural network*’)
#1521,498Indexes=SCI-EXPANDED, SSCI, A&HCI, ESCI, CPCI-S, CPCI-SSH
  Timespan=All years
Table 2. Specific representation of the nodes and links in knowledge mapping.
Reference Co-Citation NetworkLandscape View of the Co-Occurrence NetworkTime ViewAuthor Co-Citation NetworkJournal Co-Citation NetworkCollaborative Network of InstitutionCollaborative Network of Country
NodeReferenceKeywordKeywordAuthorJournalInstitutionCountry
Node sizeNumber of citationsFrequency of keyword co-occurrenceNumber of citationsNumber of published articles
Node colorCorresponding citation yearCorresponding occurrence yearCorresponding citation yearCorresponding publication year
The purple circle on the outermost side: relatively high degree of centrality
LinkCo-citationco-occurrenceCo-citationCo-citation or co-occurrence
The thickness of the lineNullFrequency of keyword citationFrequency of co-occurrenceThe closeness of the partnership
Link colorFirst co-cited yearFirst simultaneously co-occurrence yearFirst co-cited yearSimultaneously published year
Table 3. The detailed parameters of CiteSpace.
CiteSpaceParameters
Time Slicing2013–2023
Term Source (Text Processing)Title/abstract/author keywords/keywords plus
Node TypesKeyword;
Author;
Reference;
Institution;
Country;
Cited author;
Cited journal
LinksStrength: Cosine
Scope: Within slices
Selection CriteriaSelect top 50 levels of most cited or occurred items from each slice
Table 4. Merge of the duplicate nodes.
Final NodesMerged Nodes
Neural networkNeural networks
AlgorithmAlgorithms
Artificial neural networkArtificial neural networks
& Artificial neural network (ann)
& Artificial neural networks (anns)
& Artificial neural networks (ann)
ModelModels
GISGeographic Information System (GIS)
& Geographic information systems (GIS)
PredictionSpatial prediction
AreaAreas
Convolutional neural networkConvolutional neural networks
& Convolutional neural network (cnn)
& Convolutional neural networks (cnns)
Remote sensingRemote sensing data
& Remote sensing image
Cognitive mapFuzzy cognitive maps
& Fuzzy cognitive mapping
Support vector machineSupport vector machines
& Support vector machine (svm)
& Support vector machines (svms)
Random forestRandom forests
Land coverLand cover classification
SystemSystems
Table 5. Details of the knowledge clusters.
Cluster-IDSizeSilhouetteMean YearRepresentative Terms (LLR)
Landslide susceptibility;
GIS;
0480.9122014Landslide;
Frequency ratio;
Logistic regression
Deep learning;
1450.8022018Feature extraction;
GIS;
Convolutional neural networks
Fuzzy cognitive maps;
Cognitive map;
2400.7052015Fuzzy cognitive map;
Remote sensing;
Convolutional neural networks
Machine learning;
Neural networks;
3300.8052014Sub-pixel mapping;
Image classification;
Super-resolution mapping
Digital soil mapping;
Feature extraction;
4300.7452016Land use;
Random forests;
Land use and land cover
Table 6. The most active citer in Cluster #2.
#Number of CitationsCiting Article
1117Felix G, 2019, ARTIF INTELL REV, V52, P1707, DOI 10.1007/s10462-017-9575-1
2109Haeri SAS, 2019, J CLEAN PROD, V221, P768, DOI 10.1016/j.jclepro.2019.02.193
389Napoles G, 2016, INFORM SCIENCES, V349, P154, DOI 10.1016/j.ins.2016.02.040
470Chi Y, 2016, IEEE T FUZZY SYST, V24, P71, DOI 10.1109/TFUZZ.2015.2426314
569Wang Y, 2017, COGN NEURODYNAMICS, V11, P99, DOI 10.1007/s11571-016-9412-2
648Samarasinghe S, 2013, ENVIRON MODELL SOFTW, V39, P188, DOI 10.1016/j.envsoft.2012.06.008
728Summerfield C, 2020, PROG NEUROBIOL, V184, P, DOI 10.1016/j.pneurobio.2019.101717
827Napoles G, 2018, NEURAL NETWORKS, V97, P19, DOI 10.1016/j.neunet.2017.08.007
926Tang H, 2018, IEEE T COGN DEV SYST, V10, P751, DOI 10.1109/TCDS.2017.2776965
1021Gao R, 2020, ENG APPL ARTIF INTEL, V96, P, DOI 10.1016/j.engappai.2020.103978
1120Bakhtavar E, 2021, J CLEAN PROD, V283, P, DOI 10.1016/j.jclepro.2020.124562
1220Napoles G, 2017, INT J APPROX REASON, V85, P79, DOI 10.1016/j.ijar.2017.03.011
1320Froelich W, 2017, NEUROCOMPUTING, V232, P83, DOI 10.1016/j.neucom.2016.11.059
1419Yuan K, 2020, KNOWL-BASED SYST, V206, P, DOI 10.1016/j.knosys.2020.106359
1519Liu P, 2020, KNOWL-BASED SYST, V203, P, DOI 10.1016/j.knosys.2020.106081
Table 7. Top 30 authors with the highest number of publications.
CountCentralityYearCited Authors
3250.142018HE KM
2920.412013LEE S
2550.042017KRIZHEVSKY A
2530.022017LECUN Y
2520.042013PRADHAN B
2410.112014BREIMAN L
2400.12019RONNEBERGER O
2250.032017SIMONYAN K
2240.072013BUI DT
1880.092013POURGHASEMI HR
1840.052018KINGMA DP
1790.042018LONG J
1510.012018CHEN W
1390.122013FOODY GM
1290.062018ZHU XX
1280.022013KOHONEN T
1240.032019BADRINARAYANAN V
1230.022018REN SQ
1220.042019LI Y
1220.042019WANG Y
1190.022013GUZZETTI F
1100.062018CHENG G
1100.022018PHAM BT
1050.042013AYALEW L
1030.012019CHEN LC
1030.082019MA L
1030.052017HONG HY
970.022013YILMAZ I
960.022019LIU Y
940.022013AKGUN A
930.022020LIN TY
930.012019CHOLLET F
Table 8. Top 20 journals with the highest number of citations.
CountCentralityYearCited Journals
11090.222013REMOTE SENS-BASEL
9730.042013IEEE T GEOSCI REMOTE
9660.092013REMOTE SENS ENVIRON
9500.22013INT J REMOTE SENS
8480.182013ISPRS J PHOTOGRAMM
7940.082013LECT NOTES COMPUT SC
7860.112017PROC CVPR IEEE
6970.022013IEEE J-STARS
6380.082013IEEE T PATTERN ANAL
6170.022013IEEE GEOSCI REMOTE S
5540.022013INT J APPL EARTH OBS
5070.22013COMPUT GEOSCI-UK
4850.022013PHOTOGRAMM ENG REM S
4620.042013INT GEOSCI REMOTE SE
4580.132013NATURE
4530.072013GEOMORPHOLOGY
4450.022018IEEE I CONF COMP VIS
4330.032013SENSORS-BASEL
4100.082013ENVIRON EARTH SCI
4090.072013SCITOTAL ENVIRON
Table 9. Top 15 institutions.
CountYearInstitution
2042014Chinese Academy of Sciences
1162013Wuhan University
962013Helmholtz Association
892014University of Chinese Academy of Sciences
732013China University of Geosciences
422013Centre National de la Recherche Scientifique (CNRS)
392013University of Tehran
362013UDICE-French Research Universities
342015The Ministry of Natural Resources of the People’s Republic of China
332014Xidian University
332014Sun Yat Sen University
332013Korea Institute of Geoscience & Mineral Resources (KIGAM)
322013Universiti Putra Malaysia
322015University of Twente
322018Swiss Federal Institutes of Technology Domain
Table 10. Top 10 countries.
CountCentralityYearCountry
9920.142013PEOPLES R CHINA
4330.252013USA
1830.062013IRAN
1800.072013INDIA
1550.162013GERMANY
1380.052013SOUTH KOREA
1220.12013ENGLAND
1220.072013ITALY
1180.022013CANADA
980.072013AUSTRALIA
Disclaimer/Publisher’s Note: The statements, opinions and data contained in all publications are solely those of the individual author(s) and contributor(s) and not of MDPI and/or the editor(s). MDPI and/or the editor(s) disclaim responsibility for any injury to people or property resulting from any ideas, methods, instructions or products referred to in the content.

