Broadband Station Network ROA/UCM/GFZ in
South Spain and Northern Africa
E. Buforn, A. Udias
Departamento de Geofisica y Meteorologia, Universidad Complutense, Madrid
J. Martin D vila
Real Observatoriode la Armada, San Fernando, Spain
W. Hanka
GeoforschungZentrum,Potsdam, Germany
A. Pazos
Real Observatoriode la Armada, San Fernando, Spain
The seismotectonic importance of the Eurasian-African plate
boundary in the western part of the Mediterranean region
near the Iberian peninsula has motivated the installation of a
new network of broadband and seismographic stations in this
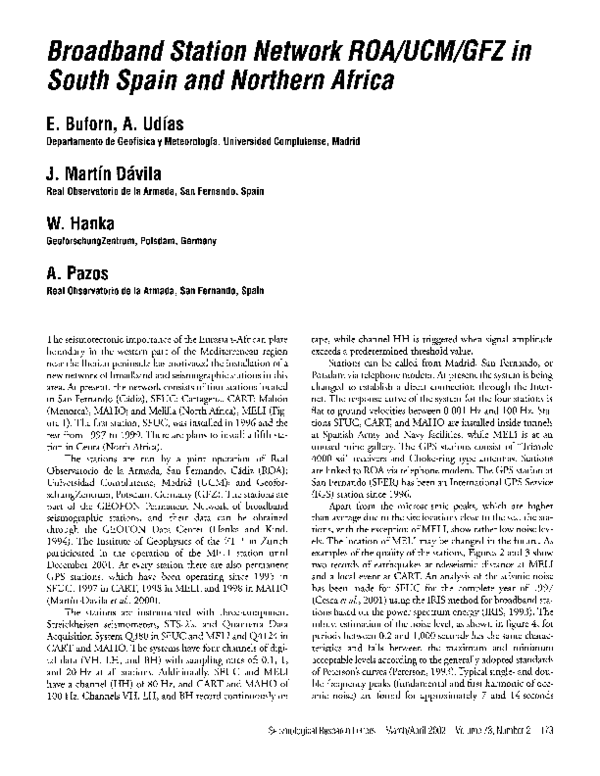
area. At present, the network consists of four stations located
in San Fernando (C~idiz), SFUC; Cartagena, CART; Mah6n
(Menorca), MAHO; and Melilla (North Africa), MELI (Figure 1). The first station, SFUC, was installed in 1996 and the
rest from 1997 to 1999. There are plans to install a fifth station in Ceuta (North Africa).
The stations are run by a joint operation of Real
Observatorio de la Armada, San Fernando, C~idiz (ROA),
Universidad Complutense, Madrid (UCM); and GeoforschungZentrum, Potsdam, Germany (GFZ). The stations are
part of the GEOFON Permanent Network of broadband
seismographic stations, and their data can be obtained
through the GEOFON Data Center (Hanka and Kind,
1994). The Institute of Geophysics of the ETH in Zurich
participated in the operation of the MELI station until
December 2001. At every station there are also permanent
GPS stations, which have been operating since 1995 in
SFUC, 1997 in CART, 1998 in MELI, and 1998 in MAHO
(Martfn-Davila et al., 2000).
The stations are instrumented with three-component
Streickheisen seismometers, STS-2's, and Quanterra Data
Acquisition System Q380 in SFUC and MELI and 0._4124 in
CART and MAHO. The systems have four channels of digital data (VH, LH, and BH) with sampling rates of: 0.1, 1,
and 20 Hz at all stations. Additionally, SFUC and MELI
have a channel (HH) of 80 Hz, and CART and MAHO of
100 Hz. Channels VH, LH, and BH record continuously on
tape, while channel H H is triggered when signal amplitude
exceeds a predetermined threshold value.
Stations can be called from Madrid, San Fernando, or
Potsdam via telephone modem. At present the system is being
changed to establish a direct connection through the Internet. The response curve of the system for the four stations is
flat to ground velocities between 0.001 Hz and 100 Hz. Stations SFUC, CART, and MAHO are installed inside tunnels
at Spanish Army and Navy facilities, while MELI is at an
unused mine gallery. The GPS stations consist of "Trimble
4000 ssi" receivers and Choke-ring type antennas. Stations
are linked to ROA via telephone modem. The GPS station at
San Fernando (SFER) has been an International GPS Service
(IGS) station since 1996.
Apart from the microseismic peaks, which are higher
than average due to the site locations close to the sea, the stations, with the exception of MELI, show rather low noise levels. The location of MELI may be changed in the future. As
examples of the quality of the stations, Figures 2 and 3 show
two records of earthquakes at teleseismic distance at MELI
and a local event at CART. An analysis of the seismic noise
has been made for SFUC for the complete year of 1997
(Cesca et al., 2001) using the IRIS method for broadband stations based on the power spectrum energy (IRIS, 1993). The
robust estimation of the noise level, as shown in figure 4, for
periods between 0.2 and 1,000 seconds has the same characteristics and falls between the maximum and minimum
acceptable levels according to the generally adopted standards
of Peterson's curves (Peterson, 1993). Typical single- and double-frequency peaks (fundamental and first harmonic of oceanic noise) are found for approximately 7 and 14 seconds
Seismological ResearchLetters March/April2002 Volume73, Number2 173
�_10 ~
_5 ~
0o
5~
45 ~
45 ~
SPAIN
40 ~
40 ~
MAHO
0
c
T
35 ~
35 ~
MOROCCO
_10 o
_5 ~
0o
5~
,A Figure 1. Location of the ROA/UCM/GFZ broadband stations. Circles represent installed stations and the triangle the planned station to be installed at
Ceuta.
EW, NS and Z components for MELI station 23//06/01; 20:44:44
'
1
-
•
I
I
•
_ ~ ,
,
,
i
I
,
,
,
,
'
I
'
'
'
'
I
'
'
'
i
~ ~ ~ ~ i
,
~ ~ ~ i
,
,
~1~
10
15
I
I
I
I
I
I
I
-
i
,
~ ,
~ i
,
,-
2--
0
O
-2
X
0
5
20
25
30
X 10+2
A Figure 2. Seismograms from the MELI station of the three components (EW, NS, Z) of the LH channel for the earthquake in Peru, 23 June 2001, M = 7.9,
epicentral distance 9,343 km. The horizontal scale is given in seconds and the vertical in counts (one count equals approximately a nanometer/second).
174
Seismological Research Letters
Volume73, Number2
March/April 2002
�EW, NS and Z components for CART station 22//04/01 . 17:29:48
~
o
"r,-r,
I
"W"~IllP
",:::t-
.-.to - 5
_
I
I
I
4
2
0
2
"~-4
(2)
"-
6
2
-''''1'''''''''''''''''''''t
0
~-2
o
X
10
20
30
40
50
60
~i, Figure 3. Seismograms from the CART station of the three components (EW, NS, Z) of the HH channel for the local earthquake in Alicante, Spain, 22 February 2000, M = 3.3, epicentral distance 51 km.
--80
I
- a _ l o o
I
I
....
I
I
I II
1
...................... , .
.
.
.
I
.
.
I
.
I
11
II
I
.
I
I
I
t
111
I
I
I
I
I
I II
I
I
I
I
Jllll
,. ..............................................................................................................................................
-r,r"
"'-,
~ 1.
+......", .....................................................
i..............................................
-/- .............i...............................
-,-.......................
~....................
i
~
,'"
"i',
-120 ............................................................
'..............
.,,'"
',
- 1 4 0 ...................................................................
..'.....................................
.-,
,.~[
....J..................................... ~........~...............................................................
i ............../ -
E
.................
/,,/,/
; - - 1 6 0 ......................................................................................................................
O
."
LU
or) _ 180
13_
m
Station S F U C
--
....................................................
0-24h
i
i
, ..
,,
!,-
.................................................... - ....................... -'.~...................................... ,............................................................ .j..f- ................................................................. ; ...................
L-_
111/97-31112/97
Robust Spectra
C o m p o n e n t noise
200
I
1 0-1
I
I
I
I
I I i I
10~
I
I
I
I
1 I I I
I
I
I
I
I
1 01
I I I
I
!
102
Period
I
I
I
I It
i
I
I
103
I
I
i
I I I
104
(s)
,& Figure 4. Power spectrum energy curves for the seismic noise at BB Station SFUC (Spain) during 1997. Continuous lines correspond to the three components (NS, EW, and Z)and dashed lines to Peterson's curves (Cesca, 2001).
Seismological Research Letters
March/April 2002
Volume73, Number2
175
�periods. The vertical component shows higher noise levels
than the horizontal for periods less than 2 seconds and lower
for larger periods. Higher estimations of noise levels for periods larger than 40 seconds are due to the lower amount of
data of the VH channel used in the analysis with respect to
BH and LH channels. A spike present at 0.4 seconds is due to
a local site effect. For periods above 0.6 seconds higher noise
levels are observed in fall and winter, and the lowest levels are
observed in summer. Daily analysis reveals maximum noise
levels during daytime hours from 6:00 AM to 6:00 I'M, and
minimum from midnight to 6:00 AM. The influence of oceanic storms and atmospheric pressure changes on daily and
seasonal variation of noise levels has been observed (Cesca et
al., 2001).
Continuous data for the channels VH, LH, and BH are
stored in the G E O F O N Data Center and may be obtained in
SEED format through its Web site (http:ffwww.gfz-potsdam.de/geofon/www_req/) or by "breq_fast" e-mail requests
(breq_fast@gfz-potsdam.de). Event data for earthquakes with
magnitudes larger than 5 are available with minimum delay
from SPYDER databases at G E O F O N and ORFEUS (http:/
/offeus.knmi.n[/) Data Centers in SAC format. For earthquakes of magnitudes less than 5, data may be obtained from
UCM or ROA in SAC format. A catalogue of wave forms for
local and regional earthquakes with magnitudes lower than 5
in the period 1997-2000 has been collected. The highest
number of local events is recorded at CART and the lowest at
MAHO. For more information you may contact E. Buforn
(figeoO7@sis.ucm.es) or J. Martfn D~ivila (mdavil.a@roa.es).
REFERENCES
Cesca, S., E. Buforn, and J. Martfn Dfivila (2001). Analysis of seismic
noise at SFC BB station (Spain), European Geophysical Society,
XXVI General Assembly, Nice, March 2001.
Hanka, W. and R. Kind (1994). The GEOFON Program, Annali di
Geofisica37, 1,060-1,065.
IRIS (1993). Federation of Digital SeismographNetworks Station Book,
IRIS, 203 pp.
Mart[n-D~ivila, J., J. Garate, A. Pazos, M. Catalan, A. Udfas, M. Berrocoso, W. Hanka, E. Buforn, P. Pdrez, J. Fermindez, J. Prian, J.
Quijano, J. A. Pefia, J. Gallego, and G. M. Delgado (2000). Geophysical/geodetical activities of the Royal Naval Observatory in
San Fernando (ROA) to study the Eurasia-Africa plate boundary
zone in the Ibero-Maghrebian region, The Tenth General Assembly of the WEGENER Project (WEGENER 2000) San Fernando
(Boletin ROA 3/2000), 72-75.
Peterson, J. (1993). Observation and Modeling of Seismic Background
Noise, USGS Open File report 93-322, 95 pp.
ACKNOWLEDGMENTS
This work is partially supported by Ministerio de Ciencia y
Tecnologfa, Project REN 2000-0777-C02.
176 SeismologicalResearchLetters Volume73,Number2 March/April2002
Departamento de Geoflsicay Meteorologla
Universidad Complutense
Madrid
Spain
figeo12@sis.ucm.es
(E.B., A. U.)
Real Observatorio de la Armada
San Fernando, Cddiz
Spain
(J.M.D.)
GeoforschungZentrum
Potsdam
Germany
~.H.)
Real Observatorio de la Armada
San Fernando, CAdiz
Spain
(A.P.)
�
 Agustin Udias