PLOS PATHOGENS
RESEARCH ARTICLE
Maintenance and dissemination of avianorigin influenza A virus within the northern
Atlantic Flyway of North America
Diann J. Prosser ID1*, Jiani Chen2, Christina A. Ahlstrom3, Andrew B. Reeves3,4, Rebecca
L. Poulson5, Jeffery D. Sullivan1, Daniel McAuley1, Carl R. Callahan6, Peter C. McGowan6,
Justin Bahl2, David E. Stallknecht5, Andrew M. Ramey3
a1111111111
a1111111111
a1111111111
a1111111111
a1111111111
1 U.S. Geological Survey, Eastern Ecological Science Center, Laurel, Maryland, United States of America,
2 Center for Ecology of Infectious Diseases, Department of Infectious Diseases, Department of Epidemiology
and Biostatistics, Institute of Bioinformatics, University of Georgia, Athens, Georgia, United States of
America, 3 U.S. Geological Survey, Alaska Science Center, Anchorage, Alaska, United States of America,
4 U.S. Geological Survey, National Wildlife Health Center, Madison, Wisconsin, United States of America,
5 Southeastern Cooperative Wildlife Disease Study, Department of Population Health, College of Veterinary
Medicine, University of Georgia, Athens, Georgia, United States of America, 6 U.S. Fish and Wildlife Service,
Chesapeake Bay Field Office, Annapolis, Maryland, United States of America
* dprosser@usgs.gov
OPEN ACCESS
Citation: Prosser DJ, Chen J, Ahlstrom CA, Reeves
AB, Poulson RL, Sullivan JD, et al. (2022)
Maintenance and dissemination of avian-origin
influenza A virus within the northern Atlantic Flyway
of North America. PLoS Pathog 18(6): e1010605.
https://doi.org/10.1371/journal.ppat.1010605
Editor: Ron A. M. Fouchier, Erasmus Medical
Center, NETHERLANDS
Received: January 16, 2022
Accepted: May 19, 2022
Published: June 6, 2022
Copyright: This is an open access article, free of all
copyright, and may be freely reproduced,
distributed, transmitted, modified, built upon, or
otherwise used by anyone for any lawful purpose.
The work is made available under the Creative
Commons CC0 public domain dedication.
Data Availability Statement: GenBank accession
numbers for genomic sequence data for isolates
generated and sequenced for this study are:
MT420910–MT421775 Data supporting all virus
isolation and seroprevalence results are available at
USGS ScienceBase Repository: https://doi.org/10.
5066/P9UF27FI.
Funding: This project was funded in part by the
United States Geological Survey’s Ecosystem
Mission Area (DJP, CAA, ABR, JDS, DM, AMR);
National Institutes of Health, National Institute of
Abstract
Wild waterbirds, the natural reservoirs for avian influenza viruses, undergo migratory movements each year, connecting breeding and wintering grounds within broad corridors known
as flyways. In a continental or global view, the study of virus movements within and across
flyways is important to understanding virus diversity, evolution, and movement. From 2015
to 2017, we sampled waterfowl from breeding (Maine) and wintering (Maryland) areas within
the Atlantic Flyway (AF) along the east coast of North America to investigate the spatio-temporal trends in persistence and spread of influenza A viruses (IAV). We isolated 109 IAVs
from 1,821 cloacal / oropharyngeal samples targeting mallards (Anas platyrhynchos) and
American black ducks (Anas rubripes), two species having ecological and conservation
importance in the flyway that are also host reservoirs of IAV. Isolates with >99% nucleotide
similarity at all gene segments were found between eight pairs of birds in the northern site
across years, indicating some degree of stability among genome constellations and the possibility of environmental persistence. No movement of whole genome constellations were
identified between the two parts of the flyway, however, virus gene flow between the northern and southern study locations was evident. Examination of banding records indicate
direct migratory waterfowl movements between the two locations within an annual season,
providing a mechanism for the inferred viral gene flow. Bayesian phylogenetic analyses provided evidence for virus dissemination from other North American wild birds to AF dabbling
ducks (Anatinae), shorebirds (Charidriformes), and poultry (Galliformes). Evidence was
found for virus dissemination from shorebirds to gulls (Laridae), and dabbling ducks to
shorebirds and poultry. The findings from this study contribute to the understanding of IAV
ecology in waterfowl within the AF.
PLOS Pathogens | https://doi.org/10.1371/journal.ppat.1010605 June 6, 2022
1 / 25
�PLOS PATHOGENS
Allergy and Infectious Diseases (NIAID) Centers of
Excellence for Influenza Research and Response
(CEIRR) under Contract No. 75N93021C00018
(JB) and Contract No. HHSN272201400006C
(RLP, DES). The funders had no role in study
design, data collection and analysis, decision to
publish, or preparation of the manuscript.
Competing interests: The authors have declared
that no competing interests exist.
Avian influenza in the Atlantic Flyway
Author summary
The recent first detection of highly pathogenic avian influenza (HPAI) virus in wild birds
inhabiting the Atlantic Flyway of North America (Newfoundland, Canada in November
2021 and South Carolina, USA, in January 2022) raises concern for virus movement
within this region. Here, we study IAV in wild waterfowl with focus on bird movements
in combination with IAV prevalence, seroprevalence, and genetic analyses for hypothesized virus flow and persistence. Migratory connectivity for two important dabbling duck
species within the AF was indicated by banding records from the North American Bird
Banding Program. A broad diversity of viral subtypes including H1, H3, H4, H6, H8–11,
N1–4, N6, N8–N9 was detected in these species. Prevalence of active infections was higher
on the breeding than wintering grounds, and common to other studies, the reverse was
seen for antibody prevalence. Genetic analysis indicated the possibility of virus persistence
from one year to the next in the northern latitudes on the breeding grounds, and although
no full genome movement was detected between the breeding and wintering sites, viral
gene flow was evident. The contribution of these findings in relation to bird movements
will help guide surveillance as HPAI is detected within the flyway.
Introduction
Wild waterfowl (Anatidae) are a primary natural reservoir for low pathogenic (LP) influenza A
viruses (IAV), serving an important role in viral persistence, amplification, and spread [1].
Most waterfowl species are highly mobile across the annual cycle, migrating hundreds to thousands of kilometers between breeding and wintering grounds [2]. These annual cycle movements can have important consequences for avian influenza virus spread and risk to
susceptible populations, be it other wildlife species [3,4] or economically important agriculture
systems such as poultry production [5–7].
Patterns of virus transmission depend on complex relationships between seasonal migrations, subsequent interactions among populations, and characteristics of host immunity and
susceptibility. For example, susceptibility differs across ages, with immunologically naïve juveniles having higher susceptibility than adults [8]. Viral dynamics vary across species, with even
closely related species expressing differences in susceptibility, asymptomatic periods, virus
shedding rates and duration, clinical signs, and mortality [9–11]. Additionally, virus subtype
diversity can change seasonally as birds migrate from breeding to wintering grounds, due to
changes in population immunity as the season progresses [12–15], and as populations mix at
stopover sites along migration [16] or on the wintering grounds [4,17,18]. The ability of viruses
to persist for weeks to months in moist or aquatic environments adds to the complexity of
virus exposure and movement by the migratory wild hosts [18–21]. Collectively, patterns of
higher prevalence have been detected on northern breeding grounds followed by a reduction
in prevalence and increase in virus diversity during the migration and wintering periods
[8,22,23] within the migratory corridors [24–26]. Thus, understanding the dynamics of avian
influenza across space and time for different species requires understanding the movements of
migratory birds, persistence of the virus in the environment, frequency of transmission across
species, and differences in prevalence or susceptibility.
A flyway perspective based on broad migratory corridors for avian species, particularly
waterfowl, has long been implemented for ecological study and management [27,28]. In the
context of IAV movement by wild waterfowl, surveillance plans [29,30] and research studies
PLOS Pathogens | https://doi.org/10.1371/journal.ppat.1010605 June 6, 2022
2 / 25
�PLOS PATHOGENS
Avian influenza in the Atlantic Flyway
[24,25,31] have considered a flyway perspective, with additional focus put on pathways
believed to have higher inter-continental wild bird connectivity. For example, research has
been dedicated to understanding transmission dynamics in the Pacific Flyway, the migratory
corridor that links western North America with eastern regions of Asia via breeding grounds
in Beringia [32,33], due in part to the concern that avian influenza viruses may be introduced
or passed between North America and Asia [34,35]. A key example of such an introduction
occurred in 2014 when Asian-origin highly pathogenic (HP) IAV H5N8 entered North America during the fall migration [36], reassorted, and spread throughout the Pacific and Central
Flyways of the U.S. where it was introduced to domestic poultry facilities and affected over 50
million poultry prior to suspected eradication in June 2015 [36]. Concern for HPAI entering
North America from Europe via the Atlantic Flyway has been raised with less attention [37],
however, recent detection of HPAI H5N1 in Newfoundland Canada [38,39] and subsequent
spread to all four North American flyways [40–42] has confirmed the ecological and economical relevance of this viral dissemination pathway.
Introduction of HPAI into the Atlantic Flyway is concerning given the importance of this
region to migratory waterfowl and domestic poultry production. Following breeding, waterfowl from the northern part of the flyway migrate to wintering grounds such as the Chesapeake
Bay [43,44], which is recognized as an important wintering and stopover habitat [45,46] for
several waterfowl species such as the mallard (Anas platyrhynchos) and American black duck
(Anas rubripes; hereafter black duck) [47,48]. The extensive poultry production that occurs on
the Delmarva Peninsula [49], which borders a large portion of the Chesapeake Bay, provides a
significant potential interface for viral transmission between wild and domestic bird populations. This combination of domestic poultry, concentrated waterfowl, and potential for introductions of novel influenza strains into these populations presents a need for improved
understanding of IAV ecology in the Atlantic Flyway.
The goal of this study was to increase our understanding of the spatiotemporal trends in
occurrence of avian influenza viruses within dabbling ducks of the Atlantic Flyway and how
these trends affect the persistence and spread of virus at multiple scales. To address this broad
goal, our objectives were to (1) explore the migratory connectivity of waterfowl between a
northern breeding site (Maine) and an important stopover and wintering habitat in the Atlantic Flyway (the Chesapeake Bay, Maryland), (2) identify trends in seroprevalence and viral
strains detected in birds from these locations, and (3) use genomic information for influenza
virus isolates to investigate (a) potential viral persistence within the region, (b) dispersal
between two locations, and (c) virus dissemination across a suite of hosts. Addressing these
questions will allow for an improved understanding of the ecology of avian influenza in this
important migratory flyway and across latitudinal gradients.
Results
Waterfowl sampling and bird banding connections
We collected and analyzed 1821 paired swab and 1031 serum samples in this study. While mallards and black ducks represented the majority of our analyzed swab (1646) and serum (969)
samples, other dabbling duck species (northern pintail, Anas acuta; green-winged teal, Anas
carolinensis; blue-winged teal, Spatula discors; gadwall, Mareca strepera; northern shoveler,
Spatula clypeata) were included opportunistically (S1 Table). We collected 155 swab samples
from hunter harvested birds, 46 of which were from either mallards or black ducks (S1 Table).
We collected a total of 762 and 904 swabs from live-captured birds in Maine and Maryland,
respectively, of which mallards and black ducks constituted 759 (99.6%) and 841 (93.0%) of
the swab samples analyzed. Similarly, while serum samples were collected from 253 and 791 of
PLOS Pathogens | https://doi.org/10.1371/journal.ppat.1010605 June 6, 2022
3 / 25
�PLOS PATHOGENS
Avian influenza in the Atlantic Flyway
the birds captured in Maine and Maryland, respectively, only 242 and 789 were included in
final analyses following removal of samples with insufficient volumes of serum. Of the mallard
and black duck serum samples included in final analyses, 242 were from Maine and 727 were
from Maryland.
Banding data from the U.S. Geological Survey Bird Banding Lab (hereafter BBL) database
included 21 mallards and black ducks that were banded in Maine and encountered in the
Maryland and Virginia portions of the Chesapeake Bay watershed within the same migratory
cycle. These observations were concentrated along the Eastern Shore of Maryland and
occurred across numerous years (Fig 1). Although the BBL database shows migratory connectivity between these sites, unsurprisingly, none of the birds sampled for IAV and marked in
this study were observed in both Maine and Maryland.
Virus prevalence and antibody seroprevalence
Detections of IAV via rRT-PCR varied across sampling locations and years (S2 Table). On average, inferred prevalence (matrix protein, M+) varied across species, however when controlling
for state and year, there were no species-level pairwise differences (p > 0.05). These findings may
have been driven by the limited sample size for species other than mallard and black duck.
Across the flyway, prevalence was higher in Maine where birds were sampled on the breeding
grounds, than in Maryland, where birds were sampled during fall migration and early winter
(p < 0.001; SE = 0.13; Table 1). An example of this trend is evidenced by data for year 2016 when
waterfowl sampled in Maine showed highest prevalence across sites and years (48% as inferred
using rRT-PCR, lowest prevalence across sites and years was 14%; p < 0.001; SE = 0. 13). Virus
isolation rates (VI/M+ ratios) were also higher in Maine than Maryland (p < 0.001; SE = 0.26).
While antibody seroprevalence also varied by sampling location and year (range 17 to 56%
and 32 to 75% using S/N thresholds of < 0.5, and 0.7, respectively; Table 1), these values had
opposite trends to those seen for active viral infection, with higher seroprevalence on the
Maryland wintering grounds than at the Maine breeding sites (Table 1; p < 0.001; SE = 0.09
and 0.15, S/N 0.5 and 0.7, respectively). Seroprevalence generally did not vary between species
(p > 0.05) with the only exceptions being that seroprevalence at the S/N < 0.7 threshold was
lower in northern pintail than both mallard (p = 0.005, SE = 0.29) and black duck (p = 0.020,
SE = 0.31). However, as with the lack of species-specific differences in prevalence, the limited
differences in seroprevalence may be driven by sample size. Raw data supporting all virus isolation and seroprevalence results are available at USGS ScienceBase Repository: https://doi.
org/10.5066/P9UF27FI.
RNA extraction and genetic sequencing
We successfully sequenced genomes of 109 influenza A virus isolates derived from paired cloacal and oropharyngeal swabs collected from dabbling ducks sampled in Maine and Maryland
during 2015 (n = 30), 2016 (n = 45), and 2017 (Maine only; n = 34). Viruses were of 16 combined HA and NA subtypes (Fig 2), the most common of which, H4N6, was detected in samples collected from both states and in every year. Viruses of the H3N2 and H3N8 subtypes
were also isolated from wild bird samples collected in Maine in all three sample years. We
identified a total of 16 mixed infections among the 109 isolates sequenced (14.7%), including
at least one mixed infection from each sample year.
Assessment of viral persistence and dispersal
In comparing genomic sequences obtained from wild bird samples collected in Maine and
Maryland during 2015–2017, we identified 87 pairwise comparisons of viruses from the same
PLOS Pathogens | https://doi.org/10.1371/journal.ppat.1010605 June 6, 2022
4 / 25
�PLOS PATHOGENS
Avian influenza in the Atlantic Flyway
Fig 1. Waterfowl migratory connectivity. Within-season migratory connections between sampling areas within the North Atlantic
migratory flyway (Maine, Maryland, respectively) shown as re-encounter locations for two primary waterfowl species: mallard and American
black duck. Data obtained for a 10-year period (2011 through 2021) from the North American Bird Banding Program. Red dots indicate
birds banded in Maine and re-encountered in the same migratory season (for example, potentially bred in Maine and wintered in
Maryland). The black line indicates the extent of the Chesapeake Bay watershed. Inset shows reencounter locations across the entire region
PLOS Pathogens | https://doi.org/10.1371/journal.ppat.1010605 June 6, 2022
5 / 25
�PLOS PATHOGENS
Avian influenza in the Atlantic Flyway
(Maine through North Carolina, USA) and main panel is zoomed to the wintering locations near the Chesapeake Bay. The base layer was
downloaded from the U.S. Census Bureau (https://www.census.gov/geographies/mapping-files/time-series/geo/carto-boundary-file.html)
and used as part of the public domain.
https://doi.org/10.1371/journal.ppat.1010605.g001
state and the same year (of 1043 possible comparisons) that shared > 99% nucleotide identity
at all eight gene segments (S1 File). We also identified two H3N8 isolates from Maine 2016
samples that shared >99% identity at all eight gene segments with four H3N8 isolates from
Maine 2017 samples (eight of 1868 pairwise comparisons). These included H3N8 viruses from
two mallards sampled in Maine in 2016 (A/mallard/Maine/UGAI16-5406/2016 (H3N8) and
A/mallard/Maine/UGAI16-5418/2016 (H3N8)) in comparison to four birds sampled in Maine
in 2017: three mallards and one black duck (A/mallard/Maine/ME-Y17-157/2017 (H3N8),
A/mallard/Maine/ME-Y17-165/2017 (H3N8), A/mallard/Maine/ME-Y17-166/2017 (H3N8),
A/American black duck/Maine/ME-Y17-170/2017 (H3N8)); S1 File). No isolates from Maine
and Maryland shared > 99% nucleotide identity at all eight gene segments, providing no evidence of direct dispersal of whole-genome viral constellations between these two ends of the
northern Atlantic Flyway. We did, however, identify many pairwise comparisons of virus
sequences from different years and different states that shared > 99% nucleotide identity at
one to seven gene segments, providing evidence of viral gene flow between locations (494 of
2240 pairwise comparisons; S1 File).
Assessment of viral dissemination among diverse avian hosts
Through our assessment of viral dissemination among wild and domestic bird hosts sampled
within the northern Atlantic Flyway and elsewhere in North America during 2015–2017, we
found numerous statistically supported trends. More specifically, we found decisive support
for viral dissemination from our other North American wild bird host group to northern
Atlantic Flyway dabbling ducks (all gene segments), shorebirds (all internal and NA gene segments), and poultry (PB2, PA, NP, M, and NS gene segments) (Fig 3). When considering viral
dissemination strictly within the northern Atlantic Flyway, we found decisive support for viral
dissemination from shorebirds to gulls for all internal gene segments and the H3 gene segment
(Fig 3). Also, within the northern Atlantic Flyway, we found very strong support (NP segment), strong support (PB2, PB1, NS segments), and support (PA, H5, N2 segments) for viral
dissemination of specific gene segments from dabbling ducks to shorebirds (Fig 3). Strong
support was found for viral dissemination of the PB1 gene segment from Atlantic Flyway
Table 1. Prevalence and seroprevalence of influenza A virus for wild dabbling ducks sampled in Maine and Maryland from 2015–2017. Prevalence identified using
rRT-PCR (M+, Ct values � 45) and virus isolation (VI). Seroprevalence (avian influenza antibodies) identified using bELISA with serum-to-negative control (S/N) ratios
<0.5 and 0.7. Dashes indicate no data was collected.
Prevalence (Ct < = 45)
State
n
M+
VI
M+ Prevalence
Seroprevalence
VI Prevalence
VI/M+
n
% Positive (S/N < 0.5)
% Positive (S/N < 0.7)
Maine
2015
220
44
16
20%
7%
36%
126
42%
69%
2016
266
128
30
48%
11%
23%
116
17%
32%
2017
276
75
34
27%
12%
46%
-
-
-
Total
762
247
80
32%
11%
33%
242
30%
51%
2015
578
82
14
14%
2%
17%
481
49%
73%
2016
481
74
15
15%
3%
21%
308
56%
75%
Total
1059
156
29
15%
3%
19%
789
52%
74%
Maryland
https://doi.org/10.1371/journal.ppat.1010605.t001
PLOS Pathogens | https://doi.org/10.1371/journal.ppat.1010605 June 6, 2022
6 / 25
�PLOS PATHOGENS
Avian influenza in the Atlantic Flyway
Fig 2. Influenza A virus subtypes detected in this study. Bar charts depicting combined subtypes of influenza A virus (IAV) isolates
recovered from samples collected at study sites in Maine (black bars) or Maryland (gray bars) in 2015 (Panel A), 2016 (Panel B), and 2017
(Panel C).
https://doi.org/10.1371/journal.ppat.1010605.g002
PLOS Pathogens | https://doi.org/10.1371/journal.ppat.1010605 June 6, 2022
7 / 25
�PLOS PATHOGENS
Avian influenza in the Atlantic Flyway
Fig 3. Virus dissemination of gene segments for host groups. Chord diagrams depicting Bayes factors (BF) for viral dissemination among northern Atlantic Flyway
dabbling duck (DD), northern Atlantic Flyway shorebird (SB), northern Atlantic Flyway gull (GU), northern Atlantic Flyway poultry (PO), and other North American
wild bird (OB) host groups. Inferred host and sink host groups are depicted above and below the horizontal dashed line, respectively. Chord width is proportional to the
median transition rate. Statistically supported Bayes Factor (BF > 3.0) are depicted with shaded arrows with the strength of statistical support increasing with intensity of
shading. Silhouettes were downloaded from PhyloPic (http://phylopic.org/) and used with permissions granted under Creative Commons Attribution 3.0 Unported
license (https://creativecommons.org/licenses/by/3.0/deed.en) or as part of the public domain with images attributed to Rebecca Groom and Sharon Wegner-Larsen.
https://doi.org/10.1371/journal.ppat.1010605.g003
dabbling ducks to poultry. We did not find BF support for dissemination of viral gene segments from gulls to any other host group within the northern Atlantic Flyway, nor from shorebirds to poultry. Topologies of phylogenies and the number of inferred Markov jumps among
host groups generally corroborated the same viral dissemination trends inferred from BF support (Fig 4 and S2 File). Similarly, we found higher estimates for transitions from the other
North American wild bird host group to northern Atlantic Flyway host groups as compared to
strictly among northern Atlantic Flyway host groups (Fig 4 and S2 File). We also found statistical support for migration rate differences between the other North American wild bird host
group and northern Atlantic Flyway host groups as compared to among northern Atlantic Flyway host groups (Fig 4 and S2 File).
In addressing sample sizes and bias, we report that the other North American wild bird
host group (OB) had the largest number of gene segments for analysis in comparison to the
remaining host groups (average 527 vs 65, 59, 6, and 5 segments for OB, DD, SB, GU, and PO,
respectively; Table A and Fig A in S3 File). To investigate the sensitivity of this sampling bias
on model results, we compared the phylogenetic model output (reconstruction of ancestral
states) for each gene segment to a random prior state (tip swap) output with the expectation
that if sample frequency was driving the analysis, the randomized ancestral root state
PLOS Pathogens | https://doi.org/10.1371/journal.ppat.1010605 June 6, 2022
8 / 25
�PLOS PATHOGENS
Avian influenza in the Atlantic Flyway
Fig 4. PB2 gene segment phylogenetic tree and Markov jumps. Bayesian phylogenetic tree (Panel A), heat map inferred number of Markov jumps among hosts groups
(Panel B), plot of estimates for transitions from the other North American wild bird host group to northern Atlantic Flyway host groups as compared to strictly among
northern Atlantic Flyway host groups (Panel C), and plot of ratios of posterior odds versus prior odds to infer differences in migration rate estimates between the other
North American wild bird host group and northern Atlantic Flyway host groups as compared to strictly among northern Atlantic Flyway host groups (Panel D) for the
PB2 gene segment. Comparable information for other 7 gene segments is provided in S2 File. Entire phylogenetic trees (e.g., Panel A) are provided in S4 File as PDFs and
S5 File as TreeTaxa plots. Abbreviations for hosts groups are as follows: DD = northern Atlantic Flyway dabbling duck, SB = northern Atlantic Flyway shorebird,
GU = northern Atlantic Flyway gull, PO = northern Atlantic Flyway poultry, and OB = other North American wild birds.
https://doi.org/10.1371/journal.ppat.1010605.g004
probabilities would match the model results. The ancestral state reconstruction was biased
toward the other North American wild bird host group, however, comparison of the model
output versus random tips for multiple gene segments showed differences, indicating that the
sampling bias had limited effects on our resultant models (Table B in S3 File).
Discussion
Our study contributes a unique look at wild waterfowl migratory connectivity paired with
genetic analyses to assess persistence and dissemination of influenza A viruses within the
Atlantic Flyway of North America. Although important for migratory waterfowl as well as
PLOS Pathogens | https://doi.org/10.1371/journal.ppat.1010605 June 6, 2022
9 / 25
�PLOS PATHOGENS
Avian influenza in the Atlantic Flyway
poultry production in the U.S., this flyway has been generally less sampled for wild bird-origin
IAV as compared to the Pacific Flyway despite evidence for virus exchange with Europe
through direct movements or shared breeding grounds in regions such as Greenland and Iceland [37,50–52]. Such virus exchange has proven ecologically and economically relevant as
exemplified by frequent HPAI H5N1 detections in North America beginning in late 2021
[39,41]. Although there have been studies that provide information on virus subtypes and
prevalence for waterfowl within the Atlantic Flyway [53–56], there are fewer studies that investigate viral genetic persistence or dispersal [57,58] which can help elucidate patterns in virus
transport to new areas via wild birds. One exception is a long-standing IAV surveillance effort
in the U.S. that focuses on shorebirds, mainly ruddy turnstones (Arenaria interpres), that
migrate thru Delaware Bay, coinciding with mass numbers of breeding horse-shoe crabs (Limulus polyphemus) [58–60]. These studies have generally provided limited evidence for IAV
exchange from shorebirds to poultry, and some transfer between shorebirds and dabbling
ducks [58]. Other studies that focused on dissemination of IAVs in the Atlantic Flyway have
investigated waterfowl, gulls, and murres inhabiting Newfoundland, a sampling location to the
north of our study sites [51,52,57,61].
We conducted our research to provide additional information on the role that dabbling ducks
may contribute to virus persistence and dispersal within the Northern Atlantic Flyway. We confirmed within-season migratory connectivity for two focal waterfowl species, the mallard and
American black duck, from northern breeding grounds in Maine to wintering and stopover locations in Maryland of the Chesapeake Bay. With samples obtained from these two regions, we
found evidence supportive of virus persistence at the northern sites, and virus flow from breeding
grounds to the more southern wintering and stopover sites of the Chesapeake Bay.
Despite banding data for waterfowl providing empirical evidence of migratory connectivity
between sampling sites in Maine and Maryland, we did not find evidence of whole genome
constellation dispersal of IAV by wild birds between these two states. These results are not
unusual when compared to other studies [58,62] and possible, non-mutually exclusive explanations for our findings include: (1) viral dispersal of genome constellations is relatively rare
and our sample was insufficient for detection of such an event, (2) Maine is likely one of multiple migratory connections (i.e. source populations of IAV) for the waterfowl sampled in Maryland, and (3) rapid accumulation of point mutations and widespread reassortment within the
wild bird reservoir leads to highly transient genome constellations of IAVs. These findings of
direct spatial migratory connectivity of avian hosts, lack of detection of nearly identical IAV
genomes at spatially distant locations within a flyway, and evidence for dispersal of viral gene
segments between northern and southern locations used by migratory birds are congruent
with what has been reported for shorebirds sampled within the same flyway [58] and waterfowl
sampled to the west in the Mississippi Flyway [62].
While waterfowl migratory connectivity within the flyway is to be expected [63] and aligns
with previously published work on this species group [44], verifying this site-specific connection within the migratory season is important for validating assumptions of viral spread within
a flyway. For instance, our finding that mallards and black ducks banded in Maine in the postbreeding season make use of the stopover or wintering habitat provided by the Chesapeake
Bay within a single migratory cycle indicates that these birds could spread viruses acquired on
the breeding grounds to the southern wintering grounds or migratory stopover locations.
While the transmission of avian influenza viruses latitudinally within a flyway is important in
the annual cycle [24,25], it can also have meaningful implications at the local level, as seasonal
introduction of avian influenza viruses provides the opportunity for transmission to domestic
poultry facilities that are common in this region [49]. Additionally, the congregation of waterfowl from numerous breeding grounds at this single stopover / wintering site allows for the
PLOS Pathogens | https://doi.org/10.1371/journal.ppat.1010605 June 6, 2022
10 / 25
�PLOS PATHOGENS
Avian influenza in the Atlantic Flyway
potential spread of different viral strains across distinct breeding populations [16], both of
which are important to informing IAV surveillance strategies.
Through the pairwise comparison of genome constellations of isolates recovered from dabbling ducks sampled within the northern Atlantic Flyway, we identified evidence suggestive of
environmental persistence of IAVs at the northern end of the flyway. Although reports of such
evidence are uncommon, two previous studies have identified highly similar IAV genome constellations between years in wild birds inhabiting Alaska [18,64]. Both laboratory and fieldbased evaluations provide evidence that IAVs may remain infectious in cold surface water for
extended periods and potentially even overwinter when maintained at ambient environmental
temperatures [20,65–67], particularly at mid to high latitudes. Therefore, additional efforts to
explore whether and how the environmental persistence of IAVs may affect viral ecology
within the northern Atlantic Flyway is warranted.
Our finding of statistically supported trends of viral dissemination among discrete host
groups (dabbling ducks, gulls, shorebirds, poultry, and other North American wild birds) provides important insights that may be useful to ongoing and future IAV surveillance efforts
within North America. For example, decisive support for viral dissemination from our other
North American wild bird host group to northern Atlantic Flyway dabbling ducks, shorebirds,
and poultry, elucidates the interconnected nature of the avian reservoir within which IAVs are
maintained in North America. Also, within the northern Atlantic Flyway, we found support
for dissemination of specific gene segments from dabbling ducks to shorebirds and poultry.
Another study conducted using samples collected north of our study sites, in the Canadian
portion of the Atlantic Flyway, also found evidence for frequent interspecies viral dissemination from dabbling ducks to shorebirds and poultry [57]. Virus detections and inferred patterns of dissemination among host groups may be influenced by numerous factors including
geographic distribution of sampling, sampling efforts, availability of complementary reference
data (i.e., virus sequences) available in public databases, ecological factors related to bird movements and connectivity on the landscape [18,68], and host immunity at the time of sampling
[69–71]. Taking into account these complexities, continued surveillance across these groups is
important to understanding virus movement within and across wild populations as well as at
the interface between wild birds and poultry.
Our finding of decisive support for viral dissemination from northern Atlantic Flyway
shorebirds to gulls provides evidence to further support that spillover of IAVs isolated from
ruddy turnstones, a common viral host in the eastern United States and throughout the Neotropics [58,72–75], contributes to the annual epidemic historically observed each spring at Delaware Bay [76], which is located just north of the Chesapeake Bay. In turn, the lack of
statistical support for viral dissemination from either shorebirds or gulls to Atlantic Flyway
poultry over the course of our study suggests this annual epidemic may not lead to frequent
detections of viral spillover in local domestic birds. It should be noted, however, that two prior
reports have indicated that H7N3 viruses isolated from ruddy turnstones from Delaware Bay
shared common ancestry with viruses affecting poultry in the Canadian provinces of British
Columbia in 2004 [77] and Saskatchewan in 2007 [78]. Additional surveillance may help elucidate whether these connections reflect virus movements between these populations or are due
to lack of sequences from intermediate hosts.
As noted previously, availability of sequences for genetic analyses in public databases may
be biased spatially, temporally, and taxonomically. We recognize these biases within our analyses, with the other North American Wild Bird host group (OB) having a disproportionately
large number of samples compared to the defined Atlantic Flyway host groups (Table A and
Fig A in S3 File). A common approach to addressing sampling frequency bias is to down sample, or reduce the number of inputs within the larger groups, which is often done with very
PLOS Pathogens | https://doi.org/10.1371/journal.ppat.1010605 June 6, 2022
11 / 25
�PLOS PATHOGENS
Avian influenza in the Atlantic Flyway
large datasets [25,79]. We chose not to subsample as our dataset contained limited information
for various host groups and spanned only three years. Thus, we were concerned that down
sampling would introduce other biases and/or preclude statistical rigor for deriving inference.
Therefore, we instead opted to investigate the potential effects of biases in our analyses. When
we compared our main model outputs with a random tip swap analysis, the sensitivity analysis
provided evidence that inferred trends in viral dissemination were driving the ancestral reconstruction and that sampling frequency of host groups had only limited impacts on the model
results. As such, while we acknowledge that our input data has inherent sampling biases, we
also believe that our results provide useful inference on general trends of viral dissemination
within the Atlantic Flyway.
Understanding the diversity of viruses circulating among populations is important for identifying potential risks to domestic and wild bird health. A broad diversity of IAVs was detected
in this study, with surface proteins including hemagglutinin H1–4, H6, H7–11 and neuraminidase N1–4, N6, and N9. The findings of H4N6 as subtype IAVs in ducks sampled in Maine
and Maryland in each year is consistent with reports of IAVs of this subtype as being common
within dabbling ducks sampled at both northern and more southern areas of North America
[15,17,80–84]. Additionally, the isolation of H3N8 and H3N2 IAVs in ducks sampled in
Maine and H1N1 IAVs in birds sampled in Maryland in each sampling year is congruent with
previous contemporary detections of viruses of these subtypes in dabbling ducks sampled elsewhere in northern North America and at lower latitudes within the United States, respectively
[17,81–83].
Similar to studies conducted in other flyways [8,22,23], we observed evidence for higher
prevalence of IAVs among wild birds sampled in the northern sites in Maine than in Maryland, and the contrary relationship when considering antibody seroprevalence suggesting that
the majority of infections occur when immunologically naïve juveniles enter the population
(i.e., prior to beginning fall migration) and decrease as the population builds immunity prior
to arrival at sites along migration such as the Chesapeake Bay. Prevalence estimates detected in
this study (32% and 15% M+ in Maine and Maryland, respectively) fall in similar range to
those reported in previous works in the Atlantic Flyway when accounting for species and latitude. Groepper et al. [85], reported a range of prevalence from 15.1 to 21.2% in the Atlantic
Flyway from 2007–2009, similar to our Maryland samples, which are located mid-latitude
across the larger flyway. A 2017 study within the Delmarva Peninsula reported average prevalence of 14% across all dabbling ducks, with species values of 28% for black ducks and 10% for
mallards [53]. One study which reported a lower prevalence of 3.1 and 1.5% for black ducks
and mallards, respectively, [55] sampled over a wider time span within the annual cycle (September through March as opposed to September thru December for the other two studies)
with half the samples collected in March, and showed reduced prevalence as the post-breeding
season progressed.
Conclusions
This study provides a unique assessment of linkages between bird movements and IAV dissemination patterns with a flyway perspective and has important global implications given
connectivity between the northern Atlantic Flyway and eastern Canada, other parts of the
U.S., Central and South America, as well as across the Atlantic Ocean to Europe via Greenland
and Iceland. Congruent with previous broad-scale studies, prevalence of IAVs was inferred to
be higher in the breeding season’s northern latitudes and seroprevalence and mixed infections
were higher southward in the flyway where waterfowl stop over during migration and intermix
throughout the wintering season with birds that had bred elsewhere. Evidence for potential
PLOS Pathogens | https://doi.org/10.1371/journal.ppat.1010605 June 6, 2022
12 / 25
�PLOS PATHOGENS
Avian influenza in the Atlantic Flyway
environmental persistence of virus was observed at the northern latitudes within the flyway,
and signs of viral gene flow was evident between sampling areas sharing migratory connectivity. Several patterns of viral dissemination were supported across host groups within the northern half of the flyway (Maine to the Chesapeake Bay, Maryland) including gene flow from
dabbling ducks to shorebirds and poultry, which have implications to understanding virus
movement across wild populations as well as into the domestic poultry system. Additional
efforts to evaluate avian influenza prevalence and persistence across other times of the year,
such as from winter through spring migration would be valuable next steps. This work provides an important contribution to understanding IAV in waterfowl in the northern portion
of the Atlantic Flyway and builds grounds for development of future work in this region, particularly as HPAI has now been detected in wild birds within the Atlantic Flyway and has subsequently spread to other flyways within North America.
Materials and methods
Ethics statement
All handling of birds was performed by trained personnel. The study was approved by the
USGS Eastern Ecological Center Animal Care and Use Committee (2014-02P). Live-captured
waterfowl were banded and sampled under banding permit 23913 from the U.S. National Bird
Banding Laboratory.
Waterfowl band recovery (migratory connectivity)
To assess migratory connectivity along the Northern Atlantic Flyway (Maine to Chesapeake
Bay, Maryland, which includes the following contiguous states within U.S.: Connecticut, Delaware, Maine, Maryland, Massachusetts, New Hampshire, New Jersey, New York, Pennsylvania, Rhode Island, Vermont, Virginia, West Virginia) we requested all mallard and black duck
encounter (reported by the general public, primarily hunter harvest data) and recapture
(reported by licensed banders primarily from targeted capture for banding) data from the
North American Bird Banding Program via the BBL. These species were selected for their
importance to waterfowl populations in the Atlantic Flyway, their importance as wild reservoirs for avian influenza viruses [86,87], and their suspected high connectivity between Maine
and the Chesapeake Bay [88]. The acquired data were filtered to include only birds banded in
Maine over the past decade (2011–2021) and encountered or recaptured within the same
migratory cycle in which they were initially banded (e.g., banded on breeding grounds in
Maine and encountered in the fall or winter which spans until February of the following calendar year). We manually summed the number of birds encountered or recaptured within the
Maryland and Virginia portions of the Chesapeake Bay Watershed following the processing
steps described above. Migratory connections were visualized in ArcMap 10.4 [89].
Field sampling
We sampled both hunter harvested and live captured dabbling ducks from August to December of 2015, 2016, and 2017. Hunter-harvested birds were collected opportunistically from
bird processing facilities across the Eastern Shore of Maryland (a portion of the Chesapeake
Bay watershed known for abundant waterfowl) where hunters bring harvested birds for cleaning. One cloacal and one oropharyngeal swab [90] were collected from each bird using sterile
polyester-tipped applicators and placed as paired samples (by bird) in vials containing 2 mL of
cold virus transport medium (VTM) supplemented with antimicrobials including 2 ml of
Brain Heart Infusion media (Becton Dickinson and Co., Sparks, MD) supplemented with
PLOS Pathogens | https://doi.org/10.1371/journal.ppat.1010605 June 6, 2022
13 / 25
�PLOS PATHOGENS
Avian influenza in the Atlantic Flyway
penicillin G (1,000 units/ml), streptomycin (1 mg/ml), kanamycin (0.5 mg/ml), gentamicin
(0.25 mg/ml), and amphotericin B (0.025 mg/ml) (Sigma Chemical Company, St. Louis, MO).
Swabs were stored on ice for <12 hours during sample collection and transport to a holding
facility where they were then stored at -80˚C until being shipped on dry ice to the laboratory
where they were held at -80˚C until processing. Live captured birds, caught via swim-in traps
baited with corn, were sampled in Maine at Christina Reservoir (46.693, -76.891) and Lake
Josephine (46.673, -67.904) and surrounding wetlands, at Moosehorn National Wildlife Refuge
(45.056, -67.297), and in the Maryland portion of the Chesapeake Bay at Poplar Island; 38.762,
-76.383). Capture efforts targeted mallards and black ducks, although other dabbling duck species were sampled opportunistically. Upon capture, birds were placed in large holding containers and stored out of direct sunlight until they could be individually processed and released at
the capture location. Each bird was marked with a metal U.S. Geological Survey leg band. All
live-captured birds were swabbed as described above for hunter harvested birds. Additionally,
up to 3 mL of blood was taken from the jugular or leg vein of live-captured birds and placed in
a BD Vacutainer SST tube (BD, Franklin Lakes, New Jersey, USA) where it was inverted 3–5
times to aid homogenization and placed on ice. Upon return to the lab, blood samples were
spun in a centrifuge for 20 minutes at 2500 rpm to separate serum and red blood cells. Serum
samples were then poured into individual vials and stored at -80˚C until shipped on dry ice for
further processing. All capture, handling, and marking procedures were conducted in accordance with the methodology outlined by the Food and Agriculture Organization of the United
Nations [91].
Antibody testing
We tested serum samples by commercial blocking enzyme-linked immunosorbent assay
(bELISA, IDEXX Laboratories, Westbrook, ME) for influenza A virus antibodies as described
by the manufacturer. An initial serum-to-negative control (S/N) absorbance ratio < 0.5 represents the cutoff threshold recommended by the manufacturer; however, this threshold is most
sensitive to high antibody titers that occur with primary immune response from recent infections. Multiple studies show that S/N cutoff threshold of < 0.7 increases sensitivity while preserving specificity in wild waterfowl that may have been exposed weeks to months prior to
sampling [92–94]. For this reason, and to allow for comparison across studies in the literature,
we provide classifications using both thresholds. We used a generalized linear model with a
logit link (~ Year + Flyway Location + Species) to assess trends in seroprevalence between the
areas sampled in this study, with post-hoc pairwise comparisons of species performed via the
“emmeans” function in R [89,95]. This model was run for seroprevalence at both the S/
N < 0.5 and 0.7 thresholds.
Influenza A virus screening
We extracted viral RNA from all swab samples using the MagMAX-96 AI/ND Viral RNA
Isolation Kit (Ambion/Applied Biosystems, Foster City, CA) and screened using real-time
reverse transcriptase-PCR (rRT-PCR) that targeted the IAV matrix (M) gene [96]. Any sample that did not yield a cycle threshold (Ct) value �45 was considered negative for IAV [96].
We attempted virus isolation on all M positive (M+) samples by inoculating a total 1mL of
VTM into the allantoic cavities of three 9-11-day-old embryonated chicken eggs [97] and
incubating at 37˚C for 120 hours. Amnioallantoic fluid was collected and tested by hemagglutination assay [98]. We extracted viral RNA from all hemagglutinating samples using the
QIAamp Viral RNA mini kit (Qiagen, Inc., Germantown, MD) and IAV were identified by
RT-PCR targeting the M gene [96,99]. We used generalized linear models (~ Year + Flyway
PLOS Pathogens | https://doi.org/10.1371/journal.ppat.1010605 June 6, 2022
14 / 25
�PLOS PATHOGENS
Avian influenza in the Atlantic Flyway
Location + Species) to assess trends in both influenza A virus prevalence (matrix gene, M+)
and virus isolation ratios (VI/M+) between the areas sampled in this study, with post-hoc
pairwise comparisons of species performed via the “emmeans” function in R [89,95].
RNA extraction and genetic sequencing
RNA was extracted from amnioallantoic egg fluids for all putative virus isolation-positive samples using the QIAamp viral RNA mini kit (Qiagen Inc.; Germantown, MD, USA). Complementary DNA was synthesized and subsequently amplified, visualized, and purified per
previously reported methods [81]. Genomic sequences for IAVs were obtained by using Nextera XT DNA library preparation kits (Illumina, Inc.; San Diego, CA, USA), pooling indexed
libraries, and sequencing on an Illumina MiSeq using either 500 or 600-cycle reagent kits with
paired-end reads. Reads were assembled using a customized workflow on Geneious R11.0.4
(Biomatters Ltd.; Auckland, New Zealand) using reference data for influenza A viruses
obtained from GenBank [100]. GenBank accession numbers for genomic sequence data for
isolates generated and sequenced for this study are: MT 420910–MT421775.
Assessment of viral environmental persistence and viral dispersal
To assess (a) genetic evidence for possible environmental persistence of IAVs at study sites in
Maine or Maryland or (b) viral dispersal between sites, we calculated shared pairwise nucleotide identity (a measure of genetic similarity) among viral genomes isolated from wild bird
samples collected from Maine and Maryland during 2015–2017. More specifically, we calculated nucleotide identity of each of eight gene segments among all complete, non-mixed infection genomes sequenced as part of this study (n = 93), as well as full non-mixed infection
genomes for reference IAVs from wild birds reported on GenBank (accessed 2 June 2020)
from Maine during 2015–2017 and Maryland during 2015–2016 (n = 9).
Regarding viral persistence, we considered isolates identified from the same state but different years that shared > 99% nucleotide identity at all eight gene segments to be suggestive of
persistence between years. If less than eight gene segments shared >99% nucleotide identity,
we did not consider isolates to be indicative of persistence; rather, we interpreted such findings
as suggestive of genetic shift and/or genetic drift of genome constellations within wild bird reservoir hosts. We considered a lack of gene segments sharing > 99% nucleotide identity among
isolates derived from samples from the same state but different years to be suggestive of the
extirpation of viral genome constellations between years.
Regarding viral dispersal, isolates from birds sampled in different states that shared >99%
nucleotide identity at all eight gene segments were considered to be indicative of viral dispersal
between sites. If at least one but less than eight gene segments shared >99% identity, we considered this to be indicative of viral gene flow between sites in conjunction with genetic shift
and/or drift of genome constellations maintained by wild bird reservoir hosts. If no gene segments shared > 99% identity we considered this to be suggestive of infrequent or no viral gene
flow among populations of birds sampled in Maine and Maryland.
We expected some isolates recovered from samples collected in the same state and the same
year to share > 99% nucleotide identity at all eight gene segments on account of local viral
transmission within the wild bird reservoir. Thus, we did not test any hypotheses using such
comparisons, though they were identified and counted.
Assessment of viral dissemination among diverse avian hosts
To assess support for viral dissemination among wild and domestic bird hosts sampled within
the northern Atlantic Flyway and wild birds sampled concurrently elsewhere in North
PLOS Pathogens | https://doi.org/10.1371/journal.ppat.1010605 June 6, 2022
15 / 25
�PLOS PATHOGENS
Avian influenza in the Atlantic Flyway
America during 2015–2017, we conducted comparative phylogenetic analyses using discrete
host groups. To do so, we first generated an input file for each IAV internal gene segment
(PB2, PB1, PA, NP, M, and NS) as well as for the hemagglutinin H1, H3, and H5 and neuraminidase N1, N2, and N8 gene segments. Each input file was populated with complete coding
sequences for gene segments of isolates generated in this study and reference complete coding
sequences for gene segments of avian-origin IAVs from samples collected elsewhere from
North America during 2015–2017 as reported on GenBank (accessed 26 June 2020). Each
sequence was assigned one of the following five discrete host groups: northern Atlantic Flyway
dabbling duck (DD), northern Atlantic Flyway shorebird (SB), northern Atlantic Flyway gull
(GU), northern Atlantic Flyway poultry (PO), or other North American wild bird (OB). For
identical sequences, we included data for only a single representative virus for each host group.
We also removed sequences from the other North American wild bird host groups that clearly
represented domestic bird origin sequences and those for which wild status could not be
inferred (i.e., duck, chicken, turkey, goose, Muscovy, Guinea fowl, peafowl, spot-billed duck,
pheasant, and quail). Sequence information from the few IAV sequences originating from the
southern Atlantic Flyway (n = 10; from North Carolina, South Carolina, and Florida) and
from hosts other than dabbling ducks, shorebirds, gulls, and poultry from the northern Atlantic Flyway (n = 5; from geese and sea ducks) were included in our “other” North American
wild bird host group. Resultant input files contained at least 127 (HA H1gene segment) and up
to 1306 (PA gene segment) sequences per gene segment, with largest samples sizes for internal
gene segments (n � 1012).
A preliminary maximum likelihood phylogenetic tree was next generated for each gene segment using RAxML v8.2.12 [101] to identify the phylogenetic outlier sequences which were
subsequently removed from the dataset to facilitate downstream model convergence. Trees
were generated using a general time reversible nucleotide substitution model with gamma distribution of rates. The clock signal was investigated for each maximum likelihood phylogenetic
tree using Tempest v1.5 [102]. Viral sequences with clock rates substantially lower or higher
than the mean rate (lower 2.5 percentile) were classified as outliers.
We next conducted comparative Bayesian phylogenetic analyses for each gene segment
using BEAST v.1.10.4 [103] incorporating an uncorrelated lognormal relaxed molecular clock
that allows for rate variation across lineages. The SRD06 codon position model [104] was used
along with a constant coalescent tree prior [105]. A minimum of four independent runs of 150
million generations were performed and combined after removal of burn-in to achieve an
Effective Sample Size of >200 as diagnosed in Tracer v1.6 [106]. Empirical tree sets were constructed by combining the last 1000 trees of each run for subsequent discrete traits analysis.
We next applied discrete trait diffusion models to estimate the rate of transitions among the
five host groups described above: DD, SB, GU, PO, OB (the first four being northern Atlantic
Flyway dabbling ducks, shorebirds, gulls, and poultry and the 5th being other birds). We used a
non-reversible continuous-time Markov chain model to estimate the migration rates between
different host groups. We performed Bayesian stochastic search variable selection (BSSVS) to
reduce the complexity of the models and to identify significantly non-zero migration rates
using a binary indicator (I). Based on I, Bayes factors (BF) were calculated using SPREAD v1.0
[107]. Rates were considered statistically supported using BF as follows: weak/poor support
when BF < 3, support when 3 � BF < 10, strong support when 10 � BF < 100, very strong
support when 100 � BF < 1000, decisive support when BF � 1000.
Additionally, we assessed statistical support for differences of migration rate between
northern Atlantic Flyway host groups and the other North American wild bird hosts by computing and comparing BF. We estimated the BF for differences in migration rates (r) by the
ratio of posterior odds (P(r1 > r2 | Data)/P(r2 > r1 | Data)) versus prior odds P(r1 > r2)/P
PLOS Pathogens | https://doi.org/10.1371/journal.ppat.1010605 June 6, 2022
16 / 25
�PLOS PATHOGENS
Avian influenza in the Atlantic Flyway
(r2 > r1), where the prior odds ratio was approximately set to 1 [108]. To assess the contribution of each host group as a viral source or sink in the migration network, state jumps at the
tree nodes, representing an inferred state transition event, were recorded. We used a nonreversible model and therefore the direction of gene flow between states was used to assign
hosts groups as either source or sink for each transition. We generated heat maps to represent
the average number of jumps per year estimated from the last 3000 posterior sampled trees.
Only the Markov jumps between 2015 and 2017 were analyzed to be consistent with the sampling period for sites in Maine and Maryland and the year of sampling for viral sequences
obtained from GenBank. Markov jumps were extracted from the complete jump history using
a custom R script [109] to visualize heat maps.
No down sampling was applied to genetic segments for the Bayesian phylogenetic analyses
as the overall sample size was manageable (segments were obtained across only 3 years of data)
and we aimed to preserve the genetic diversity within each discrete host category. To assess
potential sampling frequency bias across host states on the model results, we performed a sensitivity analysis comparing observed models versus randomized apriori models. More specifically, we compared the probability of the estimated ancestral root state from each model
(model output) with the probability of an ancestral root state obtained when the discrete host
groups were randomized at the model tips (“tip swap”) during the Markov process both with
and without BSSVS analysis [110,111]. With this process, we expected that differing relative
proportions per host group in the randomized tip swap would reflect differences in sample
size. Then, if the probabilities in the model output were to match these patterns, we would
assume that sampling bias may have influenced the model output; however, if proportions of
the host tip assignments were dissimilar between the model output and randomized analyses,
there is indication that trends in viral dissemination, not strictly sampling bias were driving
the output. Further detail on this process is described in S3 File).
Supporting information
S1 Table. Swab and serum samples per site, capture type, and species. The number of paired
cloacal and oropharyngeal swabs and blood serum samples collected (C) from dabbling duck
species and analyzed (A) to test for influenza A virus in Maine (ME) and Maryland (MD) by
year, species, and capture method from 2015–2017. Live-captured birds (LC), caught via
swim-in traps baited with corn, were sampled in both Maine and Maryland, while hunter harvested birds (HH) were sampled only in Maryland. Waterfowl species are identified via their
alpha codes as follows: ABDU (American Black Duck), ABDU x MALL (American Black
Duck x Mallard Hybrid), AGWT (American Green-winged Teal), BWTE (Blue-winged Teal),
GADW (Gadwall), MALL (Mallard), NOPI (Northern Pintail), and NOSH (Northern Shoveler).
(DOCX)
S2 Table. Influenza A virus prevalence, serology, and subtyping from dabbling duck samples. The prevalence of influenza A virus as identified via rRT-PCR and virus isolation (VI),
avian influenza antibodies as identified via bELISA, and the genetic sequencing results for wild
dabbling ducks sampled in Maine (ME) and Maryland (MD) from 2015–2017. Waterfowl species are identified via their alpha codes as follows: ABDU (American Black Duck), ABDU x
MALL (American Black Duck x Mallard Hybrid), AGWT (American Green-winged Teal),
BWTE (Blue-winged Teal), GADW (Gadwall), MALL (Mallard), NOPI (Northern Pintail),
and NOSH (Northern Shoveler).
(DOCX)
PLOS Pathogens | https://doi.org/10.1371/journal.ppat.1010605 June 6, 2022
17 / 25
�PLOS PATHOGENS
Avian influenza in the Atlantic Flyway
S1 File. The percentage similarity between avian influenza virus isolates at each of eight
gene segments. Tab 1: The number of gene segments that are >99% similar between two influenza A virus isolates. Tabs 2 through 9: Percent similarity between gene segments for PB2,
PB1, PA, HA, NP, NA, M, and NS gene segments.
(XLSX)
S2 File. Phylogenetic trees and Markov jumps for all gene segments of isolated influenza A
viruses. Bayesian phylogenetic tree (Panel A), heat map inferred number of Markov jumps
among hosts groups (Panel B), plot of estimates for transitions from the other North American
wild bird host group to northern Atlantic Flyway host groups as compared to strictly among
northern Atlantic Flyway host groups (Panel C), and plot of ratios of posterior odds versus
prior odds to infer differences in migration rate estimates between the other North American
wild bird host group and northern Atlantic Flyway host groups as compared to strictly among
northern Atlantic Flyway host groups (Panel D) for the PB1, PA, NP, M, and NS internal gene
segments as well as hemagglutinin H3, and H5 and neuraminidase N2, and N8 gene segments.
Note that for gene segments hemagglutinin H1 and neuraminidase N1, support for transmission within the Atlantic Flyway hosts was not determined (BF less than 3) and hence, panels C
and D are not included.
(PDF)
S3 File. Model sensitivity to sampling bias. This file lists the number of sequences per discrete host group and describes the sampling bias sensitivity analysis applied to explore whether
the uneven sample sizes among host groups (particularly Other Birds; OB) greatly affected the
phylogenetic analysis model results. Table A: List of segments for phylogenetic analysis per discrete host group. Table B: Tip-state randomization to examine ancestral root state probabilities. Fig A: Bar graph showing number of segments for phylogenetic analysis per discrete host
group.
(DOCX)
S4 File. Printed phylogenetic trees with tip labels and host group information. This file
contains phylogenetic trees printed and attached in a PDF format for those who do not have
FigTree or other software to view the treeplots.
(PDF)
S5 File. Treeplot format phylogenetic trees with tip labels and host group information.
This file contains Treeplot format phylogenetic trees which can be visualized and manipulated
using FigTree software available at: evomics.org.
(EXE)
Acknowledgments
The authors thank Serguei Drovetski (USGS) and Claire Teitelbaum (USGS) for providing
helpful comments to strengthen earlier versions of this manuscript. We would like to thank
the U.S. Army Corp of Engineers, U.S. Fish and Wildlife Service, Brad Allen, Kelsey Sullivan,
and technicians from Maine Department of Inland Fisheries and Wildlife, and Raymond
Brown from the Moosehorn National Wildlife Refuge for providing site access and logistical
support during this effort. We wish to acknowledge Larry Hindman, Josh Homyack, and
Hutch Walbridge (Maryland Department of Natural Resources) for their assistance in the collection of hunter-harvested birds as well as Emmett and Carl Dunnock (Duck Stop Butcher
Shop) for allowing use of their facilities. We thank Deborah Carter, Nicholas Davis-Fields,
Alinde Fojtik, and Clara Kienzle-Dean for their assistance processing samples in the
PLOS Pathogens | https://doi.org/10.1371/journal.ppat.1010605 June 6, 2022
18 / 25
�PLOS PATHOGENS
Avian influenza in the Atlantic Flyway
laboratory. Additionally, we would like to thank Kaity Reinstsma (USGS) along with numerous volunteers for assistance in collecting samples from wild birds. The use of trade, product,
or firm names in this publication is for descriptive purposes only and does not imply endorsement by the U.S. Government.
Author Contributions
Conceptualization: Diann J. Prosser, Andrew M. Ramey.
Data curation: Jiani Chen, Christina A. Ahlstrom, Andrew B. Reeves, Rebecca L. Poulson,
Jeffery D. Sullivan, Daniel McAuley, Carl R. Callahan, Peter C. McGowan, Andrew M.
Ramey.
Formal analysis: Diann J. Prosser, Jiani Chen, Christina A. Ahlstrom, Andrew B. Reeves,
Rebecca L. Poulson, Jeffery D. Sullivan, Justin Bahl, David E. Stallknecht, Andrew M.
Ramey.
Funding acquisition: Diann J. Prosser, Justin Bahl, David E. Stallknecht.
Investigation: Diann J. Prosser, Justin Bahl, David E. Stallknecht, Andrew M. Ramey.
Methodology: Diann J. Prosser, Justin Bahl, David E. Stallknecht, Andrew M. Ramey.
Project administration: Diann J. Prosser.
Resources: Diann J. Prosser, David E. Stallknecht.
Supervision: Diann J. Prosser, Justin Bahl, Andrew M. Ramey.
Validation: Diann J. Prosser, Andrew B. Reeves, Rebecca L. Poulson, Jeffery D. Sullivan, Justin
Bahl, David E. Stallknecht, Andrew M. Ramey.
Visualization: Diann J. Prosser, Jiani Chen, Christina A. Ahlstrom, Jeffery D. Sullivan, Justin
Bahl, Andrew M. Ramey.
Writing – original draft: Diann J. Prosser, Andrew M. Ramey.
Writing – review & editing: Diann J. Prosser, Jiani Chen, Christina A. Ahlstrom, Andrew B.
Reeves, Rebecca L. Poulson, Jeffery D. Sullivan, Daniel McAuley, Carl R. Callahan, Peter C.
McGowan, Justin Bahl, David E. Stallknecht, Andrew M. Ramey.
References
1.
Olsen B, Munster VJ, Wallensten A, Waldenström J, Osterhaus ADME, Fouchier RAM, et al. Global
patterns of influenza A virus in wild birds. Science (80-). 2006; 312: 384–388. https://doi.org/10.1126/
science.1122438 PMID: 16627734
2.
Baldassarre GA. Ducks, geese, and swans of North America. Baltimore, Maryland: Johns Hopkins
University Press; 2014.
3.
Blagodatski A, Trutneva K, Glazova O, Mityaeva O, Shevkova L, Kegeles E, et al. Avian influenza in
wild birds and poultry: Dissemination pathways, monitoring methods, and virus ecology. Pathogens.
2021; 10: 1–23. https://doi.org/10.3390/pathogens10050630 PMID: 34065291
4.
Hill NJ, Takekawa JY, Ackerman JT, Hobson KA, Herring G, Cardona CJ, et al. Migration strategy
affects avian influenza dynamics in mallards (Anas platyrhynchos). Mol Ecol. 2012; 21: 5986–5999.
https://doi.org/10.1111/j.1365-294X.2012.05735.x PMID: 22971007
5.
Lee DH, Torchetti MK, Hicks J, Killian ML, Bahl J, Pantin-Jackwood M, et al. Transmission Dynamics
of Highly Pathogenic Avian Influenza Virus A(H5Nx) Clade 2.3.4.4, North America, 2014–2015. Emerg
Infect Dis. 2018; 24: 1840–1848. Available: https://wwwnc.cdc.gov/EID/article/24/10/17-1891Techapp1.pdf https://doi.org/10.3201/eid2410.171891 PMID: 30226167
PLOS Pathogens | https://doi.org/10.1371/journal.ppat.1010605 June 6, 2022
19 / 25
�PLOS PATHOGENS
Avian influenza in the Atlantic Flyway
6.
Humphreys JM, Ramey AM, Douglas DC, Mullinax JM, Soos C, Link P, et al. Waterfowl occurrence
and residence time as indicators of H5 and H7 avian influenza in North American Poultry. Sci Rep.
2020; 10: 1–16. https://doi.org/10.1038/s41598-020-59077-1
7.
Humphreys JM, Douglas DC, Ramey AM, Mullinax JM, Soos C, Link P, et al. The spatial–temporal
relationship of blue-winged teal to domestic poultry: Movement state modelling of a highly mobile
avian influenza host. J Appl Ecol. 2021; 58: 2040–2052. https://doi.org/10.1111/1365-2664.13963
8.
Van Dijk JGB, Hoye BJ, Verhagen JH, Nolet BA, Fouchier RAM, Klaassen M. Juveniles and migrants
as drivers for seasonal epizootics of avian influenza virus. J Anim Ecol. 2014; 83: 266–275. https://doi.
org/10.1111/1365-2656.12131 PMID: 24033258
9.
Hénaux V, Samuel MD. Avian influenza shedding patterns in waterfowl: Implications for surveillance,
environmental transmission, and disease spread. J Wildl Dis. 2011; 47: 566–578. https://doi.org/10.
7589/0090-3558-47.3.566 PMID: 21719821
10.
Brown JD, Stallknecht DE, Swayne DE. Experimental infection of swans and geese with highly pathogenic avian influenza virus (H5N1) of Asian lineage. Emerg Infect Dis. 2008; 14: 136–142. https://doi.
org/10.3201/eid1401.070740 PMID: 18258093
11.
Pantin-Jackwood MJ, Swayne DE. Pathogenesis and pathobiology of avian influenza virus infection in
birds. Rev sci tech Off int Epiz. 2009; 28: 113–136. PMID: 19618622
12.
Wilcox BR, Knutsen GA, Berdeen J, Goekjian V, Poulson R, Goyal S, et al. Influenza-A viruses in
ducks in northwestern Minnesota: Fine scale spatial and temporal variation in prevalence and subtype
diversity. PLoS One. 2011. https://doi.org/10.1371/journal.pone.0024010 PMID: 21931636
13.
Latorre-Margalef N, Tolf C, Grosbois V, Avril A, Bengtsson D, Wille M, et al. Long-term variation in
influenza A virus prevalence and subtype diversity in migratory mallards in northern Europe. Proc R
Soc B Biol Sci. 2014; 281: 20140098. https://doi.org/10.1098/rspb.2014.0098 PMID: 24573857
14.
Ramey AM, Poulson RL, González-Reiche AS, Wilcox BR, Walther P, Link P, et al. Evidence for seasonal patterns in the relative abundance of avian influenza virus subtypes in blue-winged teal (Anas
discors). J Wildl Dis. 2014; 50: 916–922. https://doi.org/10.7589/2013-09-232 PMID: 24949926
15.
Diskin ER, Friedman K, Krauss S, Nolting JM, Poulson RL, Slemons RD, et al. Subtype Diversity of
Influenza A Virus in North American Waterfowl: a Multidecade Study. J Virol. 2020;94. https://doi.org/
10.1128/JVI.02022-19 PMID: 32188732
16.
Lickfett TM, Clark E, Gehring TM, Alm EW. Detection of Influenza A viruses at migratory bird stopover
sites in Michigan, USA. Infect Ecol Epidemiol. 2018; 8: 1474709. https://doi.org/10.1080/20008686.
2018.1474709 PMID: 29805786
17.
Hill NJ, Takekawa JY, Cardona CJ, Meixell BW, Ackerman JT, Runstadler JA, et al. Cross-seasonal
patterns of avian influenza virus in breeding and wintering migratory birds: a flyway perspective. Vector-Borne Zoonotic Dis. 2012; 12: 243–253. https://doi.org/10.1089/vbz.2010.0246 PMID: 21995264
18.
Hill NJ, Ma EJ, Meixell BW, Lindberg MS, Boyce WM, Runstadler JA. Transmission of influenza
reflects seasonality of wild birds across the annual cycle. Ecol Lett. 2016; 19: 915–925. https://doi.org/
10.1111/ele.12629 PMID: 27324078
19.
Rohani P, Breban R, Stallknecht DE, Drake JM. The role of environmental transmission in recurrent
avian influenza epidemics. PLoS Comput Biol. 2009; 5: 1–11. https://doi.org/10.1371/journal.pcbi.
1000346 PMID: 19360126
20.
Ramey AM, Reeves AB, Drexler JZ, Ackerman JT, De La Cruz S, Lang AS, et al. Influenza A viruses
remain infectious for more than seven months in northern wetlands of North America. Proc R Soc B.
2020; 287: 20201680. https://doi.org/10.1098/rspb.2020.1680 PMID: 32901574
21.
Densmore CL, Iwanowicz DD, Ottinger CA, Hindman LJ, Bessler AM, Iwanowicz LR, et al. Molecular
Detection of Avian Influenza Virus from Sediment Samples in Waterfowl Habitats on the Delmarva
Peninsula, United States. Avian Dis. 2017. https://doi.org/10.1637/11687-060917-ResNote.1 PMID:
29337613
22.
Lauterbach SE, McBride DS, Shirkey BT, Nolting JM, Bowman AS. Year-round influenza a virus surveillance in mallards (Anas platyrhynchos) reveals genetic persistence during the under-sampled
spring season. Viruses. 2020;12. https://doi.org/10.3390/v12060632 PMID: 32545281
23.
Munster VJ, Baas C, Lexmond P, Waldenström J, Wallensten A, Fransson T, et al. Spatial, temporal,
and species variation in prevalence of influenza A viruses in wild migratory birds. PLoS Pathog. 2007;
3: e61. https://doi.org/10.1371/journal.ppat.0030061 PMID: 17500589
24.
Fourment M, Darling AE, Holmes EC. The impact of migratory flyways on the spread of avian influenza
virus in North America. BMC Evol Biol. 2017; 17: 1–12. https://doi.org/10.1186/s12862-016-0855-1
25.
Lam TT-Y, Ip HS, Ghedin E, Wentworth DE, Halpin RA, Stockwell TB, et al. Migratory flyway and geographical distance are barriers to the gene flow of influenza virus among North American birds. Ecol
Lett. 2012; 15: 24–33. https://doi.org/10.1111/j.1461-0248.2011.01703.x PMID: 22008513
PLOS Pathogens | https://doi.org/10.1371/journal.ppat.1010605 June 6, 2022
20 / 25
�PLOS PATHOGENS
Avian influenza in the Atlantic Flyway
26.
Li L, Bowman AS, Deliberto TJ, Killian ML, Krauss S, Nolting JM, et al. Genetic Evidence Supports
Sporadic and Independent Introductions of Subtype H5 Low-Pathogenic Avian Influenza A Viruses
from Wild Birds to Domestic Poultry in North America. J Virol. 2018; 92: e00913–18. https://doi.org/10.
1128/JVI.00913-18 PMID: 30045988
27.
Hawkins AS, Hanson RC, Nelson HK, Reeves HM. Flyways: pioneering waterfowl management in
North America. Washington D.C.: US Department of the Interior, Fish and Wildlife Service.; 1984.
28.
Lincoln FC. The waterfowl flyways of North America (No. 342). Washington D.C.: United States
Department of Agriculture; 1935.
29.
USDA. An early detection system for highly pathogenic H5N1 avian influenza in wild migratory birds—
U.S. interagency strategic plan. 2006; 88.
30.
USDA. Surveillance Plan for Highly Pathogenic Avian Influenza in Wild Migratory Birds in the United
States. 2017; 1–26. Available: https://www.aphis.usda.gov/animal_health/downloads/animal_
diseases/ai/2017-hpai-surveillance-plan.pdf
31.
La Sorte FA, Fink D, Hochachka WM, Farnsworth A, Rodewald AD, Rosenberg K V., et al. The role of
atmospheric conditions in the seasonal dynamics of North American migration flyways. J Biogeogr.
2014; 41: 1685–1696. https://doi.org/10.1111/jbi.12328
32.
Pearce JM, Reeves AB, Ramey AM, Hupp JW, Ip HS, Bertram M, et al. Interspecific exchange of
avian influenza virus genes in Alaska: The influence of trans-hemispheric migratory tendency and
breeding ground sympatry. Mol Ecol. 2011. https://doi.org/10.1111/j.1365-294X.2010.04908.x PMID:
21073586
33.
Ramey AM, Pearce JM, Ely CR, Sheffield Guy LM, Irons DB, Derksen D V., et al. Transmission and
reassortment of avian influenza viruses at the Asian-North American interface. Virology. 2010; 406:
352–359. https://doi.org/10.1016/j.virol.2010.07.031 PMID: 20709346
34.
Lee D-H, Torchetti MK, Winker K, Ip HS, Song C-S, Swayne DE. Intercontinental Spread of Asian-Origin H5N8 to North America through Beringia by Migratory Birds. J Virol. 2015; 89: 6521–6524. https://
doi.org/10.1128/JVI.00728-15 PMID: 25855748
35.
Morin CW, Stoner-Duncan B, Winker K, Scotch M, Hess JJ, Meschke JS, et al. Avian influenza virus
ecology and evolution through a climatic lens. Environ Int. 2018; 119: 241–249. https://doi.org/10.
1016/j.envint.2018.06.018 PMID: 29980049
36.
Lee DH, Bahl J, Torchetti MK, Killian ML, Ip HS, DeLiberto TJ, et al. Highly pathogenic avian influenza
viruses and generation of novel reassortants, United States, 2014–2015. Emerg Infect Dis. 2016.
https://doi.org/10.3201/eid2207.160048 PMID: 27314845
37.
Dusek RJ, Hallgrimsson GT, Ip HS, Jónsson JE, Sreevatsan S, Nashold SW, et al. North Atlantic
migratory bird flyways provide routes for intercontinental movement of avian influenza viruses. PLoS
One. 2014;9. https://doi.org/10.1371/journal.pone.0092075 PMID: 24647410
38.
OIE. Immediate notification: report CAN-2021-HPAI-001. 2021. Available: https://wahis.oie.int/
#/report-info?reportId=45054
39.
Caliendo V, Lewis NS, Pohlmann A, Waldenstrom J, van Toor M, Lameris T, et al. Transatlantic
spread of highly pathogenic avian influenza H5N1 by wild birds from Europe to North America in 2021.
bioRxiv. 2022; 2022.01.13.476155. https://doi.org/10.1101/2022.01.13.476155
40.
USDA. 2022 Detections of Highly Pathogenic Avian Influenza in Wild Birds. 2022. Available: https://
www.aphis.usda.gov/aphis/ourfocus/animalhealth/animal-disease-information/avian/avian-influenza/
hpai-2022/2022-hpai-wild-birds
41.
Bevins SN, Shriner SA, Cumbee JC, Dilione KE, Douglass KE, Jeremy W, et al. Intercontinental movement of H5 2.3.4.4 Highly Pathogenic Avian Influenza A(H5N1) to the United States, 2021. bioRxiv
Prepr. 2022. Available: https://doi.org/10.1101/2022.02.11.479922
42.
Prosser DJ, Schley H, Simmons N, Sullivan JD, Homyack J. A Lesser Scaup (Aythya affinis) Naturally
Infected with Eurasian 2.3.4.4 Highly Pathogenic H5N1 Avian Influenza Virus–Movement Ecology and
Host Factors. Authorea Prepr. 2022. https://doi.org/10.22541/au.164932926.61082774/v2
43.
Davis JB, Guillemain M, Kaminski RM, Arzel C, Eadie JM, Rees EC. Habitat and resource use by
waterfowl in the northern hemisphere in autumn and winter. Wildfowl. 2014; 17–69.
44.
Lavretsky P, Miller JH, Bahn V, Peters JL. Exploring fall migratory patterns of American black ducks
using eight decades of band-recovery data. J Wildl Manage. 2014; 78: 997–1004. https://doi.org/10.
1002/jwmg.752
45.
Maryland Department of Natural Resources. Midwinter Waterfowl Survey Shows Rise in Bird Count.
2020. Available: https://news.maryland.gov/dnr/2020/02/06/midwinter-waterfowl-survey-shows-risein-bird-count/
46.
U.S. Fish and Wildlife Service. Atlantic Flyway Report 2016. 2016. Available: https://migbirdapps.fws.
gov/mbdc/databases/mwi
PLOS Pathogens | https://doi.org/10.1371/journal.ppat.1010605 June 6, 2022
21 / 25
�PLOS PATHOGENS
Avian influenza in the Atlantic Flyway
47.
Lewis BS, Eichholz MW, Yerkes T, Coluccy JM. Food resources for wintering and spring staging
American black ducks. J Fish Wildl Manag. 2019; 10: 492–499. https://doi.org/10.3996/102018JFWM-096
48.
Munroe RE, Perry MC. Distribution and abundance of waterfowl and submerged aquatic vegetation in
Chesapeake Bay. EPA Report: CBP-TR-001S. 1981.
49.
DCA. DCA Facts & Figures. In: Delmarva Chicken Association [Internet]. 2021. Available: https://
www.dcachicken.com/facts/facts-figures.cfm
50.
Ramey AM, Hill NJ, DeLiberto TJ, Gibbs SEJ, Camille Hopkins M, Lang AS, et al. Highly pathogenic
avian influenza is an emerging disease threat to wild birds in North America. J Wildl Manage. 2022;In
Press. https://doi.org/10.1002/jwmg.22171
51.
Wille M, Robertson GJ, Whitney H, Ojkic D, Lang AS. Reassortment of American and Eurasian genes
in an influenza A virus isolated from a great black-backed gull (Larus marinus), a species demonstrated to move between these regions. Arch Virol. 2011; 156: 107–115. https://doi.org/10.1007/
s00705-010-0839-1 PMID: 21053031
52.
Huang Y, Wille M, Benkaroun J, Munro H, Bond AL, Fifield DA, et al. Perpetuation and reassortment of
gull influenza A viruses in Atlantic North America. Virology. 2014; 456–457: 353–363. https://doi.org/
10.1016/j.virol.2014.04.009 PMID: 24889254
53.
Preskenis LA, Ladman BS, Gelb J Jr. Identification of Type A Influenza viruses from wild birds on the
Delmarva Peninsula, 2007–10. Avian Dis. 2017; 61: 83–89. https://doi.org/10.1637/11461-062716Reg PMID: 28301233
54.
Graves IL. Influenza Viruses in Birds of the Atlantic Flyway. Avian Dis. 1992; 36: 1–10. PMID: 1567297
55.
Prosser DJ, Densmore CL, Hindman LJ, Iwanowicz DD, Ottinger CA, Iwanowicz LR, et al. Low Pathogenic Avian Influenza Viruses in Wild Migratory Waterfowl in a Region of High Poultry Production, Delmarva, Maryland. Avian Dis. 2017; 61: 128. https://doi.org/10.1637/11476-072616-ResNote PMID:
28301229
56.
Trovão NS, Nolting JM, Slemons RD, Nelson MI, Bowman AS. The evolutionary dynamics of influenza
a viruses circulating in mallards in duck hunting preserves in Maryland, USA. Microorganisms. 2021;
9: 1–13. https://doi.org/10.3390/microorganisms9010040 PMID: 33375548
57.
Huang Y, Wille M, Dobbin A, Walzthöni NM, Robertson GJ, Ojkic D, et al. Genetic structure of avian
influenza viruses from ducks of the Atlantic flyway of North America. PLoS One. 2014;9. https://doi.
org/10.1371/journal.pone.0086999 PMID: 24498009
58.
Poulson R, Carter D, Beville S, Niles L, Dey A, Minton C, et al. Influenza a viruses in ruddy turnstones
(Arenaria interpres); Connecting wintering and migratory sites with an ecological hotspot at Delaware
Bay. Viruses. 2020; 12: 1–14. https://doi.org/10.3390/v12111205 PMID: 33105913
59.
Poulson RL, Luttrell PM, Slusher MJ, Wilcox BR, Niles LJ, Dey AD, et al. Influenza a virus: Sampling of
the unique shorebird habitat at Delaware Bay, USA. R Soc Open Sci. 2017;4. https://doi.org/10.1098/
rsos.171420 PMID: 29291124
60.
Brown VL, Drake JM, Stallknecht DE, Brown JD, Pedersen K, Rohani P. Dissecting a wildlife disease
hotspot: The impact of multiple host species, environmental transmission and seasonality in migration,
breeding and mortality. J R Soc Interface. 2013;10. https://doi.org/10.1098/rsif.2012.0804 PMID:
23173198
61.
Huang Y, Robertson GJ, Ojkic D, Whitney H, Lang AS. Diverse inter-continental and host lineage reassortant avian influenza A viruses in pelagic seabirds. Infect Genet Evol. 2014; 22: 103–111. https://doi.
org/10.1016/j.meegid.2014.01.014 PMID: 24462905
62.
Fries AC, Nolting JM, Bowman AS, Lin X, Halpin RA, Wester E, et al. Spread and Persistence of Influenza A Viruses in Waterfowl Hosts in the North American Mississippi Migratory Flyway. J Virol. 2015;
89: 5371–5381. https://doi.org/10.1128/JVI.03249-14 PMID: 25741003
63.
La Sorte FA, Fink D, Hochachka WM, Delong JP, Kelling S. Population-level scaling of avian migration
speed with body size and migration distance for powered fliers. Ecology. 2013; 94: 1839–1847. https://
doi.org/10.1890/12-1768.1 PMID: 24015527
64.
Reeves AB, Pearce JM, Ramey AM, Meixell BW, Runstadler JA. Interspecies transmission and limited
persistence of low pathogenic avian influenza genomes among Alaska dabbling ducks. Infect Genet
Evol. 2011; 11: 2004–2010. https://doi.org/10.1016/j.meegid.2011.09.011 PMID: 21964597
65.
Keeler SP, Dalton MS, Cressler AM, Berghaus RD, Stallknecht DE. Abiotic factors affecting the persistence of avian influenza virus in surface waters of waterfowl habitats. Appl Environ Microbiol. 2014.
https://doi.org/10.1128/AEM.03790-13 PMID: 24584247
66.
Reeves AB, Ramey AM, Koch JC, Poulson RL, Stallknecht DE. Field-based method for assessing
duration of infectivity for influenza A viruses in the environment. J Virol Methods. 2020; 277: 113818.
https://doi.org/10.1016/j.jviromet.2020.113818 PMID: 31923446
PLOS Pathogens | https://doi.org/10.1371/journal.ppat.1010605 June 6, 2022
22 / 25
�PLOS PATHOGENS
Avian influenza in the Atlantic Flyway
67.
Ramey AM, Reeves AB, Lagassé BJ, Patil V, Hubbard LE, Kolpin DW, et al. Evidence for interannual
persistence of infectious influenza A viruses in Alaska wetlands. Sci Total Environ. 2022; 803: 150078.
https://doi.org/10.1016/j.scitotenv.2021.150078 PMID: 34525758
68.
Hicks JT, Friedman K, Qiu X, Kim D-K, Hixson JE, Krauss S, et al. Host diversity and behavior determine patterns of interspecies transmission and geographic diffusion of avian Influenza A subtypes
among North American wild reservoir species. bioRxiv. 2021; 6. https://doi.org/10.1101/2021.09.29.
462321
69.
Latorre-Margalef N, Grosbois V, Wahlgren J, Munster VJ, Tolf C, Fouchier RAM, et al. Heterosubtypic
Immunity to Influenza A Virus Infections in Mallards May Explain Existence of Multiple Virus Subtypes.
PLoS Pathog. 2013. https://doi.org/10.1371/journal.ppat.1003443 PMID: 23818849
70.
Latorre-Margalef N, Brown JD, Fojtik A, Poulson RL, Carter D, Franca M, et al. Competition between
influenza A virus subtypes through heterosubtypic immunity modulates re-infection and antibody
dynamics in the mallard duck. PLoS Pathog. 2017. https://doi.org/10.1371/journal.ppat.1006419
PMID: 28640898
71.
Fereidouni SR, Starick E, Beer M, Wilking H, Kalthoff D, Grund C, et al. Highly pathogenic avian influenza virus infection of mallards with homo- and heterosubtypic immunity induced by low pathogenic
avian influenza viruses. PLoS One. 2009; 4: e6706. https://doi.org/10.1371/journal.pone.0006706
PMID: 19693268
72.
De Araujo J, de Azevedo SM Jr., Gaidet N, Hurtado RF, Walker D, Thomazelli LM, et al. Avian influenza virus (H11N9) in migratory shorebirds wintering in the Amazon region, Brazil. PLoS One. 2014;
9: 1–10. https://doi.org/10.1371/journal.pone.0110141 PMID: 25329399
73.
Hurtado R, Fabrizio T, Vanstreels RTE, Krauss S, Webby RJ, Webster RG, et al. Molecular characterization of subtype H11N9 avian influenza virus isolated from shorebirds in Brazil. PLoS One. 2015;10.
https://doi.org/10.1371/journal.pone.0145627 PMID: 26689791
74.
Nelson MI, Pollett S, Ghersi B, Silva M, Simons MP, Icochea E, et al. The genetic diversity of influenza
A viruses in wild birds in Peru. PLoS One. 2016; 11: 1–10. https://doi.org/10.1371/journal.pone.
0146059 PMID: 26784331
75.
Jiménez-Bluhm P, Karlsson EA, Freiden P, Sharp B, Di Pillo F, Osorio JE, et al. Wild birds in Chile Harbor diverse avian influenza A viruses article. Emerg Microbes Infect. 2018;7. https://doi.org/10.1038/
s41426-017-0007-8
76.
Krauss S, Stallknecht DE, Negovetich NJ, Niles LJ, Webby RJ, Webster RG. Coincident ruddy turnstone migration and horseshoe crab spawning creates an ecological “hot spot” for influenza viruses.
Proc R Soc B Biol Sci. 2010; 277: 3373–3379. https://doi.org/10.1098/rspb.2010.1090
77.
Krauss S, Obert CA, Franks J, Walker D, Jones K, Seiler P, et al. Influenza in migratory birds and evidence of limited intercontinental virus exchange. PLoS Pathog. 2007;3. https://doi.org/10.1371/
journal.ppat.0030167 PMID: 17997603
78.
Berhane Y, Hisanaga T, Kehler H, Neufeld J, Manning L, Argue C, et al. Highly pathogenic avian influenza virus a (H7N3) in domestic poultry, Saskatchewan, Canada, 2007. Emerg Infect Dis. 2009; 15:
1492–1495. https://doi.org/10.3201/eid1509.080231 PMID: 19788823
79.
Bahl J, Krauss S, Kühnert D, Fourment M, Raven G, Pryor SP, et al. Influenza A Virus Migration and
Persistence in North American Wild Birds. PLoS Pathog. 2013;9. https://doi.org/10.1371/journal.ppat.
1003570 PMID: 24009503
80.
Pearce JM, Ramey AM, Flint PL, Koehler A V., Fleskes JP, Franson JC, et al. Avian influenza at both
ends of a migratory flyway: characterizing viral genomic diversity to optimize surveillance plans for
North America. Evol Appl. 2009; 2: 457–468. https://doi.org/10.1111/j.1752-4571.2009.00071.x PMID:
25567891
81.
Reeves AB, Hall JS, Poulson RL, Donnelly T, Stallknecht DE, Ramey AM. Influenza A virus recovery,
diversity, and intercontinental exchange: A multi-year assessment of wild bird sampling at Izembek
National Wildlife Refuge, Alaska. PLoS One. 2018; 13: 1–26. https://doi.org/10.1371/journal.pone.
0195327 PMID: 29621333
82.
Carter D, Link P, Walther P, Ramey A, Stallknecht D, Poulson R. Influenza a prevalence and subtype
diversity in migrating teal sampled along the United States Gulf Coast. Avian Dis. 2019; 63: 165–171.
https://doi.org/10.1637/11850-041918-Reg.1 PMID: 31131574
83.
Hollander LP, Fojtik A, Kienzle-Dean C, Davis-Fields N, Poulson RL, Davis B, et al. Prevalence of influenza a viruses in ducks sampled in northwestern Minnesota and evidence for predominance of H3N8
and H4N6 Subtypes in Mallards, 2007–2016. Avian Dis. 2019; 63: 126–130. https://doi.org/10.1637/
11851-041918-Reg.1 PMID: 31131568
84.
Spear KA, Schweitzer SH, Goodloe R, Harris DC. Effects of management strategies on the reproductive success of Least Terns on dredge spoil in Georgia. Southeast Nat. 2007; 6: 27–34. https://doi.org/
10.1656/1528-7092(2007)6[27:eomsot]2.0.co;2
PLOS Pathogens | https://doi.org/10.1371/journal.ppat.1010605 June 6, 2022
23 / 25
�PLOS PATHOGENS
Avian influenza in the Atlantic Flyway
85.
Groepper SR, DeLiberto TJ, Vrtiska MP, Pedersen K, Swafford SR, Hygnstrom SE. Avian influenza
virus prevalence in migratory waterfowl in the United States, 2007–2009. Avian Dis. 2014; 58: 531–
540. Available: http://www.aaapjournals.info/doi/abs/10.1637/10849-042214-Reg.1 PMID: 25618997
86.
Bevins SN, Pedersen K, Lutman MW, Baroch JA, Schmit BS, Kohler D, et al. Large-scale avian influenza surveillance in wild birds throughout the United States. PLoS One. 2014; 9: e104360. https://doi.
org/10.1371/journal.pone.0104360 PMID: 25116079
87.
van Dijk JGB, Kleyheeg E, Soons MB, Nolet BA, Fouchier RAM, Klaassen M. Weak negative associations between avian influenza virus infection and movement behaviour in a key host species, the mallard Anas platyrhynchos. Oikos. 2015; 124: 1293–1303. https://doi.org/10.1111/oik.01836
88.
Diefenbach DR, Nichols JD, Hines JE. Distribution Patterns of American Black Duck and Mallard Winter Band Recoveries. 1988; 52: 704–710.
89.
ESRI. ArcMap 10.4. Redlands, California; 2021.
90.
Ip HS, Dusek RJ, Heisey DM. The effect of swab sample choice on the detection of avian influenza in
apparently healthy wild ducks. Avian Dis. 2012; 56: 114–119. https://doi.org/10.1637/9832-061311Reg.1 PMID: 22545536
91.
Whitworth D, Newman S, Mundkur T, Harris P. FAO Animal Production and Health Manual—Wild
Birds and Avian Influenza. Rome, Italy; 2007.
92.
Tolf C, Latorre-Margalef N, Wille M, Bengtsson D, Gunnarsson G, Grosbois V, et al. Individual Variation in Influenza A Virus Infection Histories and Long-Term Immune Responses in Mallards. PLoS
One. 2013;8. https://doi.org/10.1371/journal.pone.0061201 PMID: 23637797
93.
Brown JD, Stallknecht DE, Berghaus RD, Luttrell MP, Velek K, Kistler W, et al. Evaluation of a commercial blocking enzyme-linked immunosorbent assay to detect avian influenza virus antibodies in
multiple experimentally infected avian species. Clin Vaccine Immunol. 2009; 16: 824–829. https://doi.
org/10.1128/CVI.00084-09 PMID: 19386796
94.
Shriner SA, VanDalen KK, Root JJ, Sullivan HJ. Evaluation and optimization of a commercial blocking
ELISA for detecting antibodies to influenza A virus for research and surveillance of mallards. J Virol
Methods. 2016; 228: 130–134. https://doi.org/10.1016/j.jviromet.2015.11.021 PMID: 26645952
95.
Lenth RV. emmeans: Estimated Marginal Means, aka Least-Squares Means. 2021.
96.
Spackman E, Senne DA, Myers TJ, Bulaga LL, Garber LP, Perdue ML, et al. Development of a RealTime Reverse Transcriptase PCR Assay for Type A Influenza Virus and the Avian H5 and H7 Hemagglutinin Subtypes. J Clin Microbiol. 2002; 40: 3256–3260. https://doi.org/10.1128/JCM.40.9.32563260.2002 PMID: 12202562
97.
Stallknecht ADE, Shane SM, Zwank PJ, Senne DA, Kearney MT. Avian Influenza Viruses from Migratory and Resident Ducks of Coastal Louisiana Published by: American Association of Avian Pathologists Stable URL: http://www.jstor.org/stable/1591427 REFERENCES Linked references are available
on JSTOR for this article. 1990;34: 398–405.
98.
Killian ML. Hemagglutination Assay for the Avian Influenza Virus. In: Spackman E, editor. Avian Influenza Virus. 2008. pp. 47–52.
99.
Fouchier RA, Bestebroer TM, Herfst S, Van Der Kemp L, Rimmelzwaan GF, Osterhaus ADME. Detection of influenza A viruses from different species by PCR amplification of conserved sequences in the
matrix gene. J Clin Microbiol. 2000; 38: 4096–4101. https://doi.org/10.1128/JCM.38.11.4096-4101.2000
100.
Clark K, Karsch-Mizrachi I, Lipman DJ, Ostell J, Sayers EW. GenBank. Nucleic Acids Res. 2016; 44:
D67–D72.
101.
Stamatakis A. RAxML version 8: A tool for phylogenetic analysis and post-analysis of large phylogenies. Bioinformatics. 2014; 30: 1312–1313. https://doi.org/10.1093/bioinformatics/btu033 PMID:
24451623
102.
Rambaut A, Lam TT, Carvalho LM, Pybus OG. Exploring the temporal structure of heterochronous
sequences using TempEst (formerly Path-O-Gen). Virus Evol. 2016; 2: 1–7. https://doi.org/10.1093/
ve/vew007 PMID: 27774300
103.
Suchard MA, Lemey P, Baele G, Ayres DL, Drummond AJ, Rambaut A. Bayesian phylogenetic and
phylodynamic data integration using BEAST 1.10. Virus Evol. 2018; 4: 1–5. https://doi.org/10.1093/ve/
vey016 PMID: 29942656
104.
Shapiro B, Rambaut A, Drummond AJ. Choosing appropriate substitution models for the phylogenetic
analysis of protein-coding sequences. Mol Biol Evol. 2006; 23: 7–9. https://doi.org/10.1093/molbev/
msj021 PMID: 16177232
105.
Drummond AJ, Nicholls GK, Rodrigo AG, Solomon W. Estimating Mutation Parameters, Population
History and Genealogy Simultaneously From Temporally Spaced Sequence Data. Genetics. 2002;
1320: 1307–1320. https://doi.org/10.1093/genetics/161.3.1307 PMID: 12136032
PLOS Pathogens | https://doi.org/10.1371/journal.ppat.1010605 June 6, 2022
24 / 25
�PLOS PATHOGENS
Avian influenza in the Atlantic Flyway
106.
Rambaut A, Drummond AJ, Xie D, Baele G, Suchard MA. Posterior summarization in Bayesian phylogenetics using Tracer 1.7. Syst Biol. 2018; 67: 901–904. https://doi.org/10.1093/sysbio/syy032 PMID:
29718447
107.
Bielejec F, Rambaut A, Suchard MA, Lemey P. SPREAD: Spatial phylogenetic reconstruction of evolutionary dynamics. Bioinformatics. 2011; 27: 2910–2912. https://doi.org/10.1093/bioinformatics/btr481
PMID: 21911333
108.
Bahl J, Pham TT, Hill NJ, Hussein ITM, Ma EJ, Easterday BC, et al. Ecosystem Interactions Underlie
the Spread of Avian Influenza A Viruses with Pandemic Potential. PLOS Pathog. 2016; 12: e1005620.
https://doi.org/10.1371/journal.ppat.1005620 PMID: 27166585
109.
R Core Team. R: A language and environment for statistical computing. Vienna, Austria: R Foundation for Statistical Computing; 2021. Available: https://www.r-project.org/
110.
Hicks JT, Dimitrov KM, Afonso CL, Ramey AM, Bahl J. Global phylodynamic analysis of avian paramyxovirus-1 provides evidence of inter-host transmission and intercontinental spatial diffusion. BMC
Evol Biol. 2019; 19: 1–15. https://doi.org/10.1186/s12862-019-1431-2
111.
Edwards CJ, Suchard MA, Lemey P, Welch JJ, Barnes I, Fulton TL, et al. Ancient hybridization and an
irish origin for the modern polar bear matriline. Curr Biol. 2011; 21: 1251–1258. https://doi.org/10.
1016/j.cub.2011.05.058 PMID: 21737280
PLOS Pathogens | https://doi.org/10.1371/journal.ppat.1010605 June 6, 2022
25 / 25
�
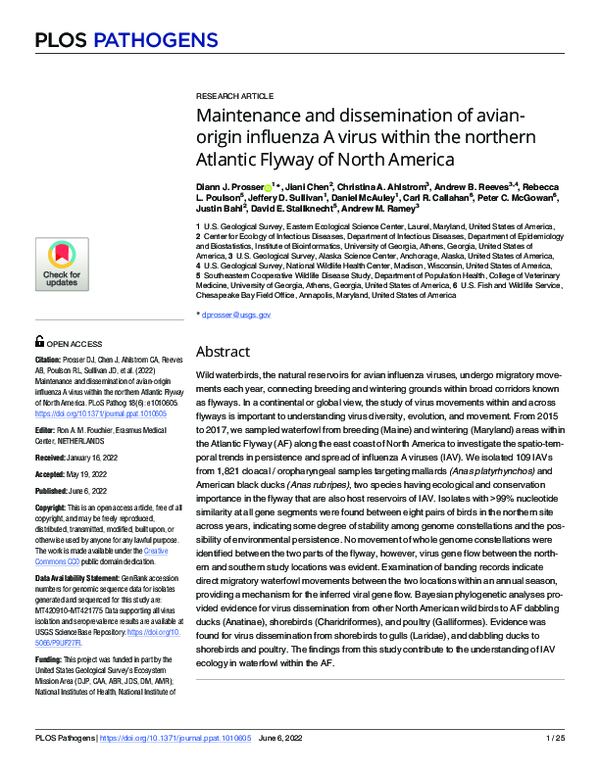
 Peter Mcgowan