See discussions, stats, and author profiles for this publication at: https://www.researchgate.net/publication/331436317
Environmental Triggers Associated With Empty Nose Syndrome Symptoms: A
Cross-Sectional Study
Article in The Annals of otology, rhinology, and laryngology · February 2019
DOI: 10.1177/0003489419833714
CITATIONS
READS
0
6
4 authors, including:
Jamil Manji
Andrew Thamboo
Ballarat Health Services
University of British Columbia - Vancouver
28 PUBLICATIONS 119 CITATIONS
51 PUBLICATIONS 231 CITATIONS
SEE PROFILE
Some of the authors of this publication are also working on these related projects:
Empty Nose Syndrome View project
All content following this page was uploaded by Jamil Manji on 05 March 2019.
The user has requested enhancement of the downloaded file.
SEE PROFILE
833714
AORXXX10.1177/0003489419833714Annals of Otology, Rhinology & LaryngologyManji et al
research-article2019
Article
Annals of Otology, Rhinology & Laryngology
1–7
© The Author(s) 2019
Article reuse guidelines:
sagepub.com/journals-permissions
https://doi.org/10.1177/0003489419833714
DOI: 10.1177/0003489419833714
journals.sagepub.com/home/aor
Environmental Triggers
Associated With Empty Nose
Syndrome Symptoms:
A Cross-Sectional Study
Jamil Manji, MD1,2 , Vishal S. Patel, MD3, Jayakar V. Nayak, MD, PhD2,
and Andrew Thamboo, MD, FRCSC, FARS1
Abstract
Objectives: Empty nose syndrome (ENS) is thought to have multiple etiologies, one of which is a postsurgical phenomenon
resulting from excessive loss of nasal tissues, particularly the inferior turbinate. Given that the inferior turbinate is
instrumental in maintaining nasal homeostasis in different environments, it is believed that ENS symptoms arise only in
more arid regions of the world. The aim of this study was to recruit an international population of individuals with ENS to
investigate the association of local climate factors on the incidence and severity of ENS-specific symptoms.
Methods: A cross-sectional study was performed of individuals from an international ENS database. ENS status was
determined on the basis of a positive ENS questionnaire score (Empty Nose Syndrome 6-Item Questionnaire) and sinus
computed tomographic imaging with supporting medical documentation. Participants completed a survey encompassing
demographic, geographic, and symptom indicators. Climate variables were collected from global climate databases.
Participant location was classified according to the Köppen-Geiger climate system. Pearson correlation analysis was
performed using α = 0.05 to determine significance.
Results: Fifty-three individuals with ENS were included. Participants were distributed across 5 continents and 15 countries
(representing 4 distinct Köppen-Geiger zones). Although local climate factors varied significantly within this cohort, no
significant association was found between Empty Nose Syndrome 6-Item Questionnaire symptom severity and these
climate factors. However, most study participants reported exacerbation of their ENS symptoms in response to dry air
(94%), air conditioning (64%), changes in season and weather (60%), and transitioning between indoors and outdoors
(40%). This suggests that everyday local environmental factors may influence the well-being of these patients more than
global, climate-level shifts.
Conclusions: ENS symptom severity does not appear to be related to climate or geographic factors. These findings
deviate from the traditional dogma that ENS is experienced only in arid regions (or precluded in humid regions) and
highlight the importance of recognizing this condition independent of geographic location.
Keywords
empty nose syndrome, sinus surgery, symptom severity, climate
Introduction
Empty nose syndrome (ENS) is often categorized as a subset of secondary atrophic rhinitis.1 However, the etiology of
ENS can be distinguished from other forms of atrophic rhinitis, as it is considered a postsurgical, iatrogenic complication following turbinoplasty and loss of excess nasal
turbinate tissue or volume.2,3 The incidence of this specific
condition is largely unknown given that, until recently, validated diagnostic criteria were lacking for ENS, and thus it
has been challenging to quantify. The cardinal symptoms of
ENS include nasal dryness, a sense of diminished nasal
airflow, the nose feeling “too open,” a sense of suffocation,
nasal crusting, and nasal burning. On the basis of these
symptoms, the validated subjective Empty Nose Syndrome
6-Item Questionnaire (ENS6Q) was introduced to better
1
St. Paul’s Sinus Centre, Vancouver, BC, Canada
Department of Otolaryngology–Head and Neck Surgery, Stanford
University, Stanford, CA, USA
3
Department of Otolaryngology–Head and Neck Surgery, University of
California, Los Angeles, CA, USA
2
Corresponding Author:
Andrew Thamboo, MD, FRCSC, FARS, St. Paul’s Sinus Centre, 1081
Burrard Street, Vancouver, BC V6Z 1Y6, Canada.
Email: andrew.thamboo@gmail.com
2
segregate true patients with ENS.4 The ENS6Q, along with
the diagnostic in-office cotton test and establishment of
radiographic evidence of mucosal change on computed
tomographic (CT) imaging, lends support to a physiologic
basis for ENS symptoms.5,6
The primary function of the nasal turbinates is to warm,
filter, and humidify air as it enters the nose7; however, turbinates that become inflamed and enlarged can cause prominent symptoms of nasal obstruction that may require
procedural treatment. Hypertrophic turbinates that do not
respond to medical management may be surgically reduced
to improve nasal patency and alleviate symptoms of nasal
obstruction.8 Although the vast majority of these procedures
are deemed successful, there is increasing recognition that a
small proportion of these cases may develop ENS-type
symptoms along a spectrum of severity. ENS symptoms are
thought to be potentially related to the altered aerodynamics
or receptor expression within the nasal cavity following turbinate surgery.9 The inferior turbinate is of particular importance in maintaining normal respiratory function when
confronted with different environments.10 When the turbinates are extensively reduced during sinus surgery, there is
evidence to suggest that turbinate function could potentially
be altered.11,12 Symptoms of dryness, crusting, and burning
may manifest in these cases.9 Given this possibility, it is
thought that similar to atrophic rhinitis, ENS-type symptoms may be more pronounced in arid climates.13 There is
also a hypothesis that ENS has a psychosomatic component, wherein an anxiety disorder (preexisting diagnosis or
developing after sinus surgery) may exacerbate the perception of ENS symptoms.14,15 Finally, there are differences in
favored turbinoplasty techniques, with more conservative,
mucosal-sparing techniques of turbinate reduction being
favored over earlier versions of this procedure.16,17
Hypothetically, mucosal-sparing techniques should result in
minimal disturbance to nasal aerodynamics.
We hypothesized that ENS symptoms would be more
severe in arid and/or colder climates because of the potential for impaired buffering capacity of resected inferior turbinates in identified patients with ENS. The aim of this
study was to determine if there is an association between
climate factors and ENS symptom severity.
Methods
A cross-sectional study was performed of self-identified
subjects with ENS registered in an international database
hosted by the Stanford Sinus Center. This research received
ethics approval from the Stanford University human ethics
and research committee. This database was composed of
individuals who identified as having ENS but who had not
necessarily been formally assessed using the in-office cotton test or the ENS6Q in the past. To be deemed a patient
with ENS for this study, candidate subjects had to satisfy
Annals of Otology, Rhinology & Laryngology 00(0)
the following criteria: positive ENS6Q score (≥11 of 30
possible points) and evidence of inferior turbinate reduction
(ITR) on sinus CT images, as well as medical documentation supporting a surgical history of this procedure.4 In clinical practice, validation of ENS status requires a positive
score on the ENS6Q and positive results on a cotton test.5
However, the ENS6Q has sensitivity of 86.7% and specificity of 96.6% and in combination with objective surgical history (based on CT images and medical documentation)
would allow the most accurate diagnosis for self-identified
patients with ENS. CT images had to demonstrate clear evidence of ITR upon assessment by 2 investigators to merit
inclusion in this study. Candidate subjects were not included
if evidence of ITR on CT imaging was not apparent.
The ENS6Q includes 6 questions pertaining to symptoms of nasal dryness, lack of air sensation going through
the nasal cavities, suffocation, the nose feeling too open,
nasal crusting, and nasal burning.4 In addition to the
ENS6Q, the research survey included questions related to
domicile, surgery location (if different), demographics, surgical history, and symptoms. Participants were specifically
asked about symptom-exacerbating factors frequently cited
by patients with ENS, such as dry air, cold air or air conditioning, allergens, transitioning from indoors to outdoors
(and vice versa), and changes in season and weather.
Potential disease-modifying factors related to climate
were interrogated from publicly available databases (Table 1).
Annual climate averages (dew point, humidity, temperature, precipitation) and altitude data were sourced from the
National Climatic Data Center on the basis of 22 to 50 years
of accrued data for respective cities. Pollution data were
obtained from the World Health Organization Global Urban
Ambient Air Pollution Database (on the basis of 2016 data).
Pollution is measured in terms of 2 size categories: particulate matter of aerodynamic diameter less than 10 µm (PM10) and particulate matter of aerodynamic diameter less
than 2.5 µm (PM-2.5). Where complete climate data for a
patient’s specific city were not available, data from a neighboring city up to 15 km away were substituted. This was
deemed acceptable as it was well within the 60-km grid
cells established by the US Environmental Protection
Agency for comparing climate change among regions.
Participants were also categorized by location on the
basis of the Köppen-Geiger (K-G) climate classification
system, the most widely used climate classification system.18
Originally designed to study global patterns of vegetation
and the impact of climate change, its utility has expanded to
public health research.19 The K-G system consists of 5 main
climate groups: A (tropical/megathermal) represents regions
where the temperature of the coolest month is 18°C or
higher; B (arid and semiarid) represents regions where there
is little precipitation; C (temperate/mesothermal) represents
regions where the temperature of the warmest month is
greater than or equal to 10°C and the temperature of the
3
Manji et al
Table 1. Local Geographic and Climate Variables Presented as Annual Averages.
Variable
n
Minimum
Maximum
Mean
SD
Temperature, °C
High temperature, °C
Low temperature, °C
Relative humidity, %
Morning humidity, %
Afternoon humidity, %
Dew point, °C
Annual precipitation, mm
Annual days of precipitation
PM-10
PM-2.5
Altitude, m
53
53
53
52
39
39
39
52
39
51
51
53
−9.6
−6.2
−13.4
54.0
0.0
39.0
−3.0
98.3
42.6
8.0
4.0
0
28.5
32.9
24.2
83.0
91.0
71.0
22.0
2431.3
364.8
117.0
63.0
2131
12.8
18.1
8.2
69.6
74.9
56.7
7.7
903.1
127.0
22.8
12.8
237.6
7.3
7.0
7.1
6.4
21.9
7.3
6.3
445.9
52.8
17.7
10.0
454.4
Abbreviations: PM-2.5, particulate matter of aerodynamic diameter less than 2.5 µm; PM-10, particulate matter of aerodynamic diameter less than 10 µm.
coldest month is less than 18°C but greater than −3°C; D
(continental/microthermal) represents regions where the
temperature of the warmest month is greater than or equal
to 10°C and temperature of the coldest month is −3°C or
lower; and E (polar and alpine/montane) represents regions
where the temperature of the warmest month is less than
10°C. The presence of second and third letters in the K-G
classification (eg, Cfa) relates to subgroups denoting the
levels of precipitation and heat, respectively.18
Statistical Analysis
Descriptive analyses were conducted to evaluate climate
variables and symptom severity among this group, along
with other key factors. Pearson correlation analysis was
performed to assess strength of association between independent climate variables and total ENS6Q symptom score,
as well as each of its component symptoms. The nonparametric Kruskal-Wallis test of independent samples was
used to assess for strength of correlation between categorical (K-G classification) and linear (ENS6Q and climate)
variables. IBM SPSS Statistics version 23 (IBM Corp.,
Armonk, New York, USA) was used for the analysis, with P
values < .05 considered to indicate statistical significance.
Results
Ninety-six potential subjects with ENS were screened to
participate in this study between December 2016 and March
2017. Of these, 53 individuals with ENS (including 15
women) demonstrated positive ENS6Q scores (mean, 20.57
± 5.06) and provided sufficient evidence of ITR (on the
basis of CT imaging and supporting medical documentation) to be included in the ENS international database.
Forty-three candidate participants were excluded because
they scored less than 11 on the ENS6Q questionnaire and/or
were unable to provide CT and/or documented evidence of
Table 2. Symptom Severity Among the Study Cohort on the
Basis of the ENS6Q.
Variable
n
Minimum
Maximum
Mean
SD
Total ENS6Q score
Symptoms
Dryness
Airflow
Suffocation
Too open
Crusting
Burning
53
11.00
30.00
20.57
5.06
53
53
53
53
53
53
1.00
0.00
0.00
0.00
0.00
0.00
5.00
5.00
5.00
5.00
5.00
5.00
4.07
4.02
3.23
3.74
2.74
2.77
0.91
1.02
1.46
1.57
1.70
1.82
Abbreviation: ENS6Q, Empty Nose Syndrome 6-Item Questionnaire.
turbinoplasty within the data collection period of this study.
However, among this excluded cohort (including 11
women), the mean ENS6Q score was still 15.6 ± 6.1.
The average age of included participants was 39.8 ±
11.4 years (range, 22-59 years). The reported onset of ENS
symptoms typically occurred within 1 year of surgery, and
the average duration of symptoms up to the census period
was 8.2 ± 7.8 years (range, 0.5-25 years). ENS symptom
severity (on the basis of ENS6Q score) was not significantly
associated with age, sex, or duration of symptoms. This
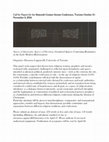
study cohort (n = 53) was widely distributed across 51 cities, in 15 countries on 5 continents (Figure 1). Climate factors were variable among the 51 locations studied (Table 1).
There were no significant associations found between
ENS6Q symptom severity (Table 2) and the following climate parameters (annual averages): overall temperature,
high temperature, low temperature, relative humidity,
morning humidity, evening humidity, dew point, days of
precipitation, total precipitation, and pollution indices (PM10 and PM-2.5) (Table 3). The average annual days of precipitation in a given location were positively correlated
with ENS6Q symptom severity; however, this association
4
Annals of Otology, Rhinology & Laryngology 00(0)
Figure 1. Geographic distribution of participants with empty nose syndrome. The heat map overlay is based on the Empty Nose
Syndrome 6-Item Questionnaire (ENS6Q) symptom score. Areas of higher ENS6Q symptom severity are demonstrated by more
intense red hues (created with Google Fusion).
Table 3. Correlation of Empty Nose Syndrome 6-Item
Questionnaire Score With Climate Variables.
Variable
Dew point
Morning humidity
Afternoon humidity
Relative humidity
Annual precipitation
Precipitation days per year
Average temperature
High temperature
Low temperature
PM-10
PM-2.5
Altitude
Pearson
Correlation
−0.22
−0.002
0.06
−0.08
0.09
0.27
0.002
−0.06
−0.003
−0.12
−0.13
−0.16
P Value
.19
.94
.75
.61
.53
.07
.99
.69
.99
.42
.39
.25
Abbreviations: PM-2.5, particulate matter of aerodynamic diameter less
than 2.5 µm; PM-10, particulate matter of aerodynamic diameter less than
10 µm.
was not statistically significant (P = .07; Table 3). This
study cohort was also distributed across 4 different K-G climate zones (Table 4). As expected, many of the climate factors studied were significantly different among K-G zones:
dew point (P = .003), relative humidity (P = .011), annual
total precipitation (P = .012), daily temperature (P < .001),
daily high temperature (P < .001), daily low temperature
(P < .001), and pollution indices (PM-10 and PM-2.5)
(P = .020). Despite this variation, the distribution of
ENS6Q scores was not significantly different across K-G
groups (Figure 2). This was found to be true across all
K-G primary categories (P = .730) and K-G subgroups
(P = .511). Notably, many ENS individuals shared that
their ENS-specific nasal symptoms became exacerbated in
response to dry air (94%), cold air or air conditioning
(64%), changes in season and weather (60%), and transitioning between indoors and outdoors (40%).
Fifteen subjects (28.3%) reported undergoing previous
office-based procedures for ENS. Forty-six subjects (86.8%)
5
Manji et al
Table 4. Classification of Study Cohort (n = 53) by the Köppen-Geiger Climate System.
Primary Class
Subcategory
A
f
m
s
w
B
Sk
C
sa
sb
wa
fa
fb
D
fa
fb
E
Climate Description
Tropical (megathermal)
Rainforest
Monsoon
Savannah, dry
Savannah, wet
Dry (arid and semiarid)
Steppe, cold
Temperate (mesothermal)
Hot summer, Mediterranean climate
Warm summer, Mediterranean climate
Monsoon-influenced humid subtropical
climate
Humid subtropical climate
Temperate oceanic climate
Continental (microthermal)
Hot summer, humid continental climate
Warm summer, humid continental climate
Polar and alpine (montane)
Sample, No. (%)
ENS6Q Score, Mean ± SD
6 (11.3)
1
1
2
2
2 (3.8)
2
31 (58.5)
6
4
1
20.0 ± 5.1
11
9
14 (26.4)
6
8
0 (0)
17.5 ± 4.9
21.5 ± 4.3
21.4 ± 3.5
-
Abbreviation: ENS6Q, Empty Nose Syndrome 6-Item Questionnaire.
scores on average than nonusers across all K-G categories,
this difference was not statistically significant (P = .074).
Discussion
Overview of Results
Figure 2. Average Empty Nose Syndrome 6-Item
Questionnaire (ENS6Q) score per Köppen-Geiger category.
Error bars indicate ±2 SDs.
were currently using recognized topical treatments for ENS,
while 7 subjects (13.2%) reported either no current nasal
regimen or “other.” Among these, saline irrigation was most
commonly used (n = 35 [66%]), followed by topical nasal
emollients (n = 17 [32%]), topical nasal steroid sprays
(n = 11 [20.7%]), and topical nasal decongestants (n = 9
[16.9%]). There was no significant difference in the prevalence of treatment use among K-G categories. Although
users of topical decongestants demonstrated lower ENS6Q
This study included a relatively large sampling of participants with ENS from around the world compared with other
studies regarding this syndrome. These participants resided
in a variety of differing climates but were united by a unique
cluster of sinonasal symptoms. Figure 1 depicts the global
distribution of this study population and includes a heat
map overlay demonstrating ENS6Q symptom severity for
each participant.
Climate factors such as temperature, humidity, precipitation, and pollution indices varied widely among participant
locations (Table 1) and K-G climate zones. The climate factors included in the analysis were well-known exacerbators
of both upper and lower respiratory conditions.20,21 The
impact of particulate matter in the atmosphere from urban
pollutants on respiratory disease has also been well
documented.22,23 Particulate matter is traditionally subdivided into two size categories, PM-10 and PM-2.5, and
each has been studied extensively for its significant impact
on upper and lower respiratory tract health outcomes.24-26
Among this ENS cohort, no significant association was
found between ENS6Q symptom severity and any of the
included climate factors (Table 3). However, a positive correlation between average annual days of precipitation and
6
ENS6Q approached statistical significance (Table 3). This
was not the case with average annual total precipitation.
Subgroup analysis of ENS6Q score between subjects in
each K-G classification group also demonstrated no significant difference. Although only 2 subjects resided in “arid”
regions (class B), several subjects from classes A and C
resided in regions that shared qualities with class B regions
in terms of precipitation and average annual temperature.
Thus, a comparison between temperate and arid climates
was deemed plausible in this study cohort.
Maladaptive Response to Local Environment
Overall, ENS6Q symptom score varied minimally between
K-G climate zones (Table 4). Interestingly, these participants reported exacerbations of their symptoms in response
to shifts in their local climate such as a change in season,
exposure to air conditioning, and transitioning from
indoors to outdoors (and vice versa). If these maladaptive
response to changes of the environment have been accurately reported, they could potentially be explained by
recent literature studying nasal heating and cooling capacities in computational fluid dynamics models of normal
sinonasal cavities and those with varying degrees of ITR.10
In normal healthy models, the nasal cavity was able to
warm up or cool down sufficiently in response to extremely
cold or hot environments, respectively, to maintain the
nasal temperature at approximately 34°C.10 In models in
which there was only a partial reduction of the inferior
turbinate, likely more reflective of modern mucosal-sparing techniques of ITR, there were no significant changes
in temperature-buffering capacity. Conversely, in models
of extensive turbinate reduction, the heating capacity was
significantly reduced, yielding nasal cavity temperatures
as much as 6.8°C lower than the normal healthy model.10
As illustrated in a past analysis of CT findings shared by
patients with ENS, the ENS nasal passage was demonstrated to develop compensatory mechanisms to attempt to
mimic the function of the inferior turbinate.6 This is
accomplished by swelling and autohypertrophy of the
remaining nasal tissues, creating pockets of bulk, in the
central and posterior nasal septum. Unfortunately, these
areas do not appear to have the same erectile nature as the
native inferior turbinate, and the compensatory mechanism would ultimately fall short in adapting to abrupt
shifts of climate.6
Limitations
Although this investigation managed to capture a population that was distributed across a variety of climate types,
the reach of this study was limited by the fact that the electronically distributed survey was made available only in
English. As a likely result, nearly half of this study cohort
Annals of Otology, Rhinology & Laryngology 00(0)
resided in North America. This may have also resulted in an
overrepresentation of temperate climates (K-G class C)
over arid and tropical zones (K-G classes A and B).
The cross-sectional design of this study also meant that
only a snapshot of symptom quality could be appreciated.
The climatic data obtained were based on annual averages,
while data related to patient-specific symptoms may have
been more reflective of an acute state. Participants would
have also been subject to recall bias when asked to evaluate their responses to acute environmental stressors (air
conditioning, transitioning from indoors to outdoors,
exposure to allergens, etc). Thus, symptom variation
related to acute climate stressors may have been overlooked. To test this new hypothesis, serial ENS6Q assessments between seasons and in response to acute
environmental stressors would be required. There are
many factors that could potentially influence the development and exacerbation ENS. Any discussion of ENS
symptoms would be remiss to omit the significant mental
health burden carried by patients with ENS and how that
may influence perceptions of sinonasal pain and discomfort on a case-by-case basis.15 The authors of a recent case
study proposed the treatment of ENS as a somatic symptom disorder.14 The potential interplay among environmental, anatomic, and psychological factors is naturally
difficult to discern and was beyond the scope of this survey-based study.
Conclusions
These findings suggest that, contrary to traditional perceptions, ENS may not be defined by geography or climate
zones. This study population demonstrates that individuals
who meet the symptomatic, historical, and radiographic criteria of ENS can be identified in nearly all parts of the
world. Symptom reporting suggests that the morbidities
associated with ENS may be more influenced by abrupt
shifts in temperature or humidity rather than a single climate type or geographic factor. This deviates from the
dogma that ENS is primarily experienced in arid geographic
areas and highlights the importance of recognizing this condition by medical and otolaryngology practitioners in all
parts of the world.
Authors’ Note
These findings were presented as an oral presentation at the annual
meeting of the American Rhinologic Society on September 9,
2017, in Chicago.
Acknowledgments
We gratefully acknowledge the contributions of our research coordinator, Kunju Sridhar, in obtaining ethics approval for this project. We would also like to thank the Empty Nose Syndrome
International Association for facilitating our recruitment efforts.
7
Manji et al
Declaration of Conflicting Interests
The author(s) declared no potential conflicts of interest with
respect to the research, authorship, and/or publication of this
article.
Funding
The author(s) received no financial support for the research,
authorship, and/or publication of this article.
ORCID iD
Jamil Manji
https://orcid.org/0000-0002-3455-6790
References
1. Shah K, Guarderas J, Krishnaswamy G. Empty nose syndrome and atrophic rhinitis. Ann Allergy Asthma Immunol.
2016;117:217-220.
2. Chhabra N, Houser SM. The diagnosis and management
of empty nose syndrome. Otolaryngol Clin North Am.
2009;42:311-330, ix.
3. Sozansky J, Houser SM. Pathophysiology of empty nose syndrome. Laryngoscope. 2015;125:70-74.
4. Velasquez N, Thamboo A, Habib AR, Huang Z, Nayak JV.
The Empty Nose Syndrome 6-Item Questionnaire (ENS6Q):
a validated 6-item questionnaire as a diagnostic aid for
empty nose syndrome patients. Int Forum Allergy Rhinol.
2017;7:64-71.
5. Thamboo A, Velasquez N, Habib AR, Zarabanda D,
Paknezhad H, Nayak JV. Defining surgical criteria for empty
nose syndrome: validation of the office-based cotton test and
clinical interpretability of the validated Empty Nose Syndrome
6-Item Questionnaire. Laryngoscope. 2017;127:1746-1752.
6. Thamboo A, Velasquez N, Ayoub N, Nayak JV. Distinguishing
computed tomography findings in patients with empty nose
syndrome. Int Forum Allergy Rhinol. 2016;6:1075-1082.
7. Lindemann J, Tsakiropoulou E, Vital V, et al. Influence of
the turbinate volumes as measured by magnetic resonance
imaging on nasal air conditioning. Am J Rhinol Allergy.
2009;23:250-254.
8. Larrabee YC, Kacker A. Which inferior turbinate reduction
technique best decreases nasal obstruction? Laryngoscope.
2014;124:814-815.
9. Hong HR, Jang YJ. Correlation between remnant inferior
turbinate volume and symptom severity of empty nose syndrome. Laryngoscope. 2016;126:1290-1295.
10. Chen XB, Lee HP, Chong VF, de Wang Y. Numerical simulation of the effects of inferior turbinate surgery on nasal airway
heating capacity. Am J Rhinol Allergy. 2010;24:e118-e122.
View publication stats
11. Naftali S, Rosenfeld M, Wolf M, Elad D. The air-conditioning
capacity of the human nose. Ann Biomed Eng. 2005;33:545553.
12. Scheithauer MO. [Surgery of the turbinates and “empty nose”
syndrome]. Laryngorhinootologie. 2010;89(suppl 1):S79S102.
13. Dutt SN, Kameswaran M. The aetiology and management of
atrophic rhinitis. J Laryngol Otol. 2005;119:843-852.
14. Lemogne C, Consoli SM, Limosin F, Bonfils P. Treating
empty nose syndrome as a somatic symptom disorder. Gen
Hosp Psychiatry. 2015;37:273.e9-273.e10.
15. Manji J, Nayak JV, Thamboo A. The functional and psychological burden of empty nose syndrome. Int Forum Allergy
Rhinol. 2018;8:707-712.
16. Bhandarkar ND, Smith TL. Outcomes of surgery for inferior
turbinate hypertrophy. Curr Opin Otolaryngol Head Neck
Surg. 2010;18:49-53.
17. Brunworth J, Holmes J, Sindwani R. Inferior turbinate hypertrophy: review and graduated approach to surgical management. Am J Rhinol Allergy. 2013;27:411-415.
18. Peel MC, Finlayson BL, McMahon TA. Updated world map
of the Köppen-Geiger climate classification. Hydrol Earth
Syst Sci. 2007;11:1633-1644.
19. Jagai JS, Castronovo DA, Naumova EN. The use of Köppen
climate classification system for public health research.
Epidemiology. 2007;18:S30.
20. Weiland SK, Husing A, Strachan DP, Rzehak P, Pearce N.
Climate and the prevalence of symptoms of asthma, allergic
rhinitis, and atopic eczema in children. Occup Environ Med.
2004;61:609-615.
21. Shusterman D. Nonallergic rhinitis: environmental determinants. Immunol Allergy Clin North Am. 2016;36:379-399.
22. D’Amato G, Cecchi L. Effects of climate change on environmental factors in respiratory allergic diseases. Clin Exp
Allergy. 2008;38:1264-1274.
23. D’Amato G, Baena-Cagnani CE, Cecchi L, et al. Climate
change, air pollution and extreme events leading to increasing
prevalence of allergic respiratory diseases. Multidiscip Respir
Med. 2013;8:12.
24. Lu F, Xu D, Cheng Y, et al. Systematic review and metaanalysis of the adverse health effects of ambient PM2.5 and
PM10 pollution in the Chinese population. Environ Res.
2015;136:196-204.
25. Anderson JO, Thundiyil JG, Stolbach A. Clearing the air:
a review of the effects of particulate matter air pollution on
human health. J Med Toxicol. 2012;8:166-175.
26. Mady LJ, Schwarzbach HL, Moore JA, et al. The association
of air pollutants and allergic and nonallergic rhinitis in chronic
rhinosinusitis. Int Forum Allergy Rhinol. 2018;8:369-376.
Academia.edu no longer supports Internet Explorer.
To browse Academia.edu and the wider internet faster and more securely, please take a few seconds to upgrade your browser.
Environmental Triggers Associated With Empty Nose Syndrome Symptoms: A Cross-Sectional Study
Annals of Otology, Rhinology & Laryngology, 2019
By Jamil Manji
...Read more
Related Papers
International forum of allergy & rhinology, 2018
Download


International Forum of Allergy & Rhinology, 2016
Download

The Egyptian Journal of Otolaryngology, 2016
Download


The Laryngoscope, 2017
Download

International Journal of …, 2012
Download

The Laryngoscope, 2001
Download

Brazilian Journal of Otorhinolaryngology, 2014
Download


Download