Ahmed et al., J Mar Biol Oceanogr 2015, 4:2
http://dx.doi.org/10.4172/2324-8661.1000146
Journal of Marine
Biology & Oceanography
Research Article
Correlation between Physical
and Chemical Parameters and
Marine Macro Zooplankton
Community around Port Sudan
Area
Amjed G Ahmed1, Zuheir N Mahmoud2, Dirar H. Nasr1,
Sheikheldin M Elamin3*
a SciTechnol journal
Materials and Methods
Sampling sites
Monthly water and plankton samples were collected from six
stations around Port Sudan from November 2009 up to October
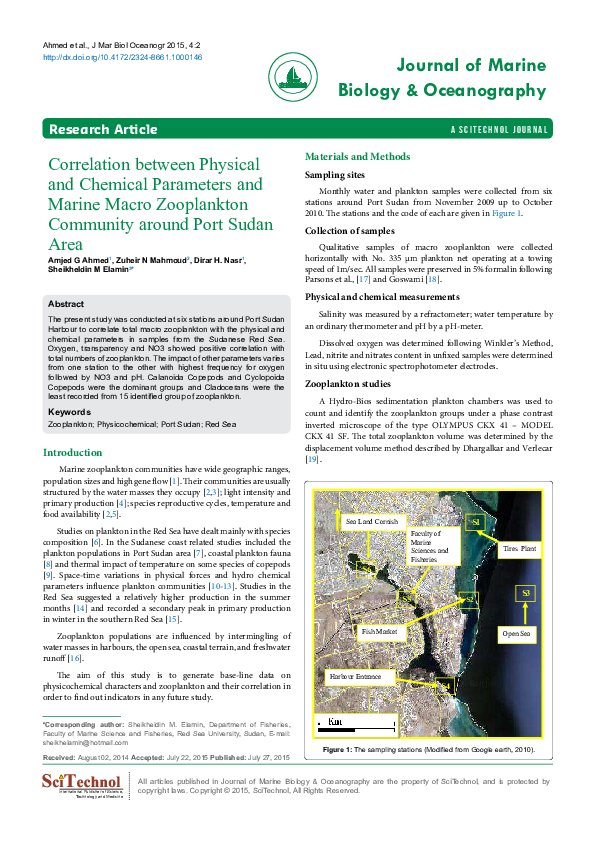
2010. The stations and the code of each are given in Figure 1.
Collection of samples
Qualitative samples of macro zooplankton were collected
horizontally with No. 335 µm plankton net operating at a towing
speed of 1m/sec. All samples were preserved in 5% formalin following
Parsons et al., [17] and Goswami [18].
Physical and chemical measurements
Abstract
The present study was conducted at six stations around Port Sudan
Harbour to correlate total macro zooplankton with the physical and
chemical parameters in samples from the Sudanese Red Sea.
Oxygen, transparency and NO3 showed positive correlation with
total numbers of zooplankton. The impact of other parameters varies
from one station to the other with highest frequency for oxygen
followed by NO3 and pH. Calanoida Copepods and Cyclopoida
Copepods were the dominant groups and Cladocerans were the
least recorded from 15 identified group of zooplankton.
Keywords
Zooplankton; Physicochemical; Port Sudan; Red Sea
Introduction
Marine zooplankton communities have wide geographic ranges,
population sizes and high gene flow [1]. Their communities are usually
structured by the water masses they occupy [2,3]; light intensity and
primary production [4]; species reproductive cycles, temperature and
food availability [2,5].
Studies on plankton in the Red Sea have dealt mainly with species
composition [6]. In the Sudanese coast related studies included the
plankton populations in Port Sudan area [7], coastal plankton fauna
[8] and thermal impact of temperature on some species of copepods
[9]. Space-time variations in physical forces and hydro chemical
parameters influence plankton communities [10-13]. Studies in the
Red Sea suggested a relatively higher production in the summer
months [14] and recorded a secondary peak in primary production
in winter in the southern Red Sea [15].
Zooplankton populations are influenced by intermingling of
water masses in harbours, the open sea, coastal terrain, and freshwater
runoff [16].
The aim of this study is to generate base-line data on
physicochemical characters and zooplankton and their correlation in
order to find out indicators in any future study.
*Corresponding author: Sheikheldin M. Elamin, Department of Fisheries,
Faculty of Marine Science and Fisheries, Red Sea University, Sudan, E-mail:
sheikhelamin@hotmail.com
Salinity was measured by a refractometer; water temperature by
an ordinary thermometer and pH by a pH-meter.
Dissolved oxygen was determined following Winkler’s Method,
Lead, nitrite and nitrates content in unfixed samples were determined
in situ using electronic spectrophotometer electrodes.
Zooplankton studies
A Hydro-Bios sedimentation plankton chambers was used to
count and identify the zooplankton groups under a phase contrast
inverted microscope of the type OLYMPUS CKX 41 – MODEL
CKX 41 SF. The total zooplankton volume was determined by the
displacement volume method described by Dhargalkar and Verlecar
[19].
Sea Land Cornish
S1
Faculty of
Marine
Sciences and
Fisheries
Tires Plant
S6
S3
S5
S2
Fish Market
Open Sea
Harbour Entrance
S4
Figure 1: The sampling stations (Modified from Google earth, 2010).
Received: August 02, 2014 Accepted: July 22, 2015 Published: July 27, 2015
International Publisher of Science,
Technology and Medicine
All articles published in Journal of Marine Biology & Oceanography are the property of SciTechnol, and is protected by
copyright laws. Copyright © 2015, SciTechnol, All Rights Reserved.
�Citation: Ahmed AG, Mahmoud ZN, Nasr DH, Elamin SM (2015) Correlation between Physical and Chemical Parameters and Marine Macro Zooplankton
Community around Port Sudan Area. J Mar Biol Oceanogr 4:2.
doi:http://dx.doi.org/10.4172/2324-8661.1000146
Identification
Identification of Cyclopoid Copepods, Calanoid Copepods,
brachyuran zoea, fish eggs, cladocerans, Oikopleura, shrimp larvae,
Sagitta, cumaceans, tintinnids, gastropod larvae, radiolarians,
Nauplii, Medusae, and polychaete larvae followed Taylor [20].
Preparation of permanent slides
Preparation of permanent zooplankton slides followed Gray [21].
Statistical Analysis
Analysis of variance was used to compare the total zooplankton
between the sampling stations using Microsoft Excel statistical
programme (2003). Duncan test and LSD test were used to show the
significant differences between the six stations and twelve months in
zooplankton using SPSS. Also p-value was calculated to determine the
significance of the relationship between total plankton and physical
and chemical parameters. Quantification of the relation between
total zooplankton and physical and chemical parameters was done by
multiple regression analysis of the type:
Y= b0 + b1X1 + b2X2 + b3X3 + b4X4 + b5X5 + b6X6 + b7X7 + b8X8
Where:
Y= Total Zooplankton, X1= Water temperature (°C), X2=
Transparency, X3= Salinity (%), X4 = pH, X5 = P (mg/L), X6= NO2,
X7= NO3, X8= O2.
Results
This section displays the findings regarding (a) physical and
chemical characteristics of water, and (b) zooplankton and ends up
by quantifying the correlation between a and b (given above).
Physical and chemical characteristics of water
The mean monthly reading of each parameter at each station was
given in Table 1 from which the followings were apparent:
1. Water temperature was comparable in all stations.
2. The highest transparency records were obtained from station 3
and the least from station 6.
3. Salinity was slightly higher at station 6.
4. The mean pH, PO4, NO2, NO3 and dissolved oxygen concentration
readings were comparable in all stations.
Zooplankton
The monthly readings of each zooplankton taxa at each station
were given in Table 2 showed that:
1- The recorded number of zooplankton was 15 groups. These were
Calanoid Copepods, Cyclopoid Copepods, brachyuran zoea, fish
eggs, cladocerans, Oikopleura, shrimp larvae, Sagitta, cumaceans,
tintinnids, Gastropod larvae, radiolarians, Nauplii, Medusae and,
polychaete larvae.
Table 1: The mean of monthly readings of physical and chemical parameters at
each station.
Parameter
Stations
1
2
3
4
5
6
Air Temp. ○C
30.33
30.17
30.58
30.25
30.25
30.25
27.83
Water Temp. ○C
27.92
27.83
27.83
27.5
27.83
Transparency (m)
4.75
8
14.61
11.88
7.33
2.42
Salinity %
39.88
39.88
39.88
39.88
39.88
42.17
pH
8.33
8.317
8.317
8.316
8.317
8.316
P mg/l
0.334
0.334
0.334
0.334
0.334
0.334
NO2- mg/l
0.818
0.818
0.818
0.818
0.818
0.818
NO3- mg/l
0.294
0.294
0.294
0.294
0.294
0.294
Oxygen mg/l
5.54
5.63
5.52
5.76
5.49
5.56
Table 2: Mean number of zooplankton taxonomy individuals in each station.
Species
Calanoida Copepods
Stations
1
2
3
4
5
6
722
372
213
415
412
79
122
Cyclopoida Copepods
155
134
150
202
96
Brachyuran Zoea
178
111
27
47
106
6
Fish eggs
78
124
122
115
40
24
Cladocerans
9
5
7
9
8
8
Oikopleura
23
30
51
60
45
24
Shrimp Larvae
174
83
37
58
66
0
Sagitta
13
17
54
58
18
4
Cumaceans
100
69
43
67
58
0
Tintinnids
15
21
13
11
28
0
Gastropod Larvae
37
28
53
28
32
68
Radiolarians
8
33
168
9
30
0
Nauplii
29
30
32
48
56
105
Medusae
32
18
32
23
23
10
Polychaete Larvae
11
22
8
7
5
8
The mean of the total monthly zooplankton readings from each
station was given in Table 3. The table revealed that the highest mean
number of zooplankton for all stations was in May (13430 ind/m3)
and the least mean number for all stations was in January (4262 ind/
m3); the highest total number of individuals /station was 18998 ind/
m3 in station 1 and the least was 5519 ind/m3 in station 6. The LSD test
was calculated for total zooplankton for all months and found that
the total zooplankton in May significantly different from the other
rest months (p>0.05); the same test was conducted for zooplankton /
station and it was found that station 6 differ significantly from other
five stations (p>0.05).
Correlation between physical and chemical characteristics
of water and mean total zooplankton
The total zooplankton was correlated with the physical and
chemical parameters at each station by multiple regression analysis
(Table 4). The results revealed that the multiple correlation coefficient
was highest in station 3 and lowest in station 5. The equation for
station 1 showed a high significant value (p<0.01), while for other five
stations it showed no significant value (p>0.05).
The table in general revealed the following:
2- Calanoid Copepods and Cyclopoid Copepods were the dominant
groups and Cladocerans were the least recorded.
1. Transparency, salinity, NO3 and Dissolved oxygen are positively
correlated with total numbers of zooplankton.
3- In Station 6 (highly saline) Cyclopoida Copepods and Nauplii
were encountered in large numbers compared with other groups.
2. Water temperature, pH and PO4 are negatively correlated with
total numbers of zooplankton.
Volume 4 • Issue 2 • 1000146
• Page 2 of 7 •
�Citation: Ahmed AG, Mahmoud ZN, Nasr DH, Elamin SM (2015) Correlation between Physical and Chemical Parameters and Marine Macro Zooplankton
Community around Port Sudan Area. J Mar Biol Oceanogr 4:2.
doi:http://dx.doi.org/10.4172/2324-8661.1000146
The equations in Table 4 were applied to obtain the calculated
mean of monthly zooplankton numbers for all stations (Figures 2-7).
The differences in the mean number of zooplankton between the
6 stations was highly significant (p<0.01) as the calculated F at DF 5, 66=
4.152 is higher than the tabulated F at DF5, 66= 3.339. The differences
between the stations in mean number of zooplankton was assessed by
Duncan test which indicated as shown in Table 5 that the readings in
a row with different manuscripts are significantly different (p<0.05)
and those with similar superscript showed no statistically significant
differences (p>0.05). The mean salinity is similar in stations 1, 2, 3, 4
and 5, whereas at station 6 it reached 46‰ leading to 250% drop in
mean total zooplankton.
Discussion
The extent of interaction between physical and chemical
parameters and plankton communities results in quantitative changes,
e.g. increases or decreases of size of the population [22]. The monthly
water temperature (27.79°C) were in accordance with Morcos [23]
who stated that the climate over the Red Sea is harmonious with
aridity and hotness of the surrounding landmasses. Edwards et al.
[24] stated that surface temperature increases gradually to reach a
maximum value of 32°C in September. The present study recorded
maximum air temperature of 38°C during June and July.
Salinity recorded 40‰ in most stations throughout of most of the
year; only station 6 recorded readings up to 46‰ due to influx from
the desalination plant. In January salinity dropped to less than 6‰
due to influx of rainfall, the consequence of this is marked drop in the
average number of zooplankton in station 6.
Discrepancy in transparency between the stations is linked
Table 3: The mean of monthly zooplankton numbers from each station.
Month
Stations
Total
1
2
3
4
5
6
November 2009
1091
December 2009
793
1015
840
1673
120
130
820
1370
1140
732
770
January 2010
1044
5625
402
926
1193
408
289
4262
February 2010
1310
382
824
1120
420
850
4906
March 2010
1700
1340
1600
1390
1860
330
8220
April 2010
1860
2720
1030
1580
1120
470
8780
May 2010
4160
1970
1350
1500
3010
1440
13430
June 2010
1780
1690
560
1260
810
460
6560
July 2010
1280
660
870
1010
480
170
4470
August 2010
1300
630
1150
730
860
200
4870
4869
September 2010
1510
670
900
700
1140
220
5140
October 2010
1170
840
670
570
1310
190
4750
75882
Total
18998
13139
12090
13866
12270
5519
Mean
1583
1095
1008
1156
1023
460
SD
470
501
230
355
784.
387
to rainfall, associated floods, and concentrations of organic
elements, suspended matter and nutrients. High transparency and
anthropogenic based land activities were inversely related in the
region and/or the effect of human activities on the coastal area.
Most of the Red Sea water is oligotrophic with the exception of
small areas off the Sinai Peninsula and the southern transition area
between the Red Sea and the Indian Ocean [25]. Nutrients affect the
zooplankton indirectly as they are influencing the phytoplankton,
which significantly affect the zooplankton. Phosphate, nitrite and
nitrate concentrations were higher in the rainy and flood season,
which is in an agreement with the fact that nutrient input to the
sea may occur anthropogenically or naturally through physical,
chemical and biological processes. Anthropogenic sources include
groundwater and river input, sewage discharge and industrial runoff,
both terrestrial and sea-based [26-28].
Morcos [23] discussed dissolved oxygen in the Red Sea, and
attributed its highest record (6.68 mg/L) in January due to an
increase in the dissolved oxygen concentration. Dissolved oxygen
concentration in the surface water of the Red Sea, which is near to
saturation values of 4.8 to 6.5 ml O2 / L depends on temperature and
salinity values [29]. The mean dissolved oxygen recorded during this
study (5.52-5.76 mg/L) is well within the ranges given by Nasr [8] and
by Quadfasel and Baudner [29].
The present study showed that Calanoid copepods recorded the
largest number; this is in conformity with Chiffings’ [30] findings in
the southern Red Sea.
The highest number of zooplankton in Station 4 is attributed
to an increase in nutrients in the month of November driven by
the North East wind. Hallegraeff [31] attributed such increase to
ballast water. Increased zooplankton number is also affected by
diverse environmental factors, including food availability [32] and
hydrodynamics performances including currents and waves [33].
According to Weikert [15] changes in standing stock and the biomass
of zooplankton generally coincide with the seasonal variation in
phytoplankton.
In January, zooplankton numbers especially cladocerans, shrimp
larvae, Sagitta and Nauplii were very low especially in Stations 2, 5,
6, which are closer to the sea coast probably due to excess turbidity,
and lower salinity. Low zooplankton numbers were attributed to
differences in reproductive cycles [2,5] and movement patterns [34].
The present study showed that after freshwater influx which
enriches seawater with nutrients zooplankton numbers increase. This
is in agreement with Marsh [26], D’Elia et al. [27] and Lewis [28].
Hamza [9] recorded in February low zooplankton numbers at Station
1 and higher number in Station 2. The opposite holds true in this
study. This discrepancy is attributed to the fact that the Tires Factory
*Y= Total Zooplankton, X1= Water temperature (°C), X2= Transparency, X3= Salinity (%), X4 = pH, X5 = P (mg/L), X6= NO2, X7= NO3, X8= O2
*p>0.05= insignificant, p<0.05= significant and p<0.01= highly significant
Table 4: Multiple regression analysis between total zooplankton (Y*) and the physical and chemical parameters by station.
r
r2
p- value
1
Y=-25469.53+49.21 X1+700.69 X2 +757.37 X3 -586.80 X4 -1117.74 X5 -1329.10 X6-5495.65 X7+650.20 X8
0.909
0.826
<0.01
2
Y= -12983.24-86.69 X1+115.15 X2 +487.51 X3 - 446.17 X4 -2494.29 X5 -1253.49 X6+4331.07 X7+75.13 X8
0.779
0.607
>0.05
3
Y= 41473.20-99.30 X1-70.11 X2 -354.19 X3 -2506.65 X4 -6679.63 X5 +1320.01 X6+8.86 X7-147.42 X8
0.945
0.893
>0.05
4
Y= -8350.14+8.84 X1+56.93 X2 +427.94 X3 -620.46 X4 -2573.56 X5 -1471.96 X6+136.33 X7-185.46 X8
0.905
0.819
>0.05
5
Y= 28519.93-9.63 X1+173.25 X2 -324.79 X3 -2058.71 X4-3578.83 X5 +0.01X6+5009.90 X7+235.14 X8
0.522
0.272
>0.05
6
Y=5564.57-106.00X1-68.37X2+29.70X3-1170.32 X4 +1321.27X5 +4680.53X6+1467.82 X7+321.61 X8
0.773
0.598
>0.05
Station
Multiple regression equation
Volume 4 • Issue 2 • 1000146
• Page 3 of 7 •
�Citation: Ahmed AG, Mahmoud ZN, Nasr DH, Elamin SM (2015) Correlation between Physical and Chemical Parameters and Marine Macro Zooplankton
Community around Port Sudan Area. J Mar Biol Oceanogr 4:2.
doi:http://dx.doi.org/10.4172/2324-8661.1000146
Figure 2. Observed and calculated mean of monthly zooplankton
numbers from station 1
4500
4000
3500
zooplankton numbers
Observed Plankton
Calculated Plankton
3000
2500
2000
1500
1000
500
0
Months
Figure 2: Observed and calculated mean of monthly zooplankton numbers from station 1.
Figure 3. Observed and calculated mean of monthly zooplankton
numbers from station 2
3000
2500
zooplankton numbers
Observed Plankton
Calculated Plankton
2000
1500
1000
500
0
Months
Figure 3: Observed and calculated mean of monthly zooplankton numbers from station 2.
3000
Figure 3. Observed and calculated mean of monthly zooplankton
numbers from station 2
zooplankton numbers
2500
Observed Plankton
Calculated Plankton
2000
1500
1000
500
0
Months
Figure 4: Observed and calculated mean of monthly zooplankton numbers from station 3.
Volume 4 • Issue 2 • 1000146
• Page 4 of 7 •
�Citation: Ahmed AG, Mahmoud ZN, Nasr DH, Elamin SM (2015) Correlation between Physical and Chemical Parameters and Marine Macro Zooplankton
Community around Port Sudan Area. J Mar Biol Oceanogr 4:2.
doi:http://dx.doi.org/10.4172/2324-8661.1000146
1800
Figure 5. Observed and calculated mean of monthly zooplankton
numbers from station 4
1600
zooplankton numbers
1400
Observed Plankton
Calculated Plankton
1200
1000
800
600
400
200
0
Months
Figure 5: Observed and calculated mean of monthly zooplankton numbers from station 4.
3500
Figure 6. Observed and calculated mean of monthly zooplankton
numbers from station 5
zooplankton numbers
3000
Observed Plankton
2500
Calculated Plankton
2000
1500
1000
500
0
Months
Figure 6: Observed and calculated mean of monthly zooplankton numbers from station 5.
1600
Figure 7. Observed and calculated mean of monthly zooplankton
numbers from station 6
zooplankton numbers
1400
1200
Observed Plankton
Calculated Plankton
1000
800
600
400
200
0
Months
Figure 7: Observed and calculated mean of monthly zooplankton numbers from station 6.
Volume 4 • Issue 2 • 1000146
• Page 5 of 7 •
�Citation: Ahmed AG, Mahmoud ZN, Nasr DH, Elamin SM (2015) Correlation between Physical and Chemical Parameters and Marine Macro Zooplankton
Community around Port Sudan Area. J Mar Biol Oceanogr 4:2.
doi:http://dx.doi.org/10.4172/2324-8661.1000146
Table 5: The relationship between the means number of zooplankton and salinity
in each station.
Stations
1
2
3
4
5
6
Mean
1583 a
1095 b
1008 b
1156 b
1023 b
460 c
Salinity%
40 a
40 a
40 a
40 a
40 a
46 b
at station 1 is no longer operating and station 2 is currently receiving
influx of nutrients from the fish market.
The decline in zooplankton numbers was more prominent at
Station 5 and Station 6; the former suffers from human pressure by
the Port Dock yard including oil seepage and remains of paints; while
the latter is under pressure of the desalination plant resulting in high
salinity values, which affects the zooplankton community. Plankton
communities integrate various human and environmental inputs,
thereby providing a benchmark for monitoring the synergistic effects
of urbanization and climate change [35].
From August to October, a gradual increased numbers of
zooplankton was observed possibly because of a gradual increase
in nutrients as mentioned by Zekeria [36] that most substantial
import of phosphate into the Red Sea occurs by subsurface inflow
of Gulf of Aden water from July to September. Seasonal differences
in the taxonomic composition of cyclopoids and poecilostomatoids
occurred in the central Red Sea [37]. In the Red Sea, low to moderate
primary production occurs [38,39] which decreases northward Halim
[38].
References
1. Angel MV (1993) Biodiversity in the pelagic ocean. Conservation Biology 7:
760-772.
2. Falk-Petersen S, Pedersen G, Kwasniewski S, Hegseth, EN, Hop H (1999)
Spatial distribution and life cycle timing of zooplankton in the marginal ice
zone of the Barents Sea during the summer melt season in 1995. J Plankton
Res 21: 1249-1264.
3. Clark DR., Aazem KV, Hays GC (2001) Zooplankton abundance and
community structure over a 4000 km transect in the north−east Atlantic. J
Plankton Res 23: 365-372.
4.
Eilertsen HC, Tande KS, Taasen JP (1989) Vertical Distributions of Primary
Production and Grazing by Calanus glacialis Jaschnov and C. hyperboreus
Kroyer in Arctic Waters (Barents Sea). Polar Biol 9: 253-260.
5. Conover RJ, Huntley M (1991) Copepods in ice−covered seas- Distribution,
adaptations to seasonally limited food, metabolism, growth patterns and life
cycle strategies in polar seas. J Mar Syst 2: 1-41.
6. Halim Y (1969) Plankton of the Red Sea. Oceanogr Mar Biol A Rev 7: 231-275.
7. El Hag AGD, Nasr DH (1989) Studies in planktonic populations in Port Sudan
coastal area. Sudan J Sci 4: 12-26.
8. Nasr DH (1980) Coastal plankton fauna of the Sudanese Red Sea.
Proceedings of the symposium on the Coastal and marine environment of
the Red Sea Gulf of Aden and tropical western Indian Ocean, Khartoum 1:
561-581.
9. Hamza ME (1989) Impact of thermal pollution on the marine life in Port Sudan
Area.
10. Cloern JE, Powell TM, Huzzley LM (1989) Spatial and temporal variability
in San Francisco Bay (USA). II Temporal changes in salinity, suspended
sediments, phytoplankton biomass and productivity over tidal time scales.
Estuar Coast Shelf Sci 28: 599-613.
11. Bianchi F, Acri F, Aubry FB, Berton A, Boldrin A et al. (2003) Can plankton
communities be considered as bioindicators of water quality in the lagoon of
Venice? Marine Pollut. Bull. 46: 964-971.
12. Waniek JJ (2003) The role of physical forcing in initiation of spring blooms in
the northeast Atlantic. J Mar Syst 39: 57-82.
13. Sridhar R, Thangaradjou T, Kumar SS, Kannan L (2006) Water quality and
Volume 4 • Issue 2 • 1000146
phytoplankton characteristics in the Palk Bay, southeast coast of India. J
Environ Biol 27: 561-566.
14. Ponomareva LA (1968) Quantitative distribution of zooplankton in the Red
Sea as observed in the period May-June 1966. Oceanology 8: 240-242.
15. Weikert H (1980) On the plankton of the central Red Sea. A first synopsis
of results obtained from Proceedings of the symposium on the Coastal and
marine environment of the Red Sea Gulf of Aden and tropical western Indian
Ocean, Khartoum 3: 135-167.
16. Farmer DM, Freeland HJ (1983) The Physical Oceanography of Fjords.
Progress in Oceanography 12: 147-219.
17. Parsons RT, Maita Y, Lalli CM (1984) A manual of chemical and biological
methods for seawater analysis. Pergamon Press, Toronto.
18. Goswami SC (2004) Zooplankton Methodology, Collection & Identification- a
field Manual. (1st edtn), National Institute of Oceanography, Goa, India.
19. +Dhargalkar VK, Verlecar XN (2004) Zooplankton Methodology, Collection
& Identification - a field manual. National Institute of Oceanography, Dona
Paula, Goa.
20. Taylor FJR (1993) The species problem and its impact on harmful
phytoplankton studies. In Toxic phytoplankton blooms of the sea. Elsevier,
New York, 81-86.
21. Gray P (1952) Handbook of basic microtechnique. (3rd Edtn), the McGrawHill Book Company, New York.
22. Welch PS (1952) Limnology. (2nd edtn), McGraw- Hill Book Company, New
York.
23. Morcos SA (1970) Physical and chemical oceanography of the Red Sea.
Oceanogr Mar Biol Ann Rev 8: 73-202.
24. Edwards AJ, Head SM (1987) Red Sea- Key environments. Pergamon Press,
Oxford, 45-69.
25. Thiel H, Karbe L, Weikert H (1986) Risk assessment of mining metalliferous
muds in the deep Red Sea. Ambio 15: 34-41.
26. Marsh JA (1977) Terrestrial inputs of nitrogen and phosphorus on fringing
reefs of Guam. 3rd Int. Coral Reef 1: 331-336.
27. D’Elia CF, Webb KL, Porter JW (1981) Nitrate-rich groundwater input to
Discovery Bay, Jamaica: A significant source of N to local coral reefs? Bull.
Mar Sci 31: 903-910.
28. Lewis JB (1985) Groundwater discharge onto coral reefs, Barbados (West
Indies). Proc 5th Int. Coral Reef Symp 6: 477-481.
29. Quadfasel D, Baudner H (1993) Gyre-scale circulation cells in the Red Sea.
Oceanologica Acta 16: 221-229.
30. Chiffings T (2003) Marine Region 11: Arabia Seas. A Global Representative
System of Marine Protected Areas.
31. Hallegraeff GM (1998) Transport of toxic dinoflagellates via ship’s ballast
water: bioeconomic risk assessment and efficacy of possible ballast water
management strategies. Mar Ecol Prog Ser 168: 297-309.
32. James DW (2000) Diet, movement, and covering behaviour of the sea urchin
Toxopneutes roseus in hydrolith beds in the Gulf of California, México. Mar
Biol 137: 913-923.
33. Arsenault DJ, Himmelman JH (1996) Size-related changes in vulnerability
to predators and spatial refuge use by juvenile Iceland scallops (Chlamys
islandica). Mar Ecol Prog Ser 140: 115-122.
34. Palmer MA, Allan JD, Butman CA (1996) Dispersal as a regional process
affecting the local dynamics of marine and stream benthic invertebrates.
Trends Ecol Evol 11: 322-326.
35. Hobday AJ, Okey TA, Poloczanska ES, Kunz TJ, Richardson AJ (2006)
Impacts of climate change on Australian marine life: part C, literature review’.
Report to the Australian Greenhouse Office, Canberra.
36. Zekeria AZ (2003) Butterflyfishes of the Southern Red Sea: Ecology and
Population Dynamics, Rijksuniversiteit Groningen, Asmara, Eritrea.
37. Bottger-Schnack R (1990) Community structure and vertical distribution of
cyclopoid copepods in the Red Sea.11. Aspects of seasonal and regional
differences. Mar Biol 106: 473-485.
• Page 6 of 7 •
�Citation: Ahmed AG, Mahmoud ZN, Nasr DH, Elamin SM (2015) Correlation between Physical and Chemical Parameters and Marine Macro Zooplankton
Community around Port Sudan Area. J Mar Biol Oceanogr 4:2.
doi:http://dx.doi.org/10.4172/2324-8661.1000146
38. Halim Y (1984) Plankton of the Red Sea and the Arabian Gulf. Deep-Sea
Res 31: 969-982.
39. Weikert H (1987) Plankton and the pelagic environment. Key Environments,
Red Sea, Pergamon Press, Oxford.
Author Affiliations
Top
1
Department of Biological Oceanography, Faculty of Marine Science and
Fisheries, Red Sea University
2
Department of Zoology, Faculty of Science, University of Khartoum
3
Department of Fisheries, Faculty of Marine Science and Fisheries, Red Sea
University
Submit your next manuscript and get advantages of SciTechnol
submissions
50 Journals
21 Day rapid review process
1000 Editorial team
2 Million readers
More than 5000
Publication immediately after acceptance
Quality and quick editorial, review processing
Submit your next manuscript at ● www.scitechnol.com/submission
Volume 4 • Issue 2 • 1000146
• Page 7 of 7 •
�
 Ferdije Zhushi Etemi