Zr-O-N coatings for decorative purposes: Study of the
system stability by exploration of the deposition
parameter space
C.I. Da Silva Oliveira, D. Martinez-Martinez, L. Cunha, M.S. Rodrigues, J.
Borges, C. Lopes, E. Alves, N.P. Barradas, M. Apreutesei
To cite this version:
C.I. Da Silva Oliveira, D. Martinez-Martinez, L. Cunha, M.S. Rodrigues, J. Borges, et al.. Zr-O-N
coatings for decorative purposes: Study of the system stability by exploration of the deposition parameter space. Surface and Coatings Technology, 2018, 343, pp.30-37. 10.1016/j.surfcoat.2017.11.056.
hal-01916313
HAL Id: hal-01916313
https://hal.science/hal-01916313
Submitted on 24 Jan 2022
HAL is a multi-disciplinary open access
archive for the deposit and dissemination of scientific research documents, whether they are published or not. The documents may come from
teaching and research institutions in France or
abroad, or from public or private research centers.
L’archive ouverte pluridisciplinaire HAL, est
destinée au dépôt et à la diffusion de documents
scientifiques de niveau recherche, publiés ou non,
émanant des établissements d’enseignement et de
recherche français ou étrangers, des laboratoires
publics ou privés.
Distributed under a Creative Commons Attribution - NonCommercial| 4.0 International
License
Zr-O-N coatings for decorative purposes: Study of the system stability by
exploration of the deposition parameter space
T
C.I. da Silva Oliveiraa, , D. Martinez-Martineza, L. Cunhaa, M.S. Rodriguesa, J. Borgesa, C. Lopesa,
E. Alvesb, N.P. Barradasc, M. Apreuteseid
⁎
a
Center of Physics, University of Minho, Campus de Azurem, 4800-058 Guimaraes, Portugal
Instituto de Plasmas e Fusão Nuclear, Instituto Superior Técnico, Universidade de Lisboa, Bobadela LRS, Portugal
c
Centro de Ciências e Tecnologias Nucleares, Instituto Superior Técnico, Universidade de Lisboa, Bobadela LRS, Portugal
d
INSA de Lyon, MATEIS Laboratory, Villeurbanne, France
b
The deposition of decorative coatings is an excellent solution to modify the surface of any material, particularly
the aesthetic finishing, without altering the properties of the substrate. Transition metal oxynitride films are
interesting for many applications, due the simple and economic way to tune between nitride and oxide bonding.
In reactive sputtering, this is done by playing with the flows of N2 and O2, leading to variations of properties (e.g.
color) in different directions. In this paper, zirconium is selected as transition metal due to the combination of
different characteristics (color, biocompatibility, mechanical properties, corrosion resistance).
The literature about Zr-O-N films reveals a confinement of chemical composition. Therefore, the aim of this
work is the exploration of the deposition parameter space in order to evaluate the stability of the Zr-O-N system,
i.e. verify if the chemical composition of the films still falls in the same range after variation of different deposition parameters. To do that, a series of Zr-O-N films is deposited first at different reactive flows, maintaining
the remaining deposition parameters constant. The obtained films can be classified in three different groups,
based on their chemical composition, crystalline structure, and film growth. These groups can be successfully
explained according to the sputtering characteristics, and correlated with the mechanical properties and color of
the films measured by nanoindentation and spectrophotometry respectively. The films deposited by variation of
other parameters are introduced afterwards and their characteristics are compared with the reference series.
1. Introduction
optical and mechanical properties, there is a high restriction in the
attainable color tones, particularly to golden yellows, greys, and black
[2,3,5]. More recently, transition metal oxynitrides have been gaining
importance in the domain of decorative applications. This class of
materials is particularly interesting because the properties of the films
can be tuned between those of nitrides and those of oxides [2,6–11].
In that regard, zirconium oxynitride coatings have been drawing
attention over the past years, due to the combination of a wide palette
of attainable colors [12–14], good biocompatibility [15], mechanical
properties [16] and corrosion resistance [17,18]. The majority of Zr-ON films in literature have been deposited by reactive magnetron sputtering operated with different sources (DC, RF or pulsed-DC)
[3–6,8,9,13,14,19–46], and their properties have been typically
tuned
via
the
modification
of
reactive
atmosphere
[3–6,8,9,13,14,19–25,27–42]. As a result, the reported chemical composition of the Zr-O-N films is surprisingly limited, located in a region
of the Zr-O-N ternary diagram which lies between metallic Zr and Zr
Bulk materials may fail to provide all the properties desired for a
certain application (mechanical, optical, electrical…) [1]. Whereas,
coatings are a reliable method to modify the surface of the materials in
order to achieve those properties without modification of the underlying substrate [1]. In that regard, color is interesting for many consumer products were the aesthetics is a fundamental requirement, for
instance for jewelry, eyeglass frames, wristwatch casings and wristbands, bathroom hardware (taps, towel racks, etc.), door locks and
handles, among others [2–4]. These coatings, whose aesthetics function
is important, are called decorative coatings and they should provide
also scratch-resistance, and protection against corrosion, among other
properties [2–4].
During a certain period of time, decorative coatings have been
largely based on elementary materials and binary nitrides (TiN, HfN,
ZrN…) [3]. Although transition metal nitrides exhibit outstanding
⁎
Corresponding author.
E-mail address: catarina.silva.oliveira@outlook.pt (C.I. da Silva Oliveira).
1
nitrides (ZrN and Zr3N4) and the region connecting nitrides, oxinitrides
(ZrOxNy) and oxides (ZrO2).
The aim of this work is to evaluate the observed stability of the ZrO-N system. Therefore, we study the potential of other deposition
parameters, e.g. target current or bias, to modify the chemical composition, crystallographic phases and properties of Zr-O-N films. To do
that, a series of samples prepared with different flows of a mixture of
N2 + O2 is deposited and characterized first, as a reference to evaluate
the influence of the variation of other deposition parameters.
the magnetron head. The base pressure was always below
2.6 × 10− 3 Pa. The depositions were performed by sputtering a Zr
target (99.6% at., 100 × 200 × 6 mm3) using Ar as working gas and a
mixture of N2 and O2 (85:15) as reactive gases, respectively. The discharge parameters (target potential, applied current and work pressure)
were monitored during the deposition using a Data Acquisition/Switch
Unit by Agilent 34970A. The data was acquired with a Benchlink Data
Logger III software. The substrates were not intentionally heated during
film deposition.
The conditions used in the depositions of the Zr-O-N samples are
listed in Table 1. The initial group of samples was deposited with reactive gas flows from 2.5 to 15 sccm maintaining the remaining conditions constant (Ar flow 25 sccm, Zr target current 2 A, no bias and
60 min of deposition time). The other samples were deposited with similar conditions as this first group while varying one of the deposition
parameters in order to investigate its effect in the characteristics and
properties of the film. The labelling of the films indicates this situation;
thus, samples belonging to the first group are identified only with the
mixture flow, while samples from the second group are labelled with
the mixture flow followed with the varied parameter and its value.
The morphology and thickness of the films was characterized by
2. Experimental details
Zr-O-N thin films were deposited onto (111) silicon pieces
(1.5 cm × 1.5 cm), glass (2 cm × 2 cm) and mirror-polished highspeed steel cylindrical substrates (∅ = 3 cm × 0.5 cm) by reactive
direct current magnetron sputtering in a laboratorial size deposition
equipment. The substrates were first cleaned with alcohol and etched in
a Zepto Plasma System (Diner) equipped with a 40 kHz/100 W generator. During the etching process, the power used was 100 W and the
Ar pressure was approximately 80 Pa. For the depositions, the substrates were clamped in a rotating holder (5 rpm) placed at 75 mm from
Table 1
Deposition conditions and characteristics of the Zr-O-N films. The varying parameter in each sample is indicated in bold.
Film
Flow of gases
(sccm)
N2 + O2
Ar
F2.50
2.50
25
F3.75
Target
current
(A)
Bias (-V)
2.0
Deposition time
(min)
0
60
Deposition
pressure
(Pa)
Target
voltage
(V)
Thickness
SEM
(nm)
RBS
(× 1016
at/cm2)
Chemical
composition (at.
%)
Zr
O
N
Zonea
Density
×1022
at/cm3
g/cm3
Sput.
XRD
SEM
Color
0.35
275.5
1390
617
81.4
1.4
17.1
4.44
5.41
M
1
C
S
3.75
0.37
276.7
1180
600
68.1
1.2
30.7
5.08
6.27
M
1
C
S
F4.00
4.00
0.38
297.6
−
576
45.6
10.7
43.7
−
−
R
2
C
G
F4.25
4.25
0.38
294.7
686
513
43.4
12.6
44.0
7.48
5.92
R
2
C
DG
F4.50
4.50
0.39
300.7
−
542
45.9
13.2
40.8
−
−
R
2
C
DG
F4.75
4.75
0.39
306.7
625
417
47.0
16.9
36.1
6.67
5.60
P
3
I
B-NI
F5.00
5.00
0.40
−
624
384
43.0
21.5
35.5
6.15
4.87
P
3
D
NI
F5.25
5.25
0.40
−
603
347
49.2
14.6
36.2
5.75
5.00
P
3
D
NI
F5.50
5.50
−
−
−
−
−
−
−
−
−
P
−
−
NI
F6.25
6.25
0.45
312.6
−
−
−
−
−
−
−
P
−
−
NI
F15.00
15.00
0.47
362.3
−
−
−
−
−
−
−
P
−
−
NI
F4.25-Ar10
4.25
10
0.20
367.8
−
498
55.5
7.5
37.0
−
−
M
1
−
S
F4.25-Ar40
4.25
40
0.45
289.3
−
729
46.8
13.0
40.3
−
−
R
2
−
S
F3.75-I1.5
3.75
25
1.5
0.40
285.5
418
275
41.9
23.9
34.2
6.58
5.12
P
3
I
NI
F4.00-I1.5
4.00
1.5
0.39
286.3
−
263
39.5
26.4
34.1
−
−
P
3
−
NI
F4.25-I1.5
4.25
1.5
0.39
296.2
−
304
35.8
30.1
34.1
−
−
P
3
−
NI
F4.25-I2.5
4.25
2.5
0.36
303.6
−
579
54.5
9.2
36.4
−
−
M
1
−
S
F4.25-B40
4.25
2.0
40
0.38
305.4
707
416
51.7
11.4
36.9
5.88
5.29
R
2
C
RB
F4.25-B30
4.25
30
0.39
297.8
−
454
52.4
7.3
40.3
−
−
R
2
−
DG
F4.50-t30
F4.50-t120
4.50
4.50
0.38
0.39
303.9
292.9
−
−
286
869
51.7
50.0
14.0
5.0
34.3
45.0
−
−
−
−
R
R
2
2
−
−
G
RB
0
30
120
a
Sputtering modes: M (metallic), R (reactive), P (poisoned). Growth: C (columnar), I (interrupted columns), D (dense). Color: S (silver), G (golden), DG (dark golden), RB (red
brownish), B (bluish), NI (non intrinsic).
2
3. Results and discussion
3.1. Variation of the N2 + O2 flow: sputtering zones
Fig. 1 shows the influence of the flow of reactive mixture on the
deposition pressure and target voltage (Fig. 1a), deposition rate
(Fig. 1b), and chemical composition (Fig. 1c) of the produced films.
Table 1 includes two different values of thickness evaluated by SEM and
by RBS, which show similar trends. When both data were available, the
density of the film could be calculated. The values are located between
4.87 and 6.27 g/cm3, while the densities of metallic hexagonal Zr (hZr), metallic cubic Zr (c-Zr), cubic nitride (c-ZrN), cubic oxynitride (cZr2ON2) and monoclinic oxide (m-ZrO2) are 6.52, 6.41, 7.09, 5.78 and
5.68 g/cm3, respectively.
The deposition pressure obviously grows with the flow of reactive
mixture (Fig. 1a), although small ‘jumps’ can be observed, which indicate the transition between different regimes. Three different zones
can be found, in agreement with a reactive sputtering process. Such
finding is in line with what was reported by several works
[8,12,13,20,21,34], which identified three zones that can be labelled as
metallic (M), transition or reactive (R), and oxide or poisoned (P). The
classification of samples according to different groups is indicated in
the right columns of Table 1.
Zone M corresponds to reactive gas flows up to 3.75 sccm. This zone
includes the coatings with low target voltages (< 280 V) and high
deposition rates (> 1.4 μm/h). These films have the highest concentration of Zr (> 68%) and very low amount of O (~ 1%), while the
N/O ratio is higher than 10. Within this Zone, the increase of the
N2 + O2 flow caused a parallel reduction of deposition rate and Zr
content. In addition, following the higher concentration of N, the
density increases from 5.41 to a maximum of 6.27 g/cm3 (film F3.75)
which is in line with the higher density of the c-ZrN relatively to the
densities of h-Zr and c-Zr.
The opposite behavior is shown by samples belonging to Zone P (reactive gas flows above 4.7 sccm). These samples present a very similar
deposition rate (around 0.6 μm/h) which is considerably lower than the
values of the Zone M. The increase in the reactive gas flow leads to an
increase of the target potential from values around 307 to values around
362 V. In this Zone the atomic concentrations of Zr, O and N are
46 ± 3%, 18 ± 3%, and 36 ± 1%, respectively. The N/O atomic ratio
is below 2.5, and the density of the films is lower than in film F3.75, in
agreement with the lower densities of the phases including oxygen.
The Zone R (flows between 3.75 and 4.5 sccm), shows a intermediate behavior in terms of deposition rate, target voltage and O
content. Thus, the O concentration has a value of 12 ± 1%, which is
significantly higher than in Zone M and lower than in Zone P. The Zr
content is 44 ± 1%, which is considerably lower than the concentration of Zone M and very similar to Zone P. Finally, this Zone shows
higher N concentrations than in the other two Zones, with values of
43 ± 2%, which is similar to the Zr concentration. The N/O ratio is
higher than 3. The density is intermediate between film F3.75 and
samples from region P.
The behavior of the deposition rate and target pontential can be related to the composition of the sputtering atmosphere in the chamber; at
low reactive flows, the poisoning of the target is overcomed by the
cleaning caused by sputtering, and a strong metal flux arives to the substrate leading to higher deposition rates. When the reactive gas flow is
increased, the poisoning rate increases relatively to the cleaning rate, and
as a consequence, the poisoning of the target surface starts to take place.
This causes an increase of the target potential and a reduction of the deposition rate, since the sputtering yield from a poisoned surface is lower.
In addition to the previous factors, the chemical composition of the
films is also related to the gas composition of the mixture (poorer in O2,
15%) and the relative affinity of both gases towards Zr (oxygen is more
reactive with zirconium than nitrogen) [12]. In zone M, the low poisoning leads to high Zr contents. The low O content and increasing N
Fig. 1. Influence of the reactive gas flow on different deposition and film parameters: a)
Pressure and steady-state Zr target potential. b) Deposition rate; c) Chemical composition.
The dashed lines represent the trends.
scanning electron microscopy (SEM) in an FEI - Nova 200 NanoSEM
(FEG/ESEM) equipment operating at 10 kV. The chemical composition
of the films was determined by Rutherford backscattering spectrometry
(RBS), using CTN/IST Van der Graaff accelerator in a chamber where
three detectors were installed: a standard PIPS detector at 140°, and
two pin-diode detectors located symmetrically to each other both at
165°. The spectra were collected for 2 MeV 4He+ beam and the angle of
incidence was 0° (normal incidence). The compositional profile of the
samples was determined using the software IBA Data furnace NDF
v9.6d. The areal density of the films (RBS thickness in at/cm2) has been
also calculated, which can be transformed into density using the
thickness measured by SEM [47]. The crystallographic structure was
investigated by X-ray diffraction in grazing incidence at θ = 4° on a
Brucker D8 Advanced system apparatus using Cu Kα radiation
(λ = 0.154 nm). Spectrophotometry was performed using a commercial Minolta CM-2600d portable spectrophotometer (wavelength range:
400–700 nm) in order to quantify the color of the samples according to
CIELab 1976 color space [48]. The specular component has been included, and a small mask of 3 mm diameter has been used. The mechanical properties of some selected films were measured with a Nano
Test nanoindenter (Micro Materials) using a conventional Berkovich
indenter. The maximum load was selected in such a way that the
maximum indentation depth did not exceed the 10%–15% of the
coating thickness in order to avoid the influence of the substrate. The
hardness and reduced Young's modulus were calculated from the loadunload displacement curves using the Oliver and Pharr method [49].
The spectrophotometric measurements were carried out in films deposited in silicon, steel and glass in the same batch, while the rest of
characterization was carried out in films deposited on silicon.
3
Fig. 2. X-section SEM images of different Zr-O-N films. a) F2.50. b) F3.75. c) F4.25. d) F4.75. e) F5.00. f) F5.25. Scale bars represent 500 nm.
concentrations for higher N2 + O2 flows indicates that the chemical
composition of the reactive mixture has a stronger effect than the relative reactivity of N2 and O2 (kinetically driven regime). This is because the O2 content is still low in relation to the sputtered area of the
Zr target. In Zone R, the Zr concentration is clearly reduced due to
starting of poisoning effect on the target. In parallel, the O and N
concentrations increase. Finally, in Zone P, the Zr concentration is similar to Zone R, but it is observed that the O concentration grows at
expenses of N. This is because, in presence of enough N2 and O2, the
preferential affinity of Zr towards O begins to dominate (thermodinamically driven regime).
The different sputtering modes have also a clear influence on the
growth mode of the coatings, as observed in the SEM cross section
micrographs of the films displayed in Fig. 2. The different types of
growth are indicated in Table 1 as well. In agreement with Fig. 1b, it is
very clear that the first couple of films have a considerable higher
thickness than the others (Fig. 2a and b). These images reveal a columnar morphology, which is typical for films deposited by DC magnetron sputtering. The columns became narrower and more defined for
higher mixture flows. Sample F4.75 (Fig. 2d), in the border of Zones R
and P, shows a change of microstructure, where the column growth
appears ‘interrupted’, and the columnar structure starts to vanish.
Further increase of flow of mixture leads to denser featureless compact
microstructures (Fig. 2e and f). In general, the variation of growth
corresponds with the zones defined in Fig. 1. In fact, this evolution from
columnar to a more dense structure with the increase of the gas flow is
similar to what was reported by other authors [6,8,16,35,37,50,51]. It
is worth mentioning that the mass density variations included in
Table 1 seem to be mainly related to the variation of phase composition,
as indicated before. Nevertheless, the atomic density obtained from RBS
is higher on films with O, being the maximum on sample F4.25, in
agreement with the trend observed by SEM.
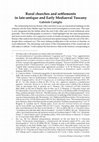
Fig. 3. Ternary diagram showing the chemical composition of the different Zr-O-N
samples studied. The reported crystalline phases are also included as stars. A straight line
connecting the phases with lowest Zr content is depicted to show their relationship (see
text for details).
for reference, since it probably represents a ‘limit’ where more O and N
cannot be stabilized by Zr [24]. In fact, in the line connecting these
latter two compounds we can find other four oxynitride phases
(Zr2ON2, Zr7O8N4, Zr7O9.5N3 and Zr7O11N2) [52–56], which are chemically related with the oxide and nitride by:
Zr3N4 + ZrO2 → 2 Zr2ON2
Zr3N4 + 4 ZrO2 → Zr7O8 N4
3 Zr3N4 + 19 ZrO2 → 4 Zr7O9.5 N3
3.2. Variation of the N2 + O2 flow: chemical composition and
crystallographic phases
Zr3N4 + 11 ZrO2 → 2 Zr7O11 N2
All the relevant phases are included in Fig. 3 as stars.
The first observation that can be made is that the samples are located in a small area of the diagram, in a similar region of other works
The chemical composition of the different films is plotted in a
ternary diagram in Fig. 3. A line connecting Zr3N4 and ZrO2 is included
4
Fig. 4. X-ray diffraction patterns of different Zr-O-N
films. a) Variation of the O2 + N2 flow. b) Variation
of Zr target current, bias voltage, Ar flow and deposition time.
from literature [3,8,12,16,18–20,22–25,33,34,37–39,51,57]. Most of
them are situated near the band that connects ZrN to ZrO2, although not
reaching compositions close to ZrO2. This is because the flow of reactive
gas was restricted to values where intrinsic colored coatings were obtained. An excess of O content would lead to transparent films, within
the visible region of the electromagnetic spectrum, and the eventually
obtained colors would be resultant of interference effects. The samples
where the N2 + O2 flow was varied are plotted as black circles connected by a black line. The films can be divided into three groups, in
agreement with Fig. 1c. Therefore, for low flows, the samples are close
to the Zr-N edge and to the Zr vertex. For higher flows, a group of three
samples is located between the ZrN and the Zr2ON2, while samples
produced with highest flows are displaced to higher O concentrations
with respect to them.
The chemical composition of the samples has a strong influence on
their crystalline structure, as can be observed in Fig. 4a. The films can
also be divided into three groups (labelled as 1, 2 and 3 in Table 1),
according to the general shape of the diffractograms. The first group is
formed by the two with highest Zr content, and it is characterized by the
appearance of broad peaks whose position agrees with the c-ZrN. The
broadness of the peaks may be correlated with the relatively distorted
crystallites due to deficiency of N relatively to stoichiometric ZrN. The
(111) is clearly detected in both films, and the (200), (220) and (311)
appear more or less clearly in sample F3.75, indicating the formation of
a c-ZrN-like structure. It is worth mentioning that one peak whose position fits with the (211) of bcc c-Zr [ref. 01-089-4916] is observed at ca.
63° on film F2.50, which agrees with the high concentration of Zr in this
sample. Clearly, these films are distinguished by a poorly-formed c-ZrN
due to the low N concentration (cf. Figs. 1c and 3).
In contrast, the three samples belonging to the second group are
characterized by sharp well-formed peaks. In case of sample F4.00, all
the peaks can be identified as c-ZrN. In the other two samples, additional
peaks are observed, whose positions fit with c-Zr2ON2. These phases are
in good agreement with the position of these samples in the ternary
diagram (cf. Fig. 3). Finally, the third group shows band-shaped peaks,
whose positions agree with c-ZrN, when observable. Since these samples
have higher O content than the previous, it can be stated that the introduction of additional oxygen beyond the formation of c-Zr2ON2 led to
a strong distortion of the crystalline structure of the films. The incorporation of oxygen in the zirconium nitride structure, forming a Zr-ON phase (ZrN and ZrO are isostructural), would cause its deformation and
higher number of defects promoting the amorphization, which explains
the broadening of the peaks. It is important to note that even higher
values of N2 + O2 flows leads to disappearance of peaks and further
amorphization of the structure. In addition, the peak (111) is not centred
around the position of the c-ZrN or c-ZrO, but it is broadened to lower
angles and also covers the region of the peaks of the c-Zr2ON2 phase that
appeared for the films belonging to group 2. Therefore, this can be interpreted as the result of growth and distortion of the c-Zr2ON2 peaks
observed in group 2, or the appearance of a new phase (e.g. Zr3N4 or mZrO2) [3,5,6,8,9,14,16,18–29,31–41,43–46,51,57,58].
These results are similar to what has been studied in literature for
reactively sputtered Zr-O-N films. Signore et al. [31], Rizzo et al. [32]
and Carvalho et al. [12,13] observed the change in the ZrN preferred
orientation from (111) to (200) with the increase of the reactive gas
flow, and Huang et al. [16,18] reported ZrN (111) preferred orientation
with the presence of (200) and (220) peaks at low O flows. The results
indicate that the preferred orientation is determined by the lowest
energy plane, which is a process that consists in a competition between
the plane with lowest strain energy (111) and the plane with lowest
surface energy (200) [59]. In our case, the c-ZrN phase show strong
(111) preferred orientations first, and new peaks belonging to c-ZrN
appear at N/Zr ratios approaching stoichiometry. In addition, Ngaruiya
and Venkataraj [28–30], Huang et al. [19], and Chan et al. [34] observed the evolution from ZrN to ZrNxOy-type (and even to ZrO2)
structures with further increase of the reactive flow.
3.3. Variation of the N2 + O2 flow: color
The films deposited with a N2 + O2 flow higher than 5.0 sccm show
non-intrinsic color and therefore are excluded from the plot of color
coordinates depicted in Fig. 5. These films are not opaque but show
some color, except the film deposited with 15 sccm which is fully
transparent (further details can be found in a dedicated paper [60]). In
fact, film F4.75 is somehow in the limit, showing bluish color but also a
certain degree of transparency. This is the reason why it is connected
5
Fig. 5. Color of Zr-O-N films. a) Three-dimensional
plot of the color coordinates of different films. The
projections on the different planes are represented by
hollow symbols. The line represents the overall trend,
and the colors indicate the different zones (see
Table 2). b) Bi-dimensional plot of the chromacity
coordinates a* and b* on top of a color wheel. The
lines connect the different symbols. (For interpretation of the references to color in this figure legend,
the reader is referred to the web version of this article.)
The reduction of target current causes an increase of pressure (and
the opposite for the increase), indicating that a change of the sputtering
regime has taken place. The increase of pressure is higher for lower
N2 + O2 mixture flow (e.g. higher variation from F3.75 to F3.75-I1.5
than from F4.25 to F4.25-I1.5, see Table 1), which is an indication of
stronger change of sputtering mode. On the one hand, the increase of
target current to 2.5 A causes a variation similar to the reduction of the
Ar flow (close points in the ternary diagram in Fig. 3 and similar diffractograms in Fig. 4); thus, the thickness is more or less invariant, but
the Zr concentration is increased, leading to XRD diffraction belonging
to Group 1 and exhibiting silver color (Fig. 5). On the other hand, the
reduction of target current to 1.5 A induces the deposition to the poisoned mode. Thus, the thickness is dramatically reduced, the O concentration is high and the XRD plots belong to Group 3. Such move to
poisoned mode is especially relevant for sample F3.75-I1.5, since F3.75
was a representative of the ‘metallic’ mode. Such change causes a reduction of mass density due to the reduction of Zr content, but an increase of atomic density due to the densification of the structure.
Nevertheless, F3.75-I1.5 shows the chemical composition closer to the
previous samples of Group 3 in the ternary diagram (cf. Fig. 3), and also
an ‘interrupted’ growth (SEM image not shown), indicating that although prepared in poisoned mode, it is close to the boundary. It should
be emphasized that the three films produced with lower current appear
‘ordered’ following higher flows of N2 + O2, showing progressively
higher O contents (Fig. 3) and XRD patterns indicative of more amorphous films (Fig. 4), respectively. As expected considering the chemical
compositions and XRD results, all these films are transparent.
The application of substrate bias does not cause any relevant variation in deposition pressure, and the deposition rate and growth modes
are kept invariant. However, it has been found that the target voltage
increased in both cases, probably leading to higher Zr concentrations
and lower N contents. The XRD's are similar to the unbiased sample
(Group 2 with presence of c-Zr2ON2). Nevertheless, in case of F4.25B30 peaks of the oxynitride phase between 60 and 65° could be clearly
detected, which were only incipient in the reference film F4.25. The
color of the sample deposited with 30 V of bias does not show any
major change, but F4.25-B40 showed a reduction of L* and b* coordinates, moving to the ‘red-brownish’ region.
Finally, the deposition time does not cause any strong variation of
the deposition parameters. The deposition pressure is similar (reactive
mode), and the diffractograms belong to Group 2. However, it can be
noted that target voltage shows a consistent reduction with deposition
time, indicating that the reactive system evolves with time. Thus, both
samples F4.50-t30 and F4.50-t120 show higher Zr contents than F4.50
at expenses of N and O, respectively. In fact, F4.50-t120 shows a diffractogram only composed by peaks of c-ZrN, in agreement with its
chemical composition close to ZrN (see Fig. 3). The color of the films is
displaced to different directions in Fig. 5, in agreement with the opposite variations in chemical compositions; thus, while the sample deposited with 30 min moved towards light-golden direction, the film
Table 2
Characteristics of the different trends observed in the representation of the color coordinates of Fig. 5a. The invariant coordinates in each segment are indicated in bold, and
the ranges of variation are indicated between parentheses.
Sub trend
a*
b*
L*
Red
Green
Blue
Pink
~ 0 → 5 (5)
~ 5 → ~ 10 (5)
~ 10
~ 10 → ~ 0 (−10)
~ 5 → ~ 30 (25)
~ 30 → ~ 20 (− 10)
~ 20 → ~ 5 (− 15)
~ 5 → ~− 5 (− 10)
~ 70 → ~ 63 (− 7)
~ 63 → ~ 55 (− 8)
~ 55 → ~ 50 (− 5)
~ 50
with dashed lines to the other samples, which share a common trend.
This trend is located in a similar region than other samples in literature
[6,13,14]. The characteristics of the different steps of this common
trend are summarized in Table 2; for low values of N2 + O2 flows (high
metal contents, Group 1 in XRD), the films show silver color. The increase of flow of the mixture leads to golden and dark golden films (Zr/
N ratios around 1 and Group 2 in XRD), although the values of L* are
lower than samples reported in literature for such colors [6,14]. A
further increase of N2 + O2 flow (samples with higher amount of O and
Group 3 in XRD) leads to bluish and non-intrinsic colors.
3.4. Further exploration of the deposition parameter space
For this investigation, films belonging to Zone P were not selected
due to their lack of intrinsic color. New sets of films were produced by
maintaining the parameters of the reference films but varying the Ar
flow, or the target voltage, or the bias or the deposition time (see
Table 1).
The increase of Ar flow from 25 to 40 sccm (from F4.25 to F4.25Ar40) caused a logical increase of pressure and reduction of target
voltage, and the opposite is seen for its reduction from 25 to 10 sccm
(from F4.25 to F4.25-Ar40). However, the magnitude of the variation is
different, and the changes observed for the Ar flow reduction are clearly
larger, which will be reflected in the variation of the characteristics and
properties of the films. Remarkably, in both cases the chemical composition shows an increase of Zr content, which is stronger in the case of
film produced with lower Ar flow, F4.25-Ar10 (see Fig. 3). A reduction
of N content is also observed. The deposition rate of F4.25-Ar40 is
significantly larger relatively to the reference film (F4.25) while in case
of F4.25-Ar10 is slightly lower. In addition, the XRD diffractograms
reflect a shift towards Group 1 (see Fig. 4). In case of F4.25-Ar40 the
modification is smaller, and only the disappearance of the c-Zr2ON2
peaks is observed. In contrast, F4.25-Ar10 moves to Group 1, and only
the (111) peak of c-ZrN is visible. As a consequence of these modifications, the color of the films changes from dark golden to silver
(Fig. 5), as observed previously in the samples with low N2 + O2 flow.
Nevertheless, film F4.25-Ar40 shows an abnormally low value of coordinate L* (see Fig. 5a), which probably indicates that this sample is in
an intermediate situation between the nitride and the metallic region.
6
The elastic work is similar for all the films around 50%. In contrast,
hardness and reduced Young's modulus shows similar trends, which can
be explained through the type and quality of phases present in the films.
The first increase of reactive flow leads to the increase of H and E*,
which is probably caused by the formation of a well-crystallized c-ZrNlike structure. Then, the appearance of c-Zr2ON2 phase at flow of
4.25 sccm seems to reduce slightly both parameters. Finally, with the
amorphization of the structure leads to a dramatic drop of both hardness and Young's modulus. It is also worth mentioning that biasing
leads to a moderate hardness increase, as it was expected.
In general, the values of mechanical properties are not very large,
which can be expected for columnar films deposited in reactive DC
sputtering. In addition, the presence of relatively large amounts of O is
known to reduce the mechanical properties of ZrN [14]. Nonetheless,
observed values are still reasonable for decorative applications; in addition, relatively low Young's modulus favours the matching with
conventional underlying substrates, reducing the presence of undesired
stresses at the interface.
Fig. 6. Nanoindentation curves of representative films of each group of samples (see
Table 1).
4. Conclusions
Zr-O-N films from literature occupy a very similar region of the
ternary diagram, near the Zr-N edge and then around the line connecting Zr3N4 and ZrO2. The aim of this work is to evaluate the stability
of the Zr-O-N system by studying the impact of the variation of different
deposition parameters on the characteristics and properties of Zr-O-N
films, aiming at decorative applications.
The reference series prepared by variation of N2 + O2 flow led to a
modification from metallic (Zr-rich poorly formed c-ZrN) to reactive
(well-formed c-ZrN with or without c-Zr2ON2) and to poisoned regimes
(high oxygen content and amorphous nature). These changes could be
well correlated with the sputtering parameters. From that generic trend,
the different parameters studied showed different effects. The variations of Ar flow and Zr target current caused stronger changes, while
bias and deposition time caused moderate variations. The color of the
samples all laid in the same region, although slightly different from
what has been observed in literature. The mechanical properties are
reasonable for decorative applications. Both properties could be
well explained according to the different phases present in the films.
The Zr-O-N system appears to be very stable, and therefore other
synthesis strategies will be explored in order to reach new regions of
composition.
Fig. 7. Mechanical properties of representative films of each group of samples (see
Table 1). The hollow symbol indicates the biased sample (−40 V).
deposited for 120 min showed red-brownish color.
In general, it can be stated that Ar flow and target current caused
stronger variations in the sputtering mode, XRD group and chemical
composition of the films. This was reflected in color displacements to
the limits of the scale, to silver (metallic-like) and transparent (oxidelike). The modifications introduced by bias and deposition time were
less intense, and the sputtering mode and XRD group were not modified. Only the appearance or disappearance of peaks could be detected.
As a consequence, the color changes were not so deep, and varied in a
region close around the color of the original film.
The financial support of Portuguese Foundation of Science and
Technology (FCT), under the project number IF/00671/2013 is gratefully acknowledged.
3.5. Mechanical properties
References
Acknowledgements
The mechanical properties of the films have been evaluated on representative samples belonging to each of the groups identified so far:
type M, with poorly formed c-ZrN (F3.75); type R, with well-formed cZrN (F4.00), or including also c-Zr2ON2 (F4.25); type P, with amorphous structure (F4.75). Since bias is expected to have an influence on
the mechanical properties, film F4.25-B40 has been also measured.
Fig. 6 shows the indentation curves obtained for all these films. Three of
the films show similar loading curves (although the biased film is a little
bit displaced to lower displacements), while in the other two cases
(F3.75 and F4.75) the curves are clearly displaced to higher displacements at a given load. This indicates that those latter films, which represent the groups of samples deposited in metallic and poisoned mode,
respectively, will show lower values of mechanical properties. Such
observation can be confirmed in Fig. 7, where hardness, reduced
Young's modulus and elastic work are represented against reactive flow.
[1] A. Piegari, F. François, Optical Thin Films and Coatings, Woodhead Publishing
Limited, 2013.
[2] F. Vaz, P. Cerqueira, L. Rebouta, et al., Structural, optical and mechanical properties
of coloured TiNxOy thin films, Thin Solid Films 447–448 (2004) 449–454, http://
dx.doi.org/10.1016/S0040-6090(03)01123-4.
[3] E. Ariza, L.A. Rocha, F. Vaz, et al., Corrosion resistance of ZrNxOy thin films obtained by rf reactive magnetron sputtering, Thin Solid Films 469–470 (2004)
274–281, http://dx.doi.org/10.1016/j.tsf.2004.08.091.
[4] E. Ariza, L.A. Rocha, S.C. Ferreira, et al., Corrosion behaviour of single layered
ZrNxOy thin films in artificial sweat solutions, Proc. Eur. Corros. Conf, 2004.
[5] F. Vaz, P. Carvalho, L. Cunha, et al., Property change in ZrNxOy thin films: effect of
the oxygen fraction and bias voltage, Thin Solid Films 469–470 (2004) 11–17,
http://dx.doi.org/10.1016/j.tsf.2004.06.191.
[6] P. Carvalho, F. Vaz, L. Rebouta, et al., Structural, electrical, optical, and mechanical
characterizations of decorative ZrOxNy thin films, J. Appl. Phys. 98 (2005) 1–8,
http://dx.doi.org/10.1063/1.1990261.
[7] A.C. Fernandes, L. Cunha, C. Moura, et al., TiN-based decorative coatings: colour
change by addition of C and O, J. Optoelectron. Adv. Mater. 10 (2008) 900–903.
[8] C. Moura, P. Carvalho, F. Vaz, et al., Raman spectra and structural analysis in
7
[9]
[10]
[11]
[12]
[13]
[14]
[15]
[16]
[17]
[18]
[19]
[20]
[21]
[22]
[23]
[24]
[25]
[26]
[27]
[28]
[29]
[30]
[31]
[32]
[33]
ZrOxNy thin films, Thin Solid Films 515 (2006) 1132–1137, http://dx.doi.org/10.
1016/j.tsf.2006.07.039.
S. Mohamed, A. Abd El-Rahman, M. Ahmed, Investigation of zirconium oxynitride
thin films deposited by reactive pulsed magnetron sputtering, J. Phys. D. Appl.
Phys. 40 (2007) 7057–7062, http://dx.doi.org/10.1088/0022-3727/40/22/029.
J. Rezek, J. Vlček, J. Houška, R. Čerstvý, High-rate reactive high-power impulse
magnetron sputtering of Ta-O-N films with tunable composition and properties,
Thin Solid Films 566 (2014) 70–77, http://dx.doi.org/10.1016/j.tsf.2014.07.033.
A. Belosludtsev, J. Houška, J. Vlček, et al., Structure and properties of Hf-O-N films
prepared by high-rate reactive HiPIMS with smoothly controlled composition,
Ceram. Int. 43 (2017) 5661–5667, http://dx.doi.org/10.1016/j.ceramint.2017.01.
102.
P. Carvalho, J.M. Chappé, L. Cunha, et al., Influence of the chemical and electronic
structure on the electrical behavior of zirconium oxynitride films, J. Appl. Phys. 103
(2008) 104907, , http://dx.doi.org/10.1063/1.2927494.
P. Carvalho, J. Borges, M.S. Rodrigues, et al., Optical properties of zirconium
oxynitride films: the effect of composition, electronic and crystalline structures,
Appl. Surf. Sci. 358 (2015) 660–669, http://dx.doi.org/10.1016/j.apsusc.2015.09.
129.
P. Carvalho, F. Vaz, L. Cunha, et al., Structural and optical characterization of
decorative ZrOxNy thin films, Soc. Vac. Coaters - Annu. Tech. Conf. Proc, 2005, pp.
580–583.
G.I. Cubillos, J.J. Olaya, D. Clavijo, et al., Synthesis and biological characterization
of zirconium oxynitride thin film growth by radio-frequency sputtering, Thin Solid
Films 529 (2013) 342–346, http://dx.doi.org/10.1016/j.tsf.2012.06.018.
J.-H. Huang, K.-H. Chang, Yu G-P, Synthesis and characterization of nanocrystalline
ZrNxOy thin films on Si by ion plating, Surf. Coat. Technol. 201 (2007) 6404–6413,
http://dx.doi.org/10.1016/j.surfcoat.2006.12.007.
G.I. Cubillos, M. Bethencourt, J.J. Olaya, Corrosion resistance of zirconium oxynitride coatings deposited via DC unbalanced magnetron sputtering and spray pyrolysis-nitriding, Appl. Surf. Sci. 327 (2015) 288–295, http://dx.doi.org/10.1016/j.
apsusc.2014.11.168.
J.H. Huang, Z.E. Tsai, G.P. Yu, Mechanical properties and corrosion resistance of
nanocrystalline ZrNxOy coatings on AISI 304 stainless steel by ion plating, Surf.
Coat. Technol. 202 (2008) 4992–5000, http://dx.doi.org/10.1016/j.surfcoat.2008.
05.001.
J.-H. Huang, T.-C. Lin, Yu G-P, Phase transition and mechanical properties of
ZrNxOy thin films on AISI 304 stainless steel, Surf. Coat. Technol. 206 (2011)
107–116, http://dx.doi.org/10.1016/j.surfcoat.2011.06.051.
J.-H. Huang, Hu Y-Y, Yu G-P, Structure evolution and mechanical properties of
ZrNxOy thin film deposited on Si by magnetron sputtering, Surf. Coat. Technol. 205
(2011) 5093–5102, http://dx.doi.org/10.1016/j.surfcoat.2011.05.015.
M. Laurikaitis, S. Burinskas, J. Dudonis, D. Milčius, Physical properties of zirconium
oxynitride films deposited by reactive magnetron sputtering, J. Phys. Conf. Ser. 100
(2008) 82051, , http://dx.doi.org/10.1088/1742-6596/100/8/082051.
S.K. Rawal, A.K. Chawla, V. Chawla, et al., Structural, optical and hydrophobic
properties of sputter deposited zirconium oxynitride films, Mater. Sci. Eng., B 172
(2010) 259–266, http://dx.doi.org/10.1016/j.mseb.2010.05.027.
S.K. Rawal, A.K. Chawla, V. Chawla, et al., Characterization of bi-phased Zr2ON2ZrO2 coatings deposited by RF magnetron sputtering, Thin Solid Films 520 (2011)
1589–1596, http://dx.doi.org/10.1016/j.tsf.2011.09.010.
S.K. Rawal, A.K. Chawla, R. Jayaganthan, R. Chandra, The influence of various
sputtering parameters on structural, wettability and optical properties of Zr2ON2
thin films, Mater. Sci. Eng., B 181 (2014) 16–23, http://dx.doi.org/10.1016/j.mseb.
2013.11.003.
S.H. Mohamed, N.M.A. Hadia, H.M. Ali, Effect of annealing on properties of decorative zirconium oxynitride thin films, Eur. Phys. J. Appl. Phys. 69 (2015) 30301, ,
http://dx.doi.org/10.1051/epjap/2015140475.
G.I. Cubillos, J.J. Olaya, M. Bethencourt, et al., Synthesis and characterization of
zirconium oxynitride ZrOxNy coatings deposited via unbalanced DC magnetron
sputtering, Mater. Chem. Phys. 141 (2013) 42–51, http://dx.doi.org/10.1016/j.
matchemphys.2013.04.012.
G.I. Cubillos, J.J. Olaya, D. Clavijo, et al., Corrosion resistance and biocompatibility
of zirconium oxynitride thin film growth by rf sputtering, Thin Solid Films 58
(2012) 328–334, http://dx.doi.org/10.1016/j.tsf.2012.06.018.
S. Venkataraj, O. Kappertz, R. Jayavel, M. Wuttig, Growth and characterization of
zirconium oxynitride films prepared by reactive direct current magnetron sputtering, J. Appl. Phys. 92 (2002) 2461–2466, http://dx.doi.org/10.1063/1.1498963.
J.M. Ngaruiya, O. Kappertz, C. Liesch, et al., Composition and formation mechanism of zirconium oxynitride films produced by reactive direct current magnetron sputtering, Phys. Status Solidi (a) 201 (2004) 967–976, http://dx.doi.org/
10.1002/pssa.200306774.
S. Venkataraj, D. Severin, S.H. Mohamed, et al., Towards understanding the superior properties of transition metal oxynitrides prepared by reactive DC magnetron
sputtering, Thin Solid Films 502 (2006) 228–234, http://dx.doi.org/10.1016/j.tsf.
2005.07.280.
M.A. Signore, A. Rizzo, L. Mirenghi, et al., Characterization of zirconium oxynitride
films obtained by radio frequency magnetron reactive sputtering, Thin Solid Films
515 (2007) 6798–6804, http://dx.doi.org/10.1016/j.tsf.2007.02.033.
A. Rizzo, M. Signore, L. Mirenghi, T. Di Luccio, Synthesis and characterization of
titanium and zirconium oxynitride coatings, Thin Solid Films 517 (2009)
5956–5964, http://dx.doi.org/10.1016/j.tsf.2009.03.131.
I.B.I. Tomsah, Ellipsometric evaluation of the optical constants of zirconium oxynitride thin films deposited by reactive pulsed magnetron sputtering, Acta Phys.
Pol. A 124 (2013) 141–145, http://dx.doi.org/10.12693/APhysPolA.124.141.
[34] M.H. Chan, Wu PL, Lu FH, Preparation of ZrNxOy films by magnetron sputtering
using air as a reactive gas, Thin Solid Films 518 (2010) 7300–7303, http://dx.doi.
org/10.1016/j.tsf.2010.04.097.
[35] G. Zhan, J. Liu, J. Guo, et al., Electrical transport property of zirconium oxynitride
thin film deposited by magnetron sputtering process, J. Mater. Sci. Mater. Electron.
26 (2015) 9188–9194, http://dx.doi.org/10.1007/s10854-015-3610-2.
[36] P. Carvalho, J.M. Chappé, L. Cunha, et al., Influence of the chemical and electronic
structure on the electrical behavior of zirconium oxynitride films, J. Appl. Phys. 103
(2008) 104907, , http://dx.doi.org/10.1063/1.2927494.
[37] S.C.C. Ferreira, E. Ariza, L.A.A. Rocha, et al., Tribocorrosion behaviour of ZrOxNy
thin films for decorative applications, Surf. Coat. Technol. 200 (2006) 6634–6639,
http://dx.doi.org/10.1016/j.surfcoat.2005.11.083.
[38] F. Macedo, P. Carvalho, L.L. Cunha, et al., The role of modulated IR radiometry
measurements in the characterization of Zr-O-N thin films, Plasma Process. Polym.
6 (2009) 760–766, http://dx.doi.org/10.1002/ppap.200931802.
[39] P. Carvalho, L. Cunha, E. Alves, et al., ZrOxNy decorative thin films prepared by the
reactive gas pulsing process, J. Phys. D. Appl. Phys. 42 (2009) 195501, , http://dx.
doi.org/10.1088/0022-3727/42/19/195501.
[40] L. Cunha, F. Vaz, C. Moura, et al., Structural evolution in ZrNxOy thin films as a
function of temperature, Surf. Coat. Technol. 200 (2006) 2917–2922, http://dx.doi.
org/10.1016/j.surfcoat.2004.09.030.
[41] P. Carvalho, a.C.C. Fernandes, L. Rebouta, et al., Compositional and structural
changes in ZrOxNy films depending on growth condition, Nucl. Instrum. Methods
Phys. Res., Sect. B 249 (2006) 458–461, http://dx.doi.org/10.1016/j.nimb.2006.
03.031.
[42] P. Carvalho, F. Vaz, L. Rebouta, et al., Structural stability of decorative ZrNxOy thin
films, Surf. Coat. Technol. 200 (2005) 748–752, http://dx.doi.org/10.1016/j.
surfcoat.2005.02.100.
[43] M.A. Signore, A. Rizzo, L. Tapfer, et al., Effect of the substrate temperature on
zirconium oxynitride thin films deposited by water vapour-nitrogen radiofrequency
magnetron sputtering, Thin Solid Films 518 (2010) 1943–1946, http://dx.doi.org/
10.1016/j.tsf.2009.07.153.
[44] A. Rizzo, M.A. Signore, L. Mirenghi, et al., Nano-crystalline Zr2ON2 thin films deposited by reactive magnetron sputtering, Surf. Coat. Technol. 204 (2010)
2019–2022, http://dx.doi.org/10.1016/j.surfcoat.2009.10.031.
[45] A. Rizzo, M.A. Signore, L. Mirenghi, et al., Physical properties evolution of sputtered zirconium oxynitride films: effects of the growth temperature, J. Phys. D.
Appl. Phys. 42 (2009) 235401, , http://dx.doi.org/10.1088/0022-3727/42/23/
235401.
[46] A. Rizzo, M.A. Signore, L. Mirenghi, et al., Sputtering deposition and characterization of zirconium nitride and oxynitride films, Thin Solid Films 520 (2012)
3532–3538, http://dx.doi.org/10.1016/j.tsf.2012.01.005.
[47] C. Pascual-Izarra, M.A. Reis, N.P. Barradas, Simultaneous PIXE and RBS data analysis using Bayesian inference with the DataFurnace code, Nucl. Inst. Methods Phys.
Res. B 249 (2006) 780–783, http://dx.doi.org/10.1016/j.nimb.2006.03.190.
[48] G.A. Klein, Industrial Color Physics, 1st ed, Springer, London, 2010.
[49] W.C. Oliver, G.M. Pharr, An improved technique for determining hardness and
elastic modulus using load and displacement sensing indentation experiments, J.
Mater. Res. 7 (1992) 1564–1583, http://dx.doi.org/10.1557/JMR.1992.1564.
[50] J. Huang, S.M. Best, W. Bonfield, T. Buckland, Development and characterization of
titanium-containing hydroxyapatite for medical applications, Acta Biomater. 6
(2010) 241–249, http://dx.doi.org/10.1016/j.actbio.2009.06.032.
[51] J.-H. Huang, Wu T-H, Yu G-P, Heat treatment induced phase separation and phase
transformation of ZrNxOy thin films deposited by ion plating, Surf. Coat. Technol.
203 (2009) 3491–3500, http://dx.doi.org/10.1016/j.surfcoat.2009.05.016.
[52] M. Lerch, F. Krumeich, R. Hock, Diffusion controlled formation of β type phases in
the system ZrO2-Zr3N4, Solid State Ionics 95 (1997) 87–93, http://dx.doi.org/10.
1016/S0167-2738(96)00549-8.
[53] A.D. Mazzoni, M.S. Conconi, Study of carbonitriding reactions of zirconia. Synthesis
of Zr(C,N,O) phases and β-type zirconium oxynitrides, Ceram. Int. 30 (2004) 23–29,
http://dx.doi.org/10.1016/S0272-8842(03)00057-9.
[54] M. Ohashi, H. Yamamoto, S. Yamanaka, M. Hattori, Preparation and properties of
zirconium oxynitrides by the reaction of zirconia with a layer structured zirconium
nitrochloride, Mater. Res. Bull. 28 (1993) 513–521.
[55] M. Lerch, O. Rahäuser, Subsolidus phase relationships in the ZrO2-rich part of the
ZrO2–Zr3N4 system, J. Mater. Sci. 32 (1997) 1357–1363, http://dx.doi.org/10.
1023/A:1018521026557.
[56] I.R. Arvinte, M. Apreutesei, D. Constantin, et al., Decorative Aspects of ZrNx Thin
Films Prepared by Reactive Magnetron Sputtering, (2010), p. 3.
[57] Y.M. Chen, B. Liao, Wu XY, et al., Synthesis and characterization of zirconium
oxynitride coatings deposited by filtered cathodic vacuum arc technology, Surf.
Coat. Technol. 228 (2013) S210–S213, http://dx.doi.org/10.1016/j.surfcoat.2012.
06.015.
[58] M. Laurikaitis, J. Dudonis, D. Milčius, Deposition of zirconium oxynitride films by
reactive cathodic arc evaporation and investigation of physical properties, Thin
Solid Films 516 (2008) 1549–1552, http://dx.doi.org/10.1016/j.tsf.2007.03.063.
[59] J. Pelleg, L.Z. Zevin, S. Lungo, Reactive sputter deposited TiN films on glass substrates, Thin Solid Films 197 (1991) 117–128.
[60] C.I. da Silva Oliveira, D.M. Martinez, A. Al-Rjoub, et al., Development of a statistical
method to help evaluating the transparency/opacity of decorative thin films,
Submitt. to, Appl. Surf. Sci. (2017), http://dx.doi.org/10.1016/j.apsusc.2017.10.
017.
8
Keep reading this paper — and 50 million others — with a free Academia account
Used by leading Academics

Wolfgang Tremel
Johannes Gutenberg-Universität Mainz

Irina Kolesnik
Moscow State University
Susan Trolier-McKinstry
Penn State University

Estela Blaisten-Barojas
George Mason University