International Journal of Social Science and Humanity, Vol. 1, No. 1, May 2011
Modelling School Bus in Favor of Needy Student: The
Conceptual Framework
Daniel Hary Prasetyo, Jamilah Muhamad , and Rosmadi Fauzi
secondary and high school student acceptance. They have
grouped the public school to several areas: center, north,
south, west, and east. Student with elementary school in one
area was suggested to continue to secondary school in that
area. They still can move to another area but with limitation
on the number. It applied equally to secondary school to high
school. The purpose of this division is to get the smooth
distribution for the school input with hope that they will
produce the proper distribution of output, and also for
reducing the traffic that crossing the city.
This research focused on the north area of Surabaya, which
has the largest number of needy students, due to the internal
limitations. All the spatial and tabular data used in this
project represent this area. This project also limited the scope
to needy student in secondary school. However, the model
developed here is not dependent on these limitations. The
model can be easily used for surveys of other areas in
Surabaya, for the needy in elementary or high school, and for
any other places in other country.
Abstract—Surabaya city is not yet have a school bus system.
With a numerous needy student, the government is realized that
free school bus can support the needy student in their
transportation cost. The purpose of this research is make a
model that can be used by the government to designs the most
optimal route and optimal distribution of the free school bus.
This paper is focusing on the conceptual framework of the
processes in finding the optimal route and analyzing the chosen
route. The optimal route is a route that covers the area with the
most number of potential passengers, the needy student. The
needy density layer is the primary data that will accompanied
with street layer, school layer, and bus depot layer. Not just
finding the route, the chosen route then used in an accessibility
analyst in order to find its effect of the school bus in existing
transportation system. The result of this research indicates that
the model in this project can be used to find the best route and
can support the government in making a decision in the
limitation they have.
Index Terms—Needy student, optimal route, coverage
analyst, load analyst, school bus.
II. LITERATURE REVIEW
I. INTRODUCTION
A school bus is a type of bus designed and manufactured
for student transport: carrying children and teenagers to and
from school and school events. School buses are
distinguished from other types of buses by design
characteristics standards that require school buses to be
painted school bus yellow and equipped with specific
warning and safety devices. The first school bus introduced
in 1827 north-east of London (UK), and was designed to
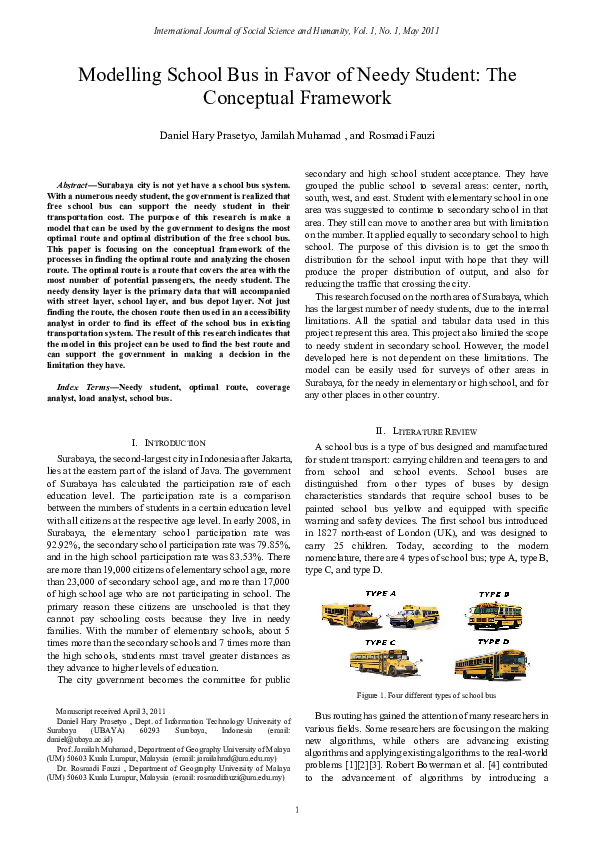
carry 25 children. Today, according to the modern
nomenclature, there are 4 types of school bus; type A, type B,
type C, and type D.
Surabaya, the second-largest city in Indonesia after Jakarta,
lies at the eastern part of the island of Java. The government
of Surabaya has calculated the participation rate of each
education level. The participation rate is a comparison
between the numbers of students in a certain education level
with all citizens at the respective age level. In early 2008, in
Surabaya, the elementary school participation rate was
92.92%, the secondary school participation rate was 79.85%,
and in the high school participation rate was 83.53%. There
are more than 19,000 citizens of elementary school age, more
than 23,000 of secondary school age, and more than 17,000
of high school age who are not participating in school. The
primary reason these citizens are unschooled is that they
cannot pay schooling costs because they live in needy
families. With the number of elementary schools, about 5
times more than the secondary schools and 7 times more than
the high schools, students must travel greater distances as
they advance to higher levels of education.
The city government becomes the committee for public
Figure 1. Four different types of school bus
Manuscript received April 3, 2011
Daniel Hary Prasetyo , Dept. of Information Technology University of
Surabaya
(UBAYA)
60293
Surabaya,
Indonesia
(email:
daniel@ubaya.ac.id)
Prof. Jamilah Muhamad , Department of Geography University of Malaya
(UM) 50603 Kuala Lumpur, Malaysia (email: jamilahmd@um.edu.my)
Dr. Rosmadi Fauzi , Department of Geography University of Malaya
(UM) 50603 Kuala Lumpur, Malaysia (email: rosmadifauzi@um.edu.my)
Bus routing has gained the attention of many researchers in
various fields. Some researchers are focusing on the making
new algorithms, while others are advancing existing
algorithms and applying existing algorithms to the real-world
problems [1][2][3]. Robert Bowerman et al. [4] contributed
to the advancement of algorithms by introducing a
1
�International Journal of Social Science and Humanity, Vol. 1, No. 1, May 2011
stops [21]. Additional stops along a route usually mean
greater access, because a stop is more likely to be within an
acceptable walking/driving standard for a larger number of
people. On the other hand, more stops and greater access
slow transit travel speeds, thereby decreasing the area of
service reachable given a travel time budget. More stops
along a route translate to greater service interruption and
longer travel times. Allan T Murray and Xiaolan Wu have
make a research about accessibility to trade off these two
sides [22]
This project concerns an urban area and multiple schools,
and does not focus on the advancing route algorithm.
Considering its illustrious effectiveness in the presentation of
routing problems, this project used GIS and its applications
as the primary tools. The recent Djikstra algorithm adopted in
ArcGIS 9.3 is using for vehicle routing problem (VRP)
analysis. This study focuses on the process of providing
appropriate data and settings used for the VRP process, and it
provides analysis after the generated routes. In this study, the
data processing and analysis uses one essential parameter:
distance. Distance, as used here, refers to the maximum
acceptable distance for a needy student to traverse to arrive at
the bus line from their home and or school. Because the study
area is a tropical zone, and the objects are not adults but
children in their early teens, this project decreased the
distance from value of 400 m, as used in most research, to
300 m.
multi-objective approach to modeling the urban school bus
routing problem. They developed a heuristic algorithm and
tested it with data from a sample school board location in
Wellington County, Ontario, Canada. They defined several
optimization criteria to evaluate the desirability of a set of
school bus routes.
Several studies have reviewed school bus routing
methodologies [5][6][7]. Based on the number of schools,
bus routing can be divided into the many-to-one and
many-to-several methodologies [8]. An example of
many-to-one can be viewed in the work of M. Fatih Demiral
et al. [9] and Nayati Mohammed [10]. Both used one school
location as a depot and a student home location for the
customer location to generate bus routes. These authors
worked with study areas in Isparta, Turkey, and Hyderabad,
India, respectively. Other authors are Li and Fu [11]. Li and
Fu implemented a heuristic algorithm for the existing data of
a kindergarten in Hongkong, whereas Bektas et al. used
integer programming for an elementary school in central
Ankara, Turkey. These authors saved 29% and 26%,
respectively, for their newly generated routes compared to
the then current implementations. Based on the location or
environment of the data, bus routing can be divided into
urban [12][13] and rural areas [14]. The many-to-one method
of Bektas et al. and Li and Fu can be a good example of
applications for urban areas. For rural areas, Armin
Fu¨genschuh [15] took five counties in Germany as the
student locations. Another work focusing on rural areas is
using rural school data in Savigny and Forel, Switzerland
[16]. These two rural areas find buses routes for multiple
schools.
Accessibility is from word accessible, which from oxford
dictionary means able to reach or entered. Accessibility is
concerned with the opportunity that an individual at a given
location possesses to participate in a particular activity or set
of activities. Basically accessibility represents the ease with
which activities may be reached from a given location by
means of a particular transportation system [17]. An
accessibility measure is usually formulated in terms of a set
of destinations representing activity sites and a set of origins
representing potential users of the facilities at the activity
sites. Individual destinations may be weighted by their
attractiveness. For a shopping centre, its attractiveness can be
measured by a combination of factors such as floor space and
parking space, which might affect customer’s interest in it. In
the case of a school, its attractiveness may be measured in
terms of the maximum number of pupils and the range and
quality of school services provided.
Accessibility also has a portion in the public transport and
it’s stopped points. Jennifer Rogalsy has calculated the
service of existing public transport for the working poor in
Knoxville, Tennessee, USA [18]. Talat Munshi and Mark
Brussel have discovered accessibility of public transport in
the different income rate and work activity in Ahmedabad
city India [19]. Sankar et al using the GIS to optimizing
accessibility and placing bus stops. While accessibility can
be calculated in various ways, the gravity-based measure of
accessibility is the most widely used measure in planning
studies [20]. Thomas J Kimpel et al using this gravity based
measure for calculating overlapping service at existing bus
III. CONCEPTUAL FRAMEWORK
The key of the process in finding a route for this free
school bus is how to find one optimal route with a coverage
area that have the most number of needy. Coverage area is
the area surrounding the route. Needy in this area will need to
calculate to get the total number of needy. It will need a
needy layer, a layer that represents needy number in a
specific area distribution. In order to keep the process easy to
follow, this explanation uses simple example map layer. In
the example needy area layer, there are 5x3 square district
areas. Each district has a number of needy. The number of
needy is represented in little squares in the district square.
There are 3 different colors in the little squares. Let say the
darkest color represents 3 needy students, lighter color
represents 2 needy students, and the lighter color represents 1
needy student.
The other layer need to provide is street layer, school layer,
and bus depot layer. Street layer is represented in red line.
School layer is represented in green square (green point). Bus
depot layer is represented in blue square (blue point). The
school layer has a specific capacity of student. The street
layer is segmented with the end of each segment is the
junctions. Each segment has its own drive time value.
The school bus is used by the needy student to take them to
the school. However, students who live around their school is
not necessary to ride the bus. This situation will decrease the
number of the bus to be provided. So, we need to calculate
how many needy surrounding the schools and decreasing the
number of needy in those areas. A specific distance is need to
set and a specific percentage of needy whose school is around
need to be determined. The output of this process will make
2
�International Journal of Social Science and Humanity, Vol. 1, No. 1, May 2011
continues to explore that route. The first exploration is to find
out the characteristic of the passenger load along the journey
of the bus. The coverage needy layer from the previous
section is used for calculation. This layer needs to be
segmented in a certain distance. In each segment will be
calculated the number of potential entry and exit of the
passengers. The number of entry passenger is calculated from
the total number of needy in the segment. The number of exit
passenger is determined with the number of student capacity
in the school in the segment. If there is no school in the
segment, this exit number is set to 0. In order to make simple
this example calculation, all schools is set to have the same
number of; 150 seats. With these entry and exit number, the
load of passenger will be predicted.
The bus is doing its journey in counter clock wise, so the
bus will going to the east then make two weaves, go to the
north, back to the west and ending with going to the south. In
every visited segment the load of passenger is counted. The
load of passenger value is added with the entry number and
subtracted with the exit number. If the load of passenger is
less than the exit number, the load will set to 0 and the
segment is marked for use in the reverse route. The entry
point is rounded for simplifying.
two changes: the first is, the capacity of the school will be
reduced because some seats have been filled in by the
surrounding needy student, and the second, because the
number of needy in the needy area around the schools is
diminished, the needy area will be reshaped.
Figure 2. Needy area, street, schools, and bus depot(example)
In the route finding process, start and end place of the
school bus have to be determined. In this example, the one
and only bus depot which symbolized in blue point is act as
start depot and also end depot. The school bus is starting the
journey at start depot, visiting all school locations, and
ending the journey at end depot. In this example case, the
route will looks like a loop. By provided a certain algorithm,
with an input are street network, school locations, and bus
depot location, the process will generate an output in form of
new polyline type layer. The routing process is done in
several times in different setting. Along with the polyline
type layer, the output also provided with drive consumed
time. Consumed time is how long the bus begins until ends
the journey. The value is taken from summing all the drive
time in all passed road segments and adding with the visiting
time of the bus in the school location and in every bus stop.
Since this research is for a free school bus, which the main
objective is to service as much as needy students, the length
of the route is omitted. The consumed time is also not the
primary factor in choosing the route. As long as the time
range is in an acceptable range, the candidate route will not
be eliminated.
Next process is calculating the number of needy that
covered by the route. It will need a certain distance value
which represents the maximum acceptable walking distance
of needy student for going from their home to the closest
route. The process need to make a surrounding area along the
route, which in GIS familiarly called as Buffer. After
buffering process, there will be an area in the form of
polygon layer type. This polygon then will be used to get the
needy area in the region inside it. In GIS this called Clipping.
The clip process is like cookie dough and a mold. In this case,
the cookie dough is the needy area, and the mold is the
polygon surrounding the route. Let’s call the output as
coverage needy layer. Figure 3 shows the result of the
coverage needy layer of the example route.
Figure 4. The calculation of passenger load in main route (example)
Figure 4 shows the calculation process. The first segment
have 20 entry value and 0 exit value and also with the second
and third segment. In the forth segment there is an exit value
150. The passenger load in the second and third segment is 40
and 60 respectively. In the fourth segment the total passenger
load is 0 because there is a school in there. The school
capacity, also known as the exit value, is 70 seats more than
the passenger, therefore in this fourth segment the passenger
load is set back to 0, and the segment is marked. In the above
figure, this segment is marked with green color and. the
unused seats value is kept for the calculation in reserve route.
The calculation in the next segments is in similar way. There
are no unused seats in the next four schools in the journey. In
those locations the passenger load is more than the school
capacity. A little unused seat is generated in the fifth school,
and the segment is colored with green again. After the last
school, the sixth school, the segment is colored with purple
for marking that in this segment the passenger can not any
school by this main route. For servicing the passenger in
these segments the reserve route is needed to conduct.
Figure 3. The result in finding coverage needy (example)
Once the optimal route was founded, this research
3
�International Journal of Social Science and Humanity, Vol. 1, No. 1, May 2011
Figure 6. The accessibility level before and after buses added (example)
Figure 5. The calculation of passenger load in reserve route (example)
IV. STUDY AREA
The reserve route needs an initial value of entry and exit
passenger. The entry value is taken from the undelivered
needy student, which in the previous figure is from the
segments marked in purple color. The exit value is taken
from the unused seat, which in the previous figure is from the
segments marked in green color. There are 2 school locations
in this reserve route with capacity 20 and 70. The reserve
route is running in clock wise with the similar calculation
way. So the potential passenger is located in the beginning of
the journey. There are 20, 20, 20, and 30 values in the first to
fourth segment respectively. In the fourth segment there is an
exit value but less then the passenger load which as much as
20. The rest passenger load, as much as 70, is delivered until
the last school which still has a capacity. Figure 5 shows this
calculation.
The maximum number of passenger in the main route is
250, while in the reverse route is 70. These number can used
for calculating how many number of buses need to be
provided. If the bus capacity if 50 seats, the number of buses
have to provide for the main route is 5 buses and the reverse
is 2 buses. The number of busses then will be used in the
second analysis, the accessibility analyst. The purpose of
accessibility analyst is to discover the improvement of
accessibility level in the study area after a set of new school
buses was added in the existing transportation system.
Therefore, this part will need an existing transport
characteristic map.
The accessibility of existing transport system has to be
made. The accessibility layer is made from buffer process
like in the process in finding coverage area. The different is,
in this surrounding area, the value of the buffer is set from the
number of available seats in the transport media. In this
example, the existing route in the east side has more available
seats then the west one. Therefore the accessibility level of
the right route is higher and represented in darker color. The
transportation system then added with a set of bus schools.
This additional process then followed with recalculating the
accessibility level of all route. The existing accessibility layer
is added with accessibility of the bus route. Since this is an
adding process, a street which has many transportation routes
along it, will have a high accessibility level. Figure 6 shows
the example of new accessibility map. In this example map
there is four different accessibility levels. The darker color
raise in the area shared street of east existing route and the
bus route.
Several collected data use in this research. There is region
map, school location, bus depot location, street map, needy
citizen database, and the existing transport system map.
The Surabaya city government only has a map with
sub-district detail. Consequently, a survey for mapping the
sub-sub-district boundary of the project’s study area had to
be conducted. The total number of sub-sub-districts in this
study area is 274.
There are 57 schools in this study area consist of 8 public
schools and 49 private schools. Public schools are schools
owned by the government. These schools serve both
purposes because they commonly have appropriate buildings
and surrounding areas. Most importantly, the government has
a right to manage these areas. So they can act not only as
places for delivering and picking up students but also as bus
depots. Completing the actual two bus depot reside in the
center and west area.
There are Highway Street, Primary Street, Secondary
Street, and Tertiary Street in this study area. This research
uses Primary and Secondary Street. Highway Street is
eliminated because it cannot use for picking up passengers.
Some of Tertiary Street that can be passed by bus is also
included. This map also has to be equipped with “drivetime”
field.
The specification of poor is different in every country. In
Indonesia, needy specification is formulated by Centre of
Statistical Bureau.
TABLE 1 NEEDY FAMILY CRITERIA
NO
1
Variable
Floor area per family member
2
Type of the floor of the house
3
Type of the wall of the house
4
Toilet facilities
5
Drinking water source
6
Lighting source
Not from government
water supply or not a
good water
Non-electric
7
Fuel used
wood or charcoal
8
Frequency of Meals in One Day
2 times or less
9
Ability to buy Meat, Chicken, Fish,
Eggs, and Milk in a week
The ability get a treatment in the
hospital / clinic
Education level of the householder
Have no ability
10
11
4
Indication
Less than 8 m2 per family
member
Most of the part is sand
or cement
Most of the part is
bamboo or low quality
plywood
Have no private toilet
Have no ability
never schooling or not
passing the elementary
�International Journal of Social Science and Humanity, Vol. 1, No. 1, May 2011
12
13
14
The ability to buy new clothes for
every family member
The occupation of the householder
Ownership of assets or goods worth
USD 50
One or less per year
The load analyst result can predict the passengers load in
each route. With this prediction, the government can make a
decision of how many buses that needs to be provided. Say,
the bus can carry about 70 needy (50 sitting and 20 standing).
The west route will need 9 buses in the main direction and 4
buses for the inverse. The east route needs just for main
direction, 11 buses. The north route needs more inverse than
the others. The main direction needs 7 buses and for the
inverse needs 4 buses. The south route has to provide the
most fleets in the main direction. It needs 16 fleets.
The existing accessibility level and the new one used to
subtract the needy area to make an uncovered needy map.
There is 4523 needy student who uncovered by the existing
transportation system. After added with the bus schools, the
uncovered needy decreased to 1341 needy. Figure 8 shows
the accessibility level of existing transportation system and
the new transportation system after the bus school was added.
Farmers, Fishermen,
Daily Labor, or other
with incomes below USD
60 /month
Does not have
The Surabaya city government has collected needy citizen
data. In 2007, 550,783 people of the 119,219 families
registered lived below the poverty line. This needy people
survey recorded name, birthplace, birthday, address, sex, and
occupation.
Figure 7. The basic map.
Street map and previous maps called basic map. Figure 7
shows this map. Street map is shown in red line, school map
in green dot, public school in blue rectangle, and bus depot in
blue dot. The needy area symbolized in the gradation color of
sub-sub-district area. Area with darker color mean has more
number of needy students than the lighter ones.
In Surabaya, there are several transportation systems that
can be used, including taxi, lyn, and bus. Lyn is modified
station wagon with long seats patched at the left and right
sides. Buses in Surabaya are like typical buses in other cities,
having a capacity of about 50 passengers. The lyn’s capacity
is about 10 passengers. There are numerous routes covering
Surabaya, but in the north region, there are only 13 lyns and 2
buses. There is no documentation of how many fleets there
are and when they pass through the region. A survey in a
certain time window was conducted.
Figure 8. Accessibility map before and after added with school bus.
VI. CONCLUSION
With the conceptual framework in this paper, the optimal
route can be chosen. This research has proposed the most
minimum traveling time bus school routes, cover the most
number of needy students, and divide the area in favorable
distribution. With the load analyze method; this project can
predict how many buses need to provide to covers all orders
completely. Even, In this case study, the numbers of buses to
be provided may be a great number for the government, the
government still can use this calculation number for a
reference to distribute their limited number of buses wisely.
V. THE RESULT
The output of this research is an optimal route and the
characteristic of it. After the optimal route is chosen, the load
analyst will produce the changes of passenger time to time
while travel from center depot to each direction. This load
will be shown in 3D in order to make it easy to understand.
Figure 8 shows each passenger load in 3D visualization.
REFERENCES
[1]
[2]
[3]
Figure 8. The 3D view of passengers load
5
Dorronsoro Díaz. 2007. The VRP Web. Languages and Computation
Sciences
department
of
the
University
of
Málaga.
http://neo.lcc.uma.es/radi-aeb/WebVRP.
P. Toth and D. Vigo, editors.2002. The Vehicle Routing Problem.
Monographs on Discrete Mathematics and Applications. SIAM,
Philadelphia,PA.
Bruce Golden, S. Raghavan, and Edward Wasil. 2008 The Vehicle
Routing Problem: Latest Advances and New Challenges. Springer
Science+Business Media, LLC 2008.
�International Journal of Social Science and Humanity, Vol. 1, No. 1, May 2011
[4]
Robert Bowerman, Brent Hall, and Paul Calamai. 1995. A
Multi-Objective Optimization Approach to Urban School Bus Routing
Formulation and Solution Method. Elsevier Science Transportation
Research Part A: Policy and Practice Volume 29, Issue 2, March 1995,
Pages 107-123.
[5] Junhyuk Park, Byung-In Kim. 2009. The school bus routing problem:
A review. Elsevier European Journal of Operational Research 202
(2010) 311–319.
[6] Burak Eksioglu, Arif Volkan Vural, Arnold Reisman.2009. The vehicle
routing problem: A taxonomic review . Computers & Industrial
Engineering 57 (2009) 1472–1483
[7] Schittekat, P., Sevaux, M., Sörensen, K., 2006. A Mathematical
formulation for a school bus routing problem. Proceedings of the IEEE
2006 International Conference on Service Systems and Service
Management, Troyes, France
[8] Robert A. Russell, Reece B. Morrel, Bob Haddox. 1986. Routing
Special-Education School Buses. Interfaces, Vol. 16, No. 5 (Sep. - Oct.,
1986), pp. 56-64
[9] M.Fatih Demiral, Ibrahim Gungor, Kenan Oguzhan Oruc. 2008.
Optimization at Service Vehicle Routing and A Case Study of Isparta,
Turkey.First Inernational Conference on Management and Economic
(ICME 2008) Tirana, Albania 2
[10] Nayati Mohammed Abdul Khadir. 2008. School Bus Routing and
Scheduling usng GIS. Master thesis in Geomatics, University of Gavle.
[11] L. Y. O. Li and Z. Fu. 2002. The School Bus Routing Problem: A Case
Study. The Journal of the Operational Research Society, Vol. 53, No. 5
(May, 2002), pp. 552-558
[12] Lazar Spasovic, Steven Chien, Cecilia Kelnhofer-Feeley, Ya Wang,
and Qiang Hu. 2001. A Methodology for Evaluating of School Bus
Routing - A Case Study of Riverdale, New Jersey. Transportation
Research Board 80th Annual Meeting January 7-11, 2001. Washington,
D.C.
[13] Braca, J., Bramel, J., Poser, B. and Simchi-Levi. A. 1994.
Computerized Approach to The New York City School Bus Routing
Problem. Technical report, Graduate School of Business, Columbia
University, NY.
[14] Chen, D., Kallsen, H.A., Chen, H., Tseng, V. 1990, Bus routing system
for rural school districts. Computers and Industrial Engineering 19,
322–325..
[15] Armin Fu¨genschuh,2009. Solving a school bus scheduling problem
with integer programming. European Journal of Operational Research
193 (2009) 867–884.
[16] Spada, M., Bierlaire, M., Liebling, Th.M.2005. Decision-aiding
methodology for the school bus routing and scheduling problem.
Transportation Science 39, 477–490.
[17] Xuan Zhu , Suxia Liu 2004. Analysis of the impact of the MRT system
on accessibility in Singapore using an integrated GIS tool. Journal of
Transport Geography 12 (2004) 89–101.
[18] Jennifer Rogalsky 2009. The working poor and what GIS reveals about
the possibilities of public transit. Journal of Transport Geography.
[19] Munshi T, Brussel M (2005). Use of Geo-information to determine
work place accessibility using public transport in Ahmedabad City,
India .Computers in Urban Planning and Urban Management
(CUPUM), 2005 conference, UCL, London
[20] Handy S L, Niemeier D A, 1997. Measuring accessibility: an
exploration of issues and alternatives. Environment and Planning A
29(7) 1175 – 1194
[21] T. J. Kimpel, K. J. Dueker, and A. M. El-Geneidy, "Using GIS to.
Measure the Effect of Overlapping Service Areas on Passenger.
Boardings at Bus Stops," URISA Journal, vol. 19, pp. 5-11, 2007.
[22] Murray, Alan T.; Wu, Xiaolan. Accessibility tradeoffs in public transit
planning. Journal of Geographical Systems, Volume 5, Issue 1, pp.
93-107 (2003).
6
�
 Rosmadi Fauzi