Preventive Medicine 28, 349–360 (1999)
Article ID pmed.1998.0429, available online at http://www.idealibrary.com on
Stage of Regular Exercise and Health-Related Quality of Life1
Robert G. Laforge, Sc.D.,*,2 Joseph S. Rossi, Ph.D.,* James O. Prochaska, Ph.D.,* Wayne F. Velicer, Ph.D.,*
Deborah A. Levesque, Ph.D.,* and Colleen A. McHorney, Ph.D.†
*University of Rhode Island, Kingston, Rhode Island; and †Department of Preventive Medicine,
University of Wisconsin–Madison Medical School, Madison, Wisconsin
Background. Research on cognitive factors and motivational readiness for exercise is important for increasing our understanding of behavior change among
those with sedentary lifestyles. This study examines
stage of change for regular exercise and self-perceived
quality of life.
Methods. Data are from 1,387 respondents to a random digit dial survey of health behaviors. Stage of
change is assessed with a single item, and individuals
are classified with respect to intention and exercise
behavior. Quality of life is assessed with the SF-36, a
multidimensional measure of health-related quality
of life.
Results. Exercise stage is associated with self-perceived quality of life. The three areas most strongly
related were physical functioning, general health perceptions, and vitality. Physical functioning scores were
lowest in precontemplation and highest in maintenance. Vitality and mental health scales were related
to exercise behavior, but not to intention.
Conclusions. Cognitions about self-perceived quality
of life vary across the stages of change, with those who
are least prepared to adopt regular exercise reporting
the lowest levels of quality of life. These findings suggest that cognitive–motivational messages designed to
emphasize quality of life benefits associated with exercise may be useful intervention strategies for people
who are less motivationally ready to change. q1999
American Health Foundation and Academic Press
Key Words: exercise; stage of change; quality of life;
health surveys.
INTRODUCTION
There is a substantial literature indicating that physical activity and regular exercise can lead to improvements in quality of life along a broad range of physical
1
Supported in part by funds from the National Cancer Institute,
Grants R01 CA28721 and P01 CA50087.
2
To whom correspondence and reprint requests should be
addressed at, Cancer Prevention Research Center, University of
and psychological dimensions [1,2]. Cross-sectional and
longitudinal studies have found that increasing
amounts of physical activity are associated with decreased overall mortality and better health and functioning [1,3], including a reduction in symptoms of coronary heart disease [4], cancer [5], osteoporosis [6],
diabetes [7], anxiety [3], and depression [3]. However,
millions of Americans do not engage in regular physical
activity [8]. National public health objectives for the
year 2000 include increasing the frequency and duration of light, moderate, and vigorous physical activity
[9], and major initiatives are underway to promote exercise adoption and adherence in the general population
[10]. Theoretical models that focus on cognitive and
behavioral determinants of behavior change—such as
self-efficacy [11], stages of change [12], decision making
[13], and intention [14]—are increasingly being used
to aid development of interventions designed to promote
regular exercise [15–18].
An important intervention strategy of cognitive–
behavioral models is to attempt to modify self-perceptions, attitudes, and intentions, which have been found
to be determinants of exercise behavior [1,2]. For example, cognitive interventions that increase the awareness
of health risks associated with sedentary lifestyles can
enhance motivation to exercise [19]. Exercise interventions that classify populations by stage of motivational
readiness for change can provide targeted cognitive
messages appropriate to each individual’s stage of
readiness to change [15,20]. This line of research goes
beyond the simple distinction between physically active
and sedentary individuals and attempts to understand
the determinants of motivational readiness along an
underlying continuum of stages of change, spanning
from precontemplation (not intending to change) to
maintenance (sustained regular exercise or physical activity over time). Stage-matched interventions have
Rhode Island, 2 Chafee Road, Kingston, RI 02881. Fax: (401) 8745562. E-mail: WAA101@URIACC.URI.EDU.
349
0091-7435/99 $30.00
Copyright q 1999 by American Health Foundation and Academic Press
All rights of reproduction in any form reserved.
�350
LAFORGE ET AL.
been shown to effectively increase physical activity
adoption in a nonrandomized community setting [17]
and in a recent randomized clinical trial [21].
Understanding how cognitions vary at different
stages of change can provide the basis for continued
progress in the development of stage-matched intervention strategies [22]. In this regard, related concepts
from different theoretical models are increasingly being
combined in an effort to better explain exercise acquisition and adherence [20–22]. Research into how stages
of change for exercise is related to specific cognitions—
such as perceived social pressure, intention, attitudes,
decisional balance, self-efficacy, processes of change,
perceived control, and perceived severity of the consequences of inactivity—has provided many new insights
into how exercise promotion interventions using the
stage of change construct can be made more effective
[16,18,19,21–23]. Since modification of self-perception
of the benefits of regular exercise is an important motivational strategy used in many exercise promotion interventions, it is meaningful to study whether, or to
what degree, self-perception of quality of life varies
across stage of change.
This study extends the research literature on exercise
behavior and quality of life by examining the relationship between motivational readiness and self-perceived
health-related quality of life. Health-related quality of
life is a multidimensional construct that represents a
person’s overall satisfaction with life, and its assessment typically involves measures of functional status
in the domains of physical, cognitive, emotional, and
social health [24,25]. A better understanding of how
the behavioral and intentional components of the stage
construct are related to the various dimensions of
health-related quality of life may be useful for evaluating existing stage-based intervention programs, as well
as for its potential for providing new strategies for more
effective matching of individual needs with exercise
interventions.
In sum, researchers have begun to consider classification by stage of motivational readiness as a meaningful
method of differentiating sedentary and active populations. Although there is evidence that physical activity
can have a positive influence on different dimensions
of health-related quality of life [26,27], there have been
few studies that have used the multidimensional measurement approach [1,2]. This study is unique because
it examines the relationship between stage of readiness
to exercise and an established multidimensional measure of self-perceived quality of life (the SF-36) with
data from a large general population sample. Further
it explores how cognitions concerning self-perceived
health-related quality of life are associated with stage
of change for regular exercise, and these results are
considered in the context of the growing literature on
cognitive processes involved in exercise behavior that
have been found to be related to stage of change.
METHODS
Sample
The study sample consisted of 1,387 respondents ages
18–75 to a random digit dial telephone survey conducted in Rhode Island in 1992. The next-birthday
method of sample selection within a household was used
to minimize respondent bias [28]. The survey was administered over the phone by interviewers trained in
standardized interviewing techniques [29], and the survey procedures were approved by a University Institutional Review Board. The household response rate
was 75.1%.
MEASURES
Stage of Change for Exercise
Stage of change for exercise behavior is a theoretical
construct that combines self-reported intention and behaviors to allow classification of populations with respect to readiness for behavioral change. Stage of
change is the temporal dimension of a more general
theoretical model, the Transtheoretical model [20]. This
model also includes other constructs, such as the processes of change, decisional balance, and self-efficacy,
that describe how human behavior changes. Assessment of stage of readiness to engage in, or adopt, regular
exercise offers a profile of the population with respect
to the degree of intention or current adherence to a
regime of regular physical exercise.
Measurement of the stage of change construct for
exercise has been generally found to be valid and robust
across various methods of assessment using different
item and response formats [30]. These include a “ladder” format with descriptive anchors [31], a 6-item true/
false response format [32], a 32-item descriptive statement scale [33], an algorithm for each stage that uses a
5-choice Likert response format [34], a 1-item algorithm
with 5 distinct response choices, [22,30], and other approaches that vary in the theoretical consistency of
their stage definitions [35,36]. Because of its simplicity
for use in survey research, we used the 1-item algorithm
with 5 distinct response choices. This was the recommended format reported in a recent comparison of several staging methods [30].
In this study, stage of change for regular exercise was
assessed with a single item with five mutually exclusive
response categories. The question stated “Do you consistently get regular exercise, that is, 3 times a week, for
20 minutes each time?” The quantity and frequency of
exercise are based on recommendations developed by
the American College of Sports Medicine [37]. Respondents were required to select the category that best
�STAGE OF EXERCISE AND QUALITY OF LIFE
described their current condition, and the five response
categories were used to classify stage of change. The
response categories are (1) “Yes, and I have been doing
so for more than 6 months” (maintenance); (2) “Yes, but
I have been doing so for less than 6 months” (action);
(3) “No, but I intend to in the next 30 days” (preparation); (4) “No, but I intend to in the next 6 months”
(contemplation); and (5) “No, and I don’t intend to in
the next 6 months” (precontemplation). This short fivechoice staging algorithm has been found to reliably assess stage of regular exercise in several large population
studies [30,38,39]. It is an adaptation of the original
stages of change measure developed for smoking cessation [12]. This exercise staging approach does not provide differentiation by degree of exercise intensity—
e.g., vigorous or moderate—nor does it provide
examples such as running, swimming, and so forth, to
indicate intensity level. Rather, it reflects an increasing
degree of immediacy of intention to engage in the target
criterion of exercise across the first three stages (precontemplation to preparation), and increasing duration
of time engaged in the target behavior—consistent regular exercise at least 3 times a week for 20 minutes
each time—across the last two stages (action and
maintenance).
This algorithm differs slightly in its definition of the
preparation stage from the short-item exercise stage
algorithms employed in some other research based on
the Transtheoretical model, where the preparation
stage is indicated by an item that reflects making small
behavioral changes [22,34]. In our stage algorithm the
preparation stage does not explicitly require that small
behavioral changes have been made, but rather represents more proximal intention to engage in the target
behavior (“in the next 30 days”). It is likely, however,
that increasing intention to engage in consistent regular exercise at the criterion level also involves engaging
in physical activity, but at subcriterion levels. The similarity in the stage distributions found using this algorithm [30,38,39] compared with brief exercise stage algorithms reported in other studies [22,30,34] suggests
that the stage construct is robust, and the differences
in the preparation stage estimates are relatively minor.
Brief instruments can be reliable and valid indicators
of exercise stage [22,30] and exercise behavior [40] and
are particularly important for use in complex epidemiological studies, which often require long questionnaires
and respondent burden to be minimized. Although exercise stage has been assessed using a variety of different
methods [30,31,35,34], there is consistent evidence of
construct validity across various populations, with the
stages found to be associated with increasing amounts
of physical activity [22,30–32,34,41,42]. For example,
Cardinal [41] reported that exercise behavior, body
mass index, and cardiorespiratory fitness increased
351
from precontemplation to maintenance, after controlling for demographics and social desirability. Acceptably high levels of test–retest reliability (k $ 0.78) have
been reported for the simple stage measures [22,34].
A recent comparison of several methods of assessing
exercise stage found that the single-item exercise stage
algorithm used in this study outperformed other staging algorithms in predicting hours of exercise performed, a decisional balance score for exercise, and a
measure of confidence (self-efficacy) in the ability to
exercise [30].
Quality of Life Assessment—The Medical Outcome
Study (MOS) SF-36
Over the past 2 decades, there have been considerable
advances in the measurement of health-related quality
of life for both general and clinically ill populations.
The short-form 36-item (SF-36) is a recent addition to a
host of generic measures [25,43]. The SF-36 instrument
was designed to provide a valid measure of health functioning that is easy to use in surveys of large populations. It has been developed for self-administration by
persons 14 years or older and for administration over
the telephone. The SF-36 was constructed for use in
monitoring the MOS, a longitudinal study of health
outcomes among the chronically ill, but it has been
widely adopted by researchers conducting studies of
clinical and nonclinical populations [43]. For example,
it has been used in studies of health services, methodology, clinical trials [43,44], chronic conditions in the general population [45], and treatment outcome studies
across a variety of health conditions [43,44]. Ware and
colleagues reported in 1994 that the measurement
model of the SF-36 had been validated in 62 crosssectional studies and 27 longitudinal studies [43]. The
SF-36 is here employed to provide a comparison of
health-related quality of life of a general population
sample of adults across each of the five stages of exercise adoption.
The SF-36 taps both physical and mental health aspects of quality of life by using the respondents’ perspective on their health and functional status. Factor analytic studies of the SF-36 have found eight distinct
physical and mental health dimensions in patients participating in the MOS [46] as well as in the general
U.S. population [47]. Ware et al. [43] have shown that
from 80 to 85% of the reliable variance in the eight
scales is accounted for by two hierarchical components,
a physical component scale (PCS) and a mental health
component scale (MCS).
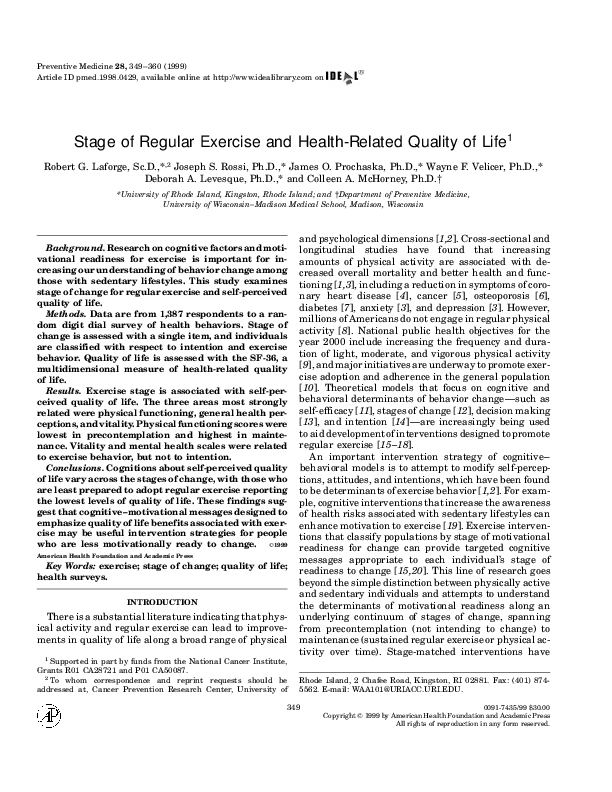
The item content of the eight separate scales and
their corresponding PCS and MCS hierarchical components are displayed in Fig. 1. The separate scales assess
physical functioning (PF), role functioning due to limitations in physical problems (RP), bodily pain (BP), general health perceptions (GH), general mental health
�352
LAFORGE ET AL.
FIG. 1. SF-36 measurement model. Adapted from Ref. [43].
(MH), vitality (VT), role limitations due to emotional
problems (RE), and social functioning (SF). One final
SF-36 item asks respondents to rate the amount of
change in their health status over the past year, but it
is not used to score any of the eight scales and is not
reported on here. The response choices for most items
are Likert scales. Items that assess problems in role
functioning due to either physical health or emotional
problems are dichotomous (yes/no) responses [25]. The
SF-36 scales were scored using the standard SF-36 scoring algorithms to allow comparison across the eight
dimensions [47]. The eight scale scores range from
0 to 100, with 100 representing optimal health and
functioning.
In contrast, scoring for the PCS and MCS summary
measures used the norm-based scoring methods recommended by Ware and colleagues, who provide extensive
evidence of the validity and reliability of the PCS and
MCS, as well as a valuable discussion of the usefulness
of the SF-36 measurement model [43]. One beneficial
feature of using the PCS and MCS is that they have a
direct interpretation in relation to the distribution of
scores in the general U.S. population, which are defined
to have a mean of 50 and a standard deviation of 10.
�STAGE OF EXERCISE AND QUALITY OF LIFE
For example, a score of 55 on the PCS indicates that
the study group has better physical health functioning
than the general U.S. population and that the difference
in the PCS score obtained represents a medium effect
size of 0.5 standard deviation [48].
Procedure and Analysis
Adult respondents to a random digit dial telephone
survey were administered a questionnaire that assessed stage of change for several health behaviors,
demographics, and the SF-36. Bivariate analyses involved t tests and one-way ANOVA comparisons of
scores on the SF-36 subscales. One-way MANOVA was
performed on the SF-36 scales with and without statistical adjustment for age, gender, and years of education.
Mean scores on the eight quality of life scales and the
two component summary measures are presented
across five categories of exercise stage and for age, gender, and education. Post hoc analyses of ANOVA results
used the Tukey HSD procedure for adjustment for multiple comparisons. P values for differences across stages
are reported, but the Bonferoni adjustment for multiple
comparisons across the eight scales should be assumed,
resulting in the univariate criterion for statistical significance of P 5 0.006. The (v 2 estimate of the standardized effect size is presented as a measure of the strength
of association between exercise stage and the SF-36
components and scales. It represents the proportion of
the variance in the SF-36 explained by exercise stage.
RESULTS
Table 1 presents sample characteristics for age, gender, education, and exercise stage. The results for age
TABLE 1
Selected Sample Characteristics
Age
LT 30
30–40
41–55
GT 55
Gender
Male
Female
Education
LT high school
High school
College
Graduate school
Exercise stage
Precontemplation
Contemplation
Preparation
Action
Maintenance
N
%
381
347
318
337
27.5
25.1
23.0
24.4
515
870
37.0
62.5
187
484
554
158
13.5
35.0
40.1
11.4
250
164
287
82
604
18.0
11.8
20.7
5.9
43.5
353
and education are comparable to the 1990 U.S. Census
statistics for the state of Rhode Island [49], suggesting
the sample is fairly representative on these characteristics. The sample overrepresents females, but contains
a sufficiently large sample of males to make stable estimates of relationships between variables. Nevertheless, gender was not found to be predictive of quality
of life and therefore posed little threat to external validity of this sample.
The distribution for exercise stage found in this sample is similar to that found in five other surveys conducted in the United States and Australia that used
the identical stage item [39], including a sample of approximately 19,000 HMO members [30,38]. Over half
of the sample did not report consistent regular exercise,
with 18% reporting no intention to consistently engage
in regular exercise (the precontemplation stage) in the
next 6 months, 12% intending to begin in the next 6
months (contemplation stage), and 21% reporting that
they were intending to begin regular exercise in the
next 30 days (the preparation stage). Six percent reported consistent regular exercise for less than 6
months (action), and 44% of the sample declared that
they have consistently engaged in regular exercise for
more than 6 months (maintenance).
As expected, scores on the SF-36 indicate that the
Rhode Island general population sample was functioning at the high end of the health-related quality of life
scales (Table 2). Scores on the SF-36 scales were generally in the high-functioning range, with 100 indicating
optimal functional health status. All eight scales were
found to have good to excellent internal reliability, as
measured by Cronbach’s a. There was little evidence of
floor effects in this sample, but several scales (PF, RP,
BP, RE, and SF) exhibited significant ceiling effects,
that is, had a high percentage of respondents who
scored at the highest end of the scoring range. The
results reported in Table 2 are remarkably similar to
those recently reported for another general population
survey using the SF-36, which was also conducted using
telephone interviewing [50].
Table 3 presents the SF-36 scores and summary measures for the total population and bivariate tests of
association with age, gender, and years of education.
The sample population norms for total SF-36 scale
scores were very similar to those published for the general U.S. population [43]. Overall the sample scored
highest on the PF scale (M 5 85.8) and lowest on the
VT scale (M 5 63.5). Likewise, the PCS and MCS indicate that the scores for our Rhode Island sample were
quite similar to that of the general U.S. population,
differing by less than one-tenth of a standard deviation.
The slightly higher scores in the Rhode Island sample—
i.e., an average 1.3 points higher on the SF-36 scales
than the national norms—may be a consequence of
collecting the data by telephone, which has been shown
�354
LAFORGE ET AL.
TABLE 2
Descriptive Statistics for the SF-36 Scales
Scale
Mean
SD
% Floor a
% Ceilingb
Coefficient a
85.8
80.3
77.9
73.7
63.5
75.3
83.3
84.6
22.4
34.1
25.8
20.7
20.9
18.8
30.3
22.0
0
11
1
0
1
0
7
1
46
69
41
9
3
7
72
53
0.92
0.88
0.80
0.74
0.76
0.78
0.75
0.76
Physical functioning (PF)
Role limitations due to physical problems (RP)
Bodily pain (BP)
General health (GH)
Vitality (VT)
Mental health (MH)
Role limitations due to emotional problems (RE)
Social functioning (SF)
Note. a, Cronbach’s a, measure of internal consistency reliability of the scale.
a
% Floor, percentage of respondents with lowest possible score of 0.
b
% Ceiling, percentage of respondents with highest possible score of 100.
to result in slightly higher scores than mail surveys
[50].
As expected, increasing age was inversely associated
with measures of physical health-related quality of life,
as indicated by all four SF-36 scales assessing PF, GH,
BP, and RP (Table 3). In contrast, age was not significantly associated with any of the SF-36 scales measuring mental health, but was significantly and directly
related to the MCS summary measure of mental healthrelated quality of life. Although the effect sizes for differences were not large, younger people tended to score
slightly lower on MH and RE than did older people.
Females scored significantly higher than males on the
VT scale, but otherwise did not differ from males with
respect to health-related quality of life. Education was
strongly associated with the two summary measures of
PF and MH, as well as with five of the scales measuring
PF, GH, RP, RE, AND SF. In general, those with more
education scored higher on PF and MH measures of
quality of life.
The results of analyses with exercise stage reveal a
generally consistent pattern indicating that quality of
life scale scores increase across the stages from precontemplation to maintenance. The unadjusted MANOVA
TABLE 3
Selected Sample Characteristics by SF-36 Scale Scores and Summary Measures
Physical health (PCS) scalesa
Variable
Age
LT 30
30–40
41–55
GT 55
Gender
Male
Female
Education
LT high school
High school
College
Grad school
Total sample
Difference from U.S. normsc
a
Physical
Role
functioning physical
Bodily
pain
Mental health (MCS) scalesa
General
PCS
MCS
health
summary
Mental
Role
Social
summary
perceptions measure b Vitality health emotional functioning measure b
91.3*
91.7
84.0
75.6
86.0*
85.7
79.1
69.3
83.2*
77.9
76.7
73.2
76.5*
78.3
72.2
67.3
53.4*
53.7
49.8
45.8
63.9
65.3
62.4
62.1
74.1
75.2
74.9
76.9
81.7
83.9
83.2
84.4
84.6
84.9
84.7
84.3
49.1*
50.1
50.7
52.6
84.8
87.6
79.6
81.4
76.5
80.2
73.7
73.9
51.2
50.2
61.8*
66.5
74.3
77.0
83.7
82.5
84.3
85.2
51.0
50.3
76.0*
84.4
88.3
94.1
85.8
11.2
71.7*
80.9
80.2
89.3
80.3
20.9
74.3
78.3
77.4
83.5
77.9
12.4
65.6*
74.5
74.3
79.7
73.7
11.5
47.6*
50.5
50.9
53.5
50.6
10.6
69.5
74.9
76.2
80.1
75.3
10.5
74.5*
84.3
83.2
90.7
83.3
12.0
78.5*
86.2
84.0
89.8
84.6
11.0
48.3*
50.9
50.5
52.5
50.6
10.6
60.6
63.8
63.0
67.6
63.5
12.4
SF-36 scale scores range from 0 to 100, with 100 indicating optimal health and functioning.
PCS and MCS summary measures are standardized to the US. general population with mean 5 50 and SD 5 10.
c
Source of U.S. population norms for SF-36 scale and summary scores: [43,47].
* p , 20.006.
b
�355
STAGE OF EXERCISE AND QUALITY OF LIFE
results revealed that exercise stage was significantly
related to the linear composite of the eight scales of
health-related quality of life (Hotellings T 2 5 0.113,
df 5 32; Wilks l 5 0.897, P , 0.0005). (A MANOVA
conducted using the PCS and MCS summary scales
was similarly related to exercise stage; Hotellings
T 2 5 0.042, df 5 8; Wilks l 5 0.959, P , 0.0005.)
Age and education remained significant covariates, but
gender failed to achieve statistical significance in the
multivariate model. Statistical adjustment of the mean
scores for age, gender, and education did not change
the relationships found in the unadjusted analyses, and
resulted in only small, insignificant changes from the
observed scores. For the SF-36 scale scores, the amount
of variability in the discriminant score attributable to
between-group differences in exercise stage was 28.5%
in the unadjusted model and 23.9% in the adjusted
model. Since statistical adjustment contributed little
to the overall relationship with exercise stage, only the
unadjusted univariate ANOVA follow-up tests are
reported below.
The results of the ANOVA and post hoc tests for exercise stage and indices of health-related quality of life
are presented in Table 4. The early stages (precontemplation, contemplation, and preparation) represent self
reports of increasing degrees of intention to exercise,
while the later stages (action and maintenance) reflect
increasing duration of time spent engaged in consistent
regular exercise. Exercise stage was significantly associated with physical and mental health-related quality
of life, including all of the SF-36 scales except the SF
scale. Stage of exercise was linearly related to most
measures of health-related quality of life, although differences between stages did not achieve statistical significance on all of the scales, as indicated by the results
of Tukey HSD tests. The standardized effect sizes (v 2)
ranged from medium to small as described by Cohen
[48] and are comparable to those in other published
literature examining the association of variables with
exercise stage [22,23]. The linear relationship was most
direct for physical health, as measured by the PF, BP,
and GH scales. In these scales, persons in the maintenance stage for regular exercise scored higher than did
those in action, who in turn scored higher than those
in the contemplation stage, who in turn scored higher
than those in the precontemplation stage for regular
exercise.
A nonlinear relationship was found between exercise
stage and the SF-36 scales that tap mental, emotional,
and role functioning, such as the scales that assess MH
and RE. With respect to MH functioning the strongest
differences appeared for those who engaged in regular
TABLE 4
Exercise Stage of Change and Health-Related Quality of Life Scores (Standard Deviations)
Exercise stage of changeb
SF-36 scalea
n
Physical functioning (PF)
Role limitations due to physical
problems (RP)
Bodily pain (BP)
General health (GH)
Vitality (VT)
Mental health (MH)
Role limitations due to emotional
problems (RE)
Social functioning (SF)
Physical health (PCS) c
Mental health (MCS) c
a
PC
250
C
164
P
287
A
82
M
604
Tukey
HSD*
F
P value
v2
77.2
(28.3)
72.5
(39.1)
73.0
(29.3)
67.0
(24.2)
57.7
(24.5)
73.8
(21.5)
82.9
(31.5)
82.2
(25.3)
46.9
(12.0)
50.6
(10.6)
83.0
(23.9)
74.8
(38.3)
73.3
(29.3)
69.4
(22.2)
59.8
(19.8)
74.3
(18.3)
80.6
(31.2)
81.7
(23.6)
48.5
(11.7)
49.9
(10.1)
85.8
(20.1)
79.5
(32.7)
77.3
(25.8)
71.5
(19.6)
59.7
(19.7)
72.1
(20.1)
78.9
(33.3)
84.3
(21.4)
50.7
(9.8)
48.8
(10.1)
87.3
(21.5)
86.6
(29.2)
80.4
(19.8)
75.5
(18.1)
66.2
(16.9)
78.6
(15.2)
91.5
(20.2)
87.6
(19.8)
51.1
(8.7)
52.7
(7.0)
90.3
(18.9)
84.7
(30.8)
81.4
(23.2)
78.7
(18.3)
68.5
(19.4)
77.3
(17.3)
85.1
(29.0)
86.3
(20.6)
52.6
(8.5)
51.3
(9.1)
PC,P,A,M
C,M
PC,C ,M
PC,A
PC,C ,M
,0.00005
0.043
,0.00005
0.019
,0.00005
0.017
PC,C,P,M
PC,A
PC,C,P,M
PC,A
PC ,A,M
,0.00005
0.049
,0.00005
0.048
0.0006
0.011
P,A,M
0.0038
0.008
ns
0.0250
0.005
PC,,P,A,M
C,M
P,A,M
,0.00005
0.043
0.0008
0.011
SF-36 scale scores range from 0 to 100, ruth 100 indicating optimal health and functioning.
PC, precontemplation; C, contemplation; P, preparation; A, action; M, maintenance.
c
PCS and MCS summary measures are standardized to the US. general population with mean 5 50 and SD 5 10.
* Significant at adjusted 0.05 level.
b
�356
LAFORGE ET AL.
exercise behavior versus those who did not, and differences in the degree of intention across stages—as represented by the earlier (precontemplation, contemplation,
and preparation) stages—were not significantly different. For example, although the VT scale had a moderately strong association with exercise stage (v 2 5
0.048), the earlier stages did not differ significantly
from each other, but were each significantly different
from the action and/or maintenance stages. The SF
scale did not discriminate among the stages of exercise.
DISCUSSION
In this study, we examined the association of selfperceived quality of life with a measure of stage of
change for adoption of consistent regular exercise, defined as 3 or more times per week for 20 minutes per
occasion. Studies of the characteristics of people who
do, and do not, exercise regularly can provide important
insights to aid the effort to enhance both the efficacy
and impact of health promotion initiatives. Classification of the population by stage of motivational readiness
to exercise extends this body of research by further
differentiating the sedentary and active populations
into meaningful stages along an underlying continuum
of change. Enhancing self-perceptions and attitudes
about the health consequences of exercise behavior is
an important strategy proposed for increasing physical
activity adoption and adherence in populations [1,19]. It
is important, therefore, to understand if stage of change
classifications for exercise are influenced by, or influence, self-perceived quality of life and to consider
whether this relationship has practical implications for
stage-matched intervention messages.
The results demonstrate that cognitions about selfperceived quality of life vary significantly across the
stages of change for regular exercise. In this large representative sample of adults, the three areas that showed
the strongest relationship with stage of exercise were
GH, VT, and PF. Linear relationships were found between the stages of change for exercise and the four
scales most associated with physical health, as well as
for the composite measure of physical health. On the
PF scale, for example, precontemplators scored significantly lower than those in the preparation, action, or
maintenance stages. Contemplator’s scores were significantly lower than those in maintenance. Precontemplators differentiated from people in other stages on six
of the eight dimensions of quality of life. Further, those
in the precontemplation stage had the lowest quality
of life score on each of the four physical health and
functioning scales.
This finding of differentiation across stages of exercise is consistent with previous research on other cognitive constructs drawn from a variety of theoretical models. Self-efficacy, decisional balance, processes of
change, attitudes, intention, perceived severity, and
control beliefs have all been found to discriminate
across the stages of change for exercise [22,23,32,34,51].
In one of the few longitudinal studies in this area, Marcus and colleagues found that use of the cognitive process of change labeled “dramatic relief”—which assesses
affective aspects of change and is measured by items
such as “warnings about the health hazards of inactivity move me emotionally”—increased significantly
across the stages of change among persons who adopted
exercise and decreased significantly among persons
who relapsed from exercise [32]. Similarly, Courneya
found that a related construct “perceived severity of the
health consequences of inactivity” was directly associated with exercise stage [23]. These studies are compatible with our finding that self-perceived quality of life
increases across the stages of exercise. It may be that
the perception of positive health benefits of exercise
increase with increasing physical activity and may diminish when one relapses from regularly exercising.
One potential implication of these results is that modification of an individual’s beliefs in the benefits of regular exercise, or the severity of health consequences due
to inactivity, may be useful strategies to help move
early stage people to seriously consider becoming more
physically active. Focusing intervention messages on
altering the perception of the positive benefits of regular exercise (and the negative consequences of a sedentary lifestyle) is also suggested by studies that have
shown a generally consistent relationship between
stage of exercise and measures of the pros and cons
(decisional balance) of exercise [30,36,51,52]. Longitudinal studies and intervention research should continue
to explore these relationships to determine whether
intention to change exercise behavior can be influenced
by changes in self-perception of the positive and negative health consequences of engaging in exercise.
Exercise stage was weakly associated with the composite measure of mental health-related quality of life
(the MCS summary scale) and demonstrated a significant, but nonlinear, relationship with three of the four
mental health scales of the SF-36. Further analysis
revealed that engaging in exercise behavior, and not
the intention to exercise, was primarily responsible for
these associations. Most of the variance found in the
exercise stage–mental health status association is explained by the VT scale. Vitality is a complex construct
which is correlated moderately with both mental and
physical health functioning [25,43]. It measures the
degree of energy, pep, or tiredness experienced. Neither
intention nor regular exercise behavior above the criterion level were associated with the SF-36 SF scale in
this study. The SF scale represents the extent and
amount of time that physical or emotional problems
have interfered with normal social activities, such as
visiting friends.
�STAGE OF EXERCISE AND QUALITY OF LIFE
The literature on the psychosocial health benefits of
physical activity and regular exercise is not as consistent as the literature on the physical health benefits of
exercise. Numerous studies have found that exercise
is associated with feelings of well-being and reduced
symptoms of depression, stress, and anxiety [3,53].
Other studies, however, have found little evidence of
mental health benefits from exercise [54,55]. Two large
cohort studies examined the dose–response relationship between physical activity and symptoms of depression and reported that the benefits of regular physical
activity were evident only in the portion of the population at the highest activity levels and not among persons exercising at lower levels [56,57]. In this study,
people in the preaction stages (precontemplation, contemplation, and preparation) reported not to be exercising at the specified criterion level (3 or more times
a week for 20 minutes), and therefore, may not have
approached the threshold of physical activity needed to
demonstrate a measurable benefit on the SF-36 MH
scales. However, those who reported exercising at or
above the criterion—those in the action and maintenance stages—did exhibit measurable increases in
three out of four of the mental-health-related quality
of life scales.
Population studies of the stages of motivational
readiness to change exercise behavior can have important implications for the social marketing of health
promotion initiatives [58]. It is notable that the distributions and pattern of results on both the exercise stage
construct and the SF-36 scores appear to be representative of the general population of adults. The demographic differences found for the PCS and MCS scales
in this sample are remarkably consistent with those
reported by Ware and colleagues [43]. The distribution
of the exercise stage construct is similar to other studies
that have used the same or similar staging item
[22,30,34,38]. The finding that exercise stage can discriminate between the physical health and mental
health components of the SF-36 provides additional evidence of the external validity of the stage measure. This
suggests that the relationships found for exercise stage
in this study may have wide applicability in monitoring
trends in exercise health behavior and intention, as
well as for the development of exercise interventions
that can reach the majority of the population at risk
for the consequences of sedentary lifestyles.
There are several limitations to this study that must
be considered. The SF-36 has been used extensively
with clinical populations and is sensitive to changes in
functional health due to clinical conditions. Like the
present study, other studies of general population samples have reported significant ceiling effects on some of
the SF-36 scales [43]. This is presumably due to the
lower frequency of dysfunction in the general population. The PCS and MCS summary component measures
357
are thought to be less affected by ceiling effects than
are the SF-36 scales [43]. Ceiling effects can diminish
the discriminatory power of a scale. Despite these limitations, the SF-36 was still found to discriminate across
the stages of regular exercise on most indices of physical
and mental functioning. One consequence of the ceiling
effects found in this study is that the effect sizes reported for the stage variable in Table 4 may underestimate the size of the true effect of exercise stage on selfperceived quality of life.
These data are cross-sectional and cannot provide
evidence of the causal direction of the relationship between exercise stage and quality of life. It is not possible, for example, to determine whether sedentary lifestyle caused the diminished self-perceived quality of life
or whether people with lower levels of health-related
quality of life did not exercise, or express the intention
to exercise, because they have poor health. People who
have good physical and mental health-related quality
of life may simply be more likely to be physically active.
There are, however, many studies that provide strong
evidence of a causal relationship between increased levels of exercise and improved health status [1,2,9,10,27].
It will be useful for future longitudinal research to investigate whether the observed relationship between
stage of exercise and self-perceived quality of life is due
primarily to ill health, to low levels of physical activity,
or to other cognitive or lifestyle factors that influence
exercise intention and behavior.
There are, of course, limitations to our understanding
of the validity of the exercise stage construct. In survey
research there is always a trade-off between the need
for brevity of the questionnaire and the ability to provide detailed data on a topic area. Considerations of
cost and respondent burden often give brevity a commanding hand in many large-scale population surveys.
There is evidence, however, that the simple stage measure used in this study has construct validity. Approximately one-third of the population was in the precontemplation or contemplation stage, which is consistent
with Caspersen and colleagues’ estimate that approximately one-third of the general population is sedentary
[59]. This survey did not collect data on exercise behaviors beyond the stage measure, and cannot, therefore,
distinguish the degree of exercise intensity, such as
vigorous or moderate. It has been shown, however, that
progression through the exercise stages is related to
increasing amounts of physical activity [23,31–
33,41,42]. Although the stage construct appears to be
relatively robust, future research may require comparison of alternative staging methods with objective
measures of exercise behavior to determine the most
appropriate method for the particular study or intervention approach.
An important limitation of this study is that we cannot disentangle the effect of increasing physical activity
�358
LAFORGE ET AL.
from the possible effect of increasing degrees of intention across the stages. This is an important area to
explore in future research. It is likely that the single
measure of exercise stage used in this study exhibits
an optimistic bias, that is, more people say they are
intending to exercise or are in maintenance than really
are. It will be useful to know whether the 44% of the
population who reports consistent regular exercise for
more than 6 months is actually performing at that level.
However, even without detailed knowledge of these issues, this paper has found that exercise stage is a brief
and reliable construct that can be useful for classifying
the population with respect to exercise intention and
behavior.
CONCLUSIONS
This study found that the sedentary portion of the
population who report being the least prepared to adopt
regular exercise as part of their lifestyle had the lowest
self-reported quality of life for physical health. These
results imply that health promotion interventions for
precontemplators may benefit from targeted messages
that call attention to improvements in quality of life
that can be expected with increased physical activity.
Additionally, the results of this study suggest that it is
important to study whether sedentary groups, or those
with low levels of physical activity, are experiencing
more emotional distress and may be more in need of
programs to assist them to adopt regular exercise as a
method of managing such distress.
There are many personal and social reasons why
maintenance of regular exercise is a desirable, yet elusive, objective of health promotion. Existing research
has only scratched the surface in the effort to understand the factors involved with regular exercise adoption. This study extends previous research with the
finding that self-perception of health-related quality of
life is associated with an individual’s stage of motivational readiness to engage in regular physical activity.
Research into the causal nature of this relationship
could provide information important to the development of more effective stage-matched interventions.
The study is consistent with other studies that have
demonstrated that meaningful classification of the general population can be made using a simple method of
self-report for stage of change of regular exercise. Stage
of change for exercise is one construct in a broader set
of cognitive and behavioral constructs that have been
found to be useful for studying motivational issues related to exercise behavior change [19,23,35,52]. The
study of the characteristics of individuals across the
distribution of motivational readiness is an important
step in the development of social marketing strategies
for health promotion which can be applicable to broad
segments of the population.
ACKNOWLEDGMENTS
An earlier version of this paper was presented at the 14th Annual
Meeting of the Society for Behavioral Medicine, San Francisco, CA,
March 10–13, 1993. The authors thank Claudio Nigg for his thoughtful review and suggestions on an earlier draft of the manuscript.
REFERENCES
1. U.S. Department of Health and Human Services, Centers for
Disease Control and Prevention, National Center for Chronic
Disease Prevention and Health Promotion. Physical activity and
health: a report of the Surgeon General, Atlanta, 1996.
2. Bouchard C, Shepard RJ, Stephens T, Sutton JR, MCPherson
BD (editors). Exercise, fitness and health: a consensus of current
knowledge. Champaign, IL: Human Kinetics, 1990.
3. Stephens T. Physical activity and mental health in the United
Stages and Canada: evidence from four population surveys. Prev
Med 1988;17:35–47.
4. Blair, SN. Physical activity, fitness, and coronary heart disease.
In: Bouchard C, Shepard RJ, Stephens T, editors. Physical activity, fitness, and health; international proceedings and conscensus
statement. Champaign, IL: Human Kinetics, 1994:579–90.
5. Giovannucci E, Ascherio A, Rimm EB, Colditz GA, Stampfer M,
Willett WC. Physical activity, obesity, and risk of colon cancer
and adenoma in men. Ann Intern Med 1995;122:327–34.
6. Dalsky GP, Stocke SS, Ehsani AA, Slatopolsky E, Lee WC, Birge
SJ. Weight-bearing exercise training and lumbar bone mineral
content in postmenopausal women. Ann Intern Med 1988;108:
824–28.
7. Helmrich S, Ragland D, Leung R, et al. Physical activity and
reduced occurrence of non-insulin-dependent diabetes mellitus.
N Eng J Med 1991;325:147–52.
8. Centers for Disease Control and Prevention. Prevalence of sedentary lifestyle—behavioral risk factor surveillance system, United
States, 1991. MMWR Mob Mortal Wkly Rep 1993:42:576–79,
9. U.S. Department of Health and Human Services. Healthy People
2000. National health promotion and disease prevention objectives, Rockville, MD: U.S. DHHS, Public Health Services, 1991.
[DHHS Publication No. 91-50212]
10. Pate RR, Pratt M, Blair SN, Haskell WL, Macera CA, et al.
Physical activity and public health: a recommendation from the
Centers for Disease Control and Prevention and the American
College of Sports Medicine. JAMA, 1995;273(5):402–07.
11. Bandura, A. Social foundations of thought and action: a social
cognitive theory. Englewood Cliffs, NJ: Prentice–Hall, 1986.
12. Prochaska, JO, DiClemente CC. The stages and process of selfchange in smoking: towards an integrative model of change. J
Consult Clin Psychol 1983;51:390–95.
13. Janis, IL, Mann, L. Decision making: a psychological analysis of
conflict, choice, and commitment. New York: Free Press, 1977.
14. Ajzen, I, Fishbein, M. Understanding attitudes and predicting
social behavior. Englewood Cliffs, NJ, Prentice–Hall, 1980.
15. Cardinal, BJ. The transtheoretical model of behavior change as
applied to physical activity and exercise: a review. J Phys Educ
Sport Sci 1995:8:32–45.
16. McAuley, E, Courney, KS, Rudolph, DL, Lox, CL. Enhancing
exercise adherence in middle-aged males and females. Prev
Med 1994;23:498–506.
17. Marcus, BH, Banspatch, SW, Lefebvre, RC, Rossi, JS, Carleton,
RA, Abrams, DB. Using the stages of change model to increase
the adoption of physical activity among community participants.
Am J Health Promot 1992; 6:424–29.
18. Dunn AL, Marcus BH, Kampert JB, Garcia ME, Kohl HW, Blair
�STAGE OF EXERCISE AND QUALITY OF LIFE
SN. Reduction in cardiovascular disease risk factors: 6-month
results from Project Active. Prev Med 1997;28:883–92.
19. McCauley, E. Courneya, KS. Adherence to exercise and physical
activity as health-promoting behaviors: attitudinal and self-efficacy influences. Appl Prev Psychol 1993;2;65–77.
20. Prochaska, JO, Marcus, BH. The Transtheoretical model: application to exercise. In: Dishman RK, editor. Advances in exercise
adherence. Champaign, IL, Human Kinetics, 1994.
21. Marcus, BH, Emmons, KM, Simkin-Silverman, L, Linnan, LA,
Taylor, ER, Bock, BC, Roberts, MB, Rossi, JS, Abrams, DB. Evaluation of motivationally-tailored versus standard self-help physical activity interventions at the workplace. Am J Health Promot 1998;12(4):246–53.
22. Courneya, KS. Understanding readiness for regular physical activity in older individuals: an application of the theory of planned
behavior. Health Psychol 1995;14(1):1–8.
23. Courneya, KS. Perceived severity of the consequences of physical
inactivity across the stages of change in older adults. J Sport
Exerc Psychol 1995;17:447–57.
24. Kaplan, RM, Bush, JW. Health-related quality of life measurement for evaluation research and policy analysis. Health Psychol 1982;1:61–80.
25. Ware, JE, Sherbourne, CD. The MOS 36-Item Short-Form Health
Survey (SF-36): I. Conceptual framework and item selection. Med
Care 1992;30(6):473–83.
26. Rejeski, WJ, Brawley LR, Schumaker, SA. Physical activity and
health-related quality of life. Exerc Sport Sci Rev 1996;24:
71–108.
27. Stewart, AL, Hays, RD, Wells, KB, Rogers, WH, et al. Long-term
functioning and well being outcomes associated with physical
activity and exercise in patients with chronic conditions in the
Medical Outcomes Study. J Clin Epidemiol 1994;47(7):719–30.
28. Salmon, CT, Nichols, JS. The next-birthday method of respondent
selection. Public Opin Q. 1983;47:207–76.
29. Fowler, FJ, and Mangione, TW. Standardized survey interviewing: minimizing interviewer-related error. Newbury Park:
Sage, 1990
30. Reed, GR, Velicer, WF, Prochaska, JO, Rossi, JS, Marcus, BH.
What makes a good staging algorithm: examples from regular
exercise. Am J Health Promot 1997;12(1):57–66.
31. Wyse, J, Mercer, T, Ashford, B, Buxton, K Gleeson, N. Evidence
for the validity and utility of the stages of exercise behavior
change scale in young adults. Health Educ Res 1995;10(3):
365–77.
32. Marcus, BH, Simkin, LR. The stages of exercise behavior. J Sports
Med Phys Fitness 1993;63:60–6.
33. Barke, CR Nichols, PPR. Physical activity in older adults: the
stages of change. J Appl Gerontol 1990;9:216–30.
34. Marcus, BH, Selby, V, Niaura, RS, Rossi, JS. Self-efficacy and
the stages of exercise behavior. Res Q Exerc Sport 1992;63:60–6.
35. Armstrong, CA, Sallis, JF, Hovell, FM Hofstetter, CR. Stages
of change, self-efficacy, and adoption of vigourous exercise: a
prospective analysis. J Sport Exerc Psychol 1993;9:216–23.
36. Myers, RS, Roth, DL. Perceived benefits and barriers to exercise
and stage of exercise adoption in young adults Health Psychol
1997;16(3):277–83.
359
37. American College of Sports Medicine. Position statement on the
recommended quantity and quality of exercise for developing and
maintaining cardioresiratory and muscular fitness in healthy
adults. Med Sci Sport Exerc 1990;22:265–74.
38. Rossi JS, Laforge RG, Prochaska JO. Readiness to change 10
health behaviors in smokers, ex-smokers and non-smokers. Proceedings of the 13th Annual Scientific Sessions of the Society of
Behavioral Medicine. San Diego, CA: 1995.
39. Laforge, RG, Velicer, WF, Richmond, RL, Owen, N. Stage distributions for five health behaviors in the USA and Australia. Prev
Med 1998; in press.
40. Schechtman, KB, Barzlai, B, Rost, K, Fisher, EB. Measuring
physical activity with a single question. Am J Pub Health 1991;
81(6):771–73.
41. Cardinal, BJ. Construct validity of stages of change for exercise
behavior. Am J Health Promot 1997;12(1):68–74.
42. Emmons, KM, Marcus, BH, Linnan, L, Rossi, JS, Abrams, DB.
Mechanisms in multiple risk factor interventions: smoking, physical activity, and dietary fat intake among manufacturing workers. Prev Med 1994;24(4):481–89.
43. Ware, JE, Kosinski, M, Keller, SD. SF-36 physical and mental
health summary scales: a user’s manual. Boston, MA: The Health
Institute, 1994.
44. Rampal, P, Martin, C, Marquis, P, Ware, JE, Bonfils, S. A quality
of life study in five hundred and eighty-one duodenal ulcer patients: maintenance versus intermittent treatment with nozatidine. Scand J Gastroenterol 1994;206 Suppl 29:44–51.
45. Stewart, AL, Greenfield, S, Hays, RD, Wells, KB, Rogers, WH,
Berry, SD, McGlynn, EA, Ware, JE. Functional status and wellbeing of patients with chronic conditions: results from the Medical Outcomes Study. JAMA, 1989;267(7):907–13.
46. McHorney, CA, Ware, JE, Raczek, AE. The MOS 36-Item ShortForm Health Status Survey (SF-36): II. Psychometric and clinical
tests of validity in measuring physical and mental health constructs Med Care, 1993;31:247.
47. Ware, JE, Snow, KK, Kosinski, M, Gandek, B. SF-36 health survey manual and interpretation guide. Boston, MA: The Health
Institute, New England Medical Center Hospitals, 1993.
48. Cohen, J. Statistical power analysis for the behavioral sciences.
Second Ed. Hillsdale, NJ: Lawrence Erlbaum, 1988.
49. State Data Center. 1990 census of population and housing, summary tape file for Rhode Island. Amherst, MA: Massachusetts
Institute for Social and Economic Research, 1990.
50. McHorney, CA, Kosinski M, Ware, JE. Comparisons of the costs
and quality of norms for the SF-36 Health Survey collected by
mail versus telephone interview: results from a national survey.
Med Care, 1994;32:551–67.
51. Marcus, BH, Eaton, CA, Rossi, JS, Harlow, LL Self-efficacy, decision-making, and stages of change: an integrative model of physical exercise. J Appl Soc Psychol 1994;24:489–508.
52. Prochaska, JO, Velicer, WF, Rossi, JS, Goldstein, MG, Marcus,
BH, Rakowski, W, Fiore, C, Harlow, LL, Redding, CA, Rosenbloom, D, Rossi, SR. Stages of change and decisional balance for
12 problem behaviors. Health Psychol 1994;13(1):39–46.
53. Martinsen, EW, Stephens, T. Exercise and mental health in clinical and free-living populations. In: RK Dishman, editor. Advances
in exercise adherence. Champaign, IL: Human Kinetics, 1994;
55–72.
54. Brown DR, Wang Y, Ward A, Ebbeling CB, Fortlage L, Puelo E,
et al. Chronic psychological effects of exercise and exercise plus
cognitive strategies. Med Exerc Nutr Health 1992;3:125–42.
55. King, AC, Taylor, CB, Haskell, WL. Effects of differing intensities
and formats of 12 months of exercise training on psychological
outcomes in older adults. Health Psychol 1993;12:292–300.
�360
LAFORGE ET AL.
56. Camacho, TC, Roberts, RE, Lazarus, NB, Kaplan, GA, et al.
Physical activity and depression: evidence from the Alameda
County Study. Am J Epidemiol 1991;134:220–31.
58. Donovan, RJ, Owen, N. Social marketing of population interventions. In: Dishman RK, editor. Advances in exercise adherence.
Champaign, IL: Human Kinetics, 1994.
57. Paffenbarger, RS, JR, Lee I-M, Leung, R. Physical activity and
personal characteristics associated with depression and suicide
in American college men. Acta Psych Scand Suppl 1994;377:
16–22.
59. Caspersen, CJ, Merritt, RK, Stephens, T. International physical
activity patterns: a methodological perspective. In: Dishman RK,
editor. Advances in exercise adherence. Champaign, IL: Human
Kinetics, 1994.
�
 Wayne Velicer