CSIRO PUBLISHING
Australian Journal of Zoology
http://dx.doi.org/10.1071/ZO14076
Reconstructed paternal genotypes reveal variable rates
of multiple paternity at three rookeries of loggerhead sea turtles
(Caretta caretta) in Western Australia
J. N. Tedeschi A,B,F, N. J. Mitchell A,B, O. Berry C, S. Whiting D, M. Meekan B,E
and W. J. Kennington A
A
School of Animal Biology (M092), The University of Western Australia, 35 Stirling Highway, Crawley,
WA 6009, Australia.
B
Oceans Institute (M470), The University of Western Australia, 35 Stirling Highway, Crawley,
WA 6009, Australia.
C
CSIRO Oceans and Atmosphere Flagship, PMB 5, Floreat, WA 6014, Australia.
D
Marine Science Program, Department of Parks and Wildlife, Locked Bag 104, Bentley Delivery Centre,
WA 6983, Australia.
E
Australian Institute of Marine Science (M096), The University of Western Australia, 35 Stirling Highway,
Crawley, WA 6009, Australia.
F
Corresponding author. Email: jamie.tedeschi@research.uwa.edu.au
Abstract. Female sea turtles are promiscuous, with clutches of eggs often sired by multiple males and rates of multiple
paternity varying greatly within and across species. We investigated levels of multiple paternity in loggerhead sea turtles
(Caretta caretta) from three rookeries in Western Australia by analysing polymorphic species-specific genetic markers. We
predicted that the level of multiple paternity would be related to female population size and hence the large rookery at Dirk
Hartog Island would have higher rates of multiple paternity than two smaller mainland rookeries at Gnaraloo Bay and
Bungelup Beach. Contrary to our prediction, we found highly variable rates of multiple paternity among the rookeries that
we sampled, which was unrelated to female population size (25% at Bungelup Beach, 86% at Gnaraloo Bay, and 36% at
Dirk Hartog Island). Approximately 45 different males sired 25 clutches and the average number of sires per clutch ranged
from 1.2 to 2.1, depending on the rookery sampled. The variance in rates of multiple paternity among rookeries suggests
that operational sex ratios are variable in Western Australia. Periodic monitoring would show whether the observed patterns
of multiple paternity for these three rookeries are stable over time, and our data provide a baseline for detecting shifts in
operational sex ratios.
Received 9 September 2014, accepted 19 December 2014, published online 15 January 2015
Introduction
Unlike many bird and mammal species, parental care beyond
nesting is absent in most reptiles (Shine 2005; Uller and Olsson
2008). Males do not provide any resources to females other than
sperm, yet multiple paternity in clutches has been recorded in
most reptile species to date (Uller and Olsson 2008). Multiple
paternity has been detected in all seven extant species of sea
turtle, with one or two sires being the most common number for
a single clutch (reviewed by Bowen and Karl 2007, and Lee
2008). In sea turtles, multiple paternity can arise in two ways:
either a female can mate with more than one male during the
same reproductive cycle or, alternatively, a female may utilise
sperm stored from a previous breeding season (Pearse and Avise
2001; Lara-De La Cruz et al. 2010; Phillips et al. 2014a).
Many explanations for multiple paternity have been
proposed, including increased fertilisation success, improved
Journal compilation � CSIRO 2015
offspring fitness, and harassment of receptive females by males
(Jensen et al. 2013). Ireland et al. (2003) and Lee and Hays
(2004) suggested that the phenomenon was a product of male
density and avoidance of aggressive mating behaviour by
females, causing females to mate with more than one male
(convenience polyandry). A study on solitary and mass-nesting
(arribada) Olive Ridley turtles (Lepidochelys olivacea) by
Jensen et al. (2006) attributed the higher rate of multiple
paternity in the arribada females to their high density of nesting.
As males rarely come ashore and are difficult to catch at sea,
genetic analyses of nesting females and their offspring can both
identify the number of sires per clutch and provide data on the
number of breeding males and females from which operational
sex ratios (OSRs) can then be calculated (Wright et al. 2012a,
2012b; Hawkes et al. 2014). The OSR of a given population
should be proportional to the number of males at the breeding
www.publish.csiro.au/journals/ajz
�B
Australian Journal of Zoology
J. N. Tedeschi et al.
third-largest population of C. caretta in the world (Baldwin
et al. 2003; Reinhold and Whiting 2014), we know relatively
little about the population demographics. A description of
mating systems, quantification of the incidence of multiple
paternity, and quantification of genetic variation is a first step
towards understanding the implications of climate change and
changing sex ratios of this globally important population.
Genetic analyses offer a means to indirectly sample the male
component of a population of breeding turtles (Lee 2008;
Phillips et al. 2014b; Stewart and Dutton 2011) and there are
several methods for estimating multiple paternity using genetic
data (Table 1). For sea turtles, such studies show that rates of
multiple paternity are highly variable (Table 1), though it is
unclear whether the reported variability among species and
area before the nesting season (Hays et al. 2010; Stewart and
Dutton 2011), and therefore reflect the underlying genetic
variation of the population.
Relative to other parts of the world, little is known about the
population dynamics of loggerhead turtles (Caretta caretta)
nesting in the eastern Indian Ocean. In Australia, there are two
genetically distinct populations of C. caretta, one in Western
Australia and the other in Queensland (Baldwin et al. 2003). All
rookeries in Western Australia comprise a single genetic stock
(Pacioni et al. 2012), spanning ~520 km of coastline from Dirk
Hartog Island (25.49827�S, 112.98719�E) at the southern limit
to the Muiron Islands north-east of Exmouth (21.39156�S,
114.21205�E) at the northern limit of the range (Baldwin et al.
2003). Although the rookeries within this area constitute the
Table 1. Variation in rates of multiple paternity in sea turtles within species and across studies
MP, multiple paternity
No. of
clutches
analysed
Mean no.
of offspring
genotyped
per clutch
No. of
loci
analysed
Minimum
no. of
males
Frequency
of MP
Green turtle (C. mydas)
Ascension Island
Ascension Island
Southern Great Barrier Reef
Tortuguero, Costa Rica
Algadi, Cyprus
Algadi, Cyprus
Sri Lanka
18
3
22
8
20
94
24
38.9
15.3
41.3
–
21.9
21.7
10
2–5
2
5
2
14
13
6
2
2
1
2
1.4
1.1
1.7
61%
100%
9%
63%
36%
23%
63%
Loggerhead turtle (C. caretta)
Zakynthos, Greece
Melbourne Beach, Florida
Mon Repos, Queensland
Melbourne Beach, Florida
Nagoya, JapanC
15
70
24
3
7
40.7
10
21
20.7
29
4
4
0
2
2
3.2
1.4
–
–
–
Olive Ridley turtle (L. olivacea)
Ostional, Costa RicaA
Playa Hermosa, Costa RicaB
Galibi, SurinameB
13
13
10
22
22.6
70.3
2
2
2
Kemp’s Ridley turtle (L. kempi)
Tamaulipas, Mexico
26
7.8
Hawksbill turtle (E. imbricata)
Gulisaan, Sabah, Malaysia
Cousine Island, Seychelles
Seychelles (various islands)
10
43
249
Leatherback turtle (D. coriacea)
Las Baulas, Costa Rica
Sandy Point, Virgin Islands
Sandy Point, Virgin Islands
Playa Grande, Costa Rica
Flatback turtle (N. depressus)
Mon Repos and Peak Island,
Queensland
A
Methods
Citation
DADSHARE, GERUD
REAP
GENEPOP 3.1
Irwin
COLONY 2.0
COLONY 2.0
GERUD 2.0
Lee and Hays (2004)
Ireland et al. (2003)
Fitzsimmons (1998)
Peare and Parker (1996)
Wright et al. (2012b)
Wright et al. (2012a)
Ekanayake et al. (2013)
93%
31%
33%
33%
43%
GERUD 1.0
PARENTAGE
Allozymes
–
–
Zbinden et al. (2007)
Moore and Ball (2002)
Harry and Briscoe (1988)
Bollmer et al. (1999)
Sakaoka et al. (2011)
2.8
1.4
1.2
92%
30%
20%
GERUD 1.0
GERUD 1.0
Initial inference
Jensen et al. (2006)
Jensen et al. (2006)
Hoekert et al. (2002)
3
–
58%
–
Kichler et al. (1999)
27
18.8
22.6
3
33
32
1.3
–
–
20%
9.3%
9.2%
GERUD 1.0
COLONY 2.0
COLONY 2.0
Joseph and Shaw (2011)
Phillips et al. (2013)
Phillips et al. (2014b)
4
38
17
20
–
26.8
10.5
19.5
2
7
6
3
1
–
–
–
0%
42%
0%
10%
–
GERUD 1.0
–
–
Rieder et al. (1998)
Stewart and Dutton (2011)
Dutton et al. (2000)
Crim et al. (2002)
16
26.7
4
–
69%
Initial inference,
Chi-square,
PARENTAGE 1.0,
GERUD 2.0, MER 3.0
Theissinger et al. (2009)
Arribada nesting beach.
Solitary nesting beach.
C
Captive population, paternal genotype known.
B
�Variable rates of paternity in loggerheads
Australian Journal of Zoology
populations is due to the use of different types of genetic
markers, differences in multiple paternity estimation methods, or
if indeed it reflects natural variability among populations. To
date, only one study (Jensen et al. 2006) has concurrently
examined the frequency of multiple paternity in two different
rookeries of the same species.
Here, we investigated patterns of multiple paternity in
clutches sampled from three locations spread across the
geographic range of rookeries of C. caretta in Western Australia.
The southern-most rookery was on Dirk Hartog Island (DHI),
one of the world’s largest rookeries (Baldwin et al. 2003;
Reinhold and Whiting 2014), while we also sampled clutches
from near the northern-most edge (Bungelup Beach, BB) and
from a smaller mainland rookery approximately midway in
the breeding range (Gnaraloo Bay, GB). We aimed to describe:
(1) the presence of multiple paternity, and (2) spatial variation in
multiple paternity rates among rookeries across the range of the
nesting population. Because these rookeries differed in size, we
predicted that the frequency of multiple paternity should be
higher in clutches from the larger nesting rookery at DHI
compared with the smaller, mainland rookeries (GB and BB)
C
based on the density-dependence convenience polyandry
model. To exclude the possibility that any variation in multiple
paternity we detected was an artefact of methodology, we
analysed paternity using identical statistical methods and the
same genetic markers for samples from all rookeries. Our results
are discussed in the context of estimating population size and the
implications of climate change on the demography of the Western
Australian population of C. caretta.
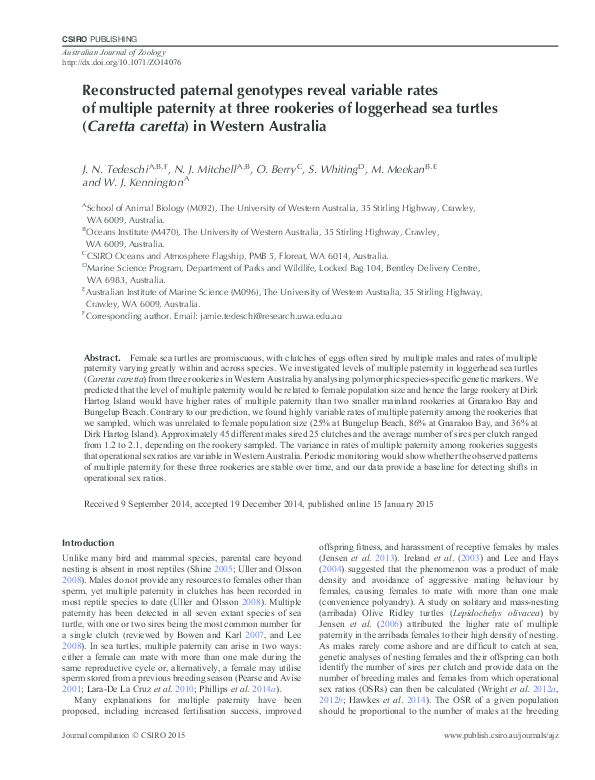
Methods
Egg collection and tissue sampling
Eggs of C. caretta were collected from three rookeries in Western
Australia during peak nesting periods between 2011 and 2013.
Collection sites and dates were Turtle Bay on Dirk Hartog Island
(25.49827�S, 112.98719�E) in January 2013, Gnaraloo Bay on
the Western Australian mainland (23.82618�S, 113.52629�E)
in January 2011 (Woolgar et al. 2013), and Bungelup Beach in
the Cape Range National Park on the Exmouth Peninsula
(22.282331�S, 113.831570�E) in December 2013 (Fig. 1). The
Dirk Hartog Island rookery hosts the largest nesting numbers,
Bungelup Beach
22.282331\S, 113.831570\E
Tropic of Capricorn
Gnaraloo Bay
23.82618\S, 113.52629\E
N
Indian Ocean
0 0.15 0.3
0.6
0.9
1.2
Kilometres
TURTLE
BAY
BEA
CH
Cape
Inscription
1
BEACH
BEAC
H2
CH 4
BEACH 3 BEA
5
Cape
Levillain
Sammys
Dirk Hartog Island
DIRK HARTOG ISLAND
25.49827\S, 112.98719\E
N
Kilometres
0 15 30
60
90
120
Fig. 1. Locations of the three collection sites: Dirk Hartog Island, Gnaraloo Bay, and Bungelup Beach. More than 2000 females nest per season on
Dirk Hartog Island, most notably on Beach 1 and Beach 5. Map adapted from Trocini (2013), and Reinhold and Whiting (2014).
�D
Australian Journal of Zoology
with ~2000 nesting females per season (Trocini 2013; Reinhold
and Whiting 2014), while an estimated 700–1200 females nest
per season at Bungelup Beach (Trocini 2013). In contrast,
nesting at the Gnaraloo Bay rookery is comparatively infrequent,
with ~100 females per season (Hattingh et al. 2011).
All offspring samples in this study were used
opportunistically, as they were collected for other research
projects (Woolgar et al. 2013; Tedeschi et al., unpubl. data). As a
consequence, sample sizes varied among clutches and among
rookeries. We had access to 80 eggs per clutch (n = 15 clutches)
from the Dirk Hartog Island rookery, and 20 eggs per clutch
(n = 4 clutches) from Bungelup Beach. Eggs sampled from these
rookeries were incubated in the laboratory and embryos were
euthanised before hatching. Maternal tissue was collected from
these two rookeries during oviposition by sampling from the
trailing edge of the back flipper with a sterile 3-mm biopsy
punch (Bydand Medical, NSW, Australia). At the Gnaraloo
Bay rookery, hatchlings were collected from nests for a study
conducted by Woolgar et al. (2013), and we used available
samples to assess paternity (GB; n = 10–22 eggs per clutch from
eight clutches). No maternal tissue samples were available for
the GB rookery because the collection permit for the study on
this population did not cover sampling of adult females. All
samples from the DHI (n = 859) and BB (n = 66) rookeries were
stored at room temperature in 2 mL Longmire buffer until
processing, whereas samples from the GB rookery (n = 119) were
stored at 4�C in 1.5–2.0 mL of 100% EtOH.
Microsatellite analysis and genotyping
Fourteen of the 15 clutches collected from DHI were
genotyped, as one clutch was unfertilised. Total DNA was
extracted from 1026 samples of offspring (minimum of 10
offspring per clutch) and 18 maternal samples using a standard
salting-out method (Sunnucks and Hales 1996), with the
exception of proteinase K digestion [200 mg mL–1] at 56�C
overnight. The DNA pellet was resuspended in 100 mL
nuclease-free sterile water and quantified by a NanoDrop®
Spectrophotometer (ND1000, Thermo Fisher Scientific,
Australia). All samples were normalised to 10 ng DNA mL–1 with
nuclease-free water before polymerase chain reaction (PCR).
Four loci designed for C. caretta (Cc8E07, Cc7B07, Cc5F01,
Cc7C04: see Shamblin et al. 2007) were run in a single PCR
multiplex. PCR was performed in 10-mL reactions with 1 ng
DNA template, 7.8 mL Platinum Supermix (Invitrogen, Life
Technologies, Vic., Australia), 0.2 mL MgCl2 [50 mM], and
0.25 mL each primer [7 mM]. PCR products were denatured at
95�C for 3 min, (40�) 30 s at 95�C, 45 s at 53�C, 30 s at 72�C, and
8 min extension at 72�C. All PCR products were analysed on an
ABI 3730 Sequencer against GeneScan 500 LIZ internal size
standard and DNA fragments were scored manually with
GeneMarker 1.91 software (SoftGenetics, LLC®, USA).
Data analysis
Levels of genetic variation among the 18 maternal genotypes
(DHI and BB rookeries) were assessed by calculating the
number of alleles per locus, and allele frequencies at each locus
using the GENEALEX 6.5 software package (Peakall and
Smouse 2012). We also used this program to assess Hardy–
J. N. Tedeschi et al.
Weinberg equilibrium and calculate the probability of
two different females having identical multilocus genotypes.
Observed and expected heterozygosity for the four loci for each
rookery were estimated with CERVUS 3.0.3 (Marshall et al.
1998). The presence of null alleles was tested at each locus in
only the 14 maternal genotypes from the DHI rookery using the
software package MICROCHECKER (Van Oosterhout et al.
2004); the sample size from the BB rookery was insufficient for
detecting null alleles with reliability.
We assessed paternity within each clutch sample using initial
inference, the GERUD 2.0 software package (Jones 2005), and
the COLONY 2.0 software package (Wang 2004; Wang and
Santure 2009). Neither GERUD 2.0 nor COLONY 2.0 require
population allele frequencies in order to calculate the minimum
number of sires (Jones 2005; Wang and Santure 2009), so these
packages were ideal for our purposes given that other adult
females from the rookeries were not sampled.
To evaluate paternity with initial inference we used the
maternal genotypes to identify maternal contributions to each
offspring and inferred paternal alleles by excluding maternal
alleles in the offspring genotypes (Jones et al. 2010). Multiple
paternity was determined when three or more non-maternal
alleles were found at a single locus. Since maternal genotypes
were not available for the GB rookery, we inferred maternal
allelic contribution based on the frequency of alleles in the
offspring within each clutch. The GERUD 2.0 analyses were
performed using all four loci with the parameter for the
maximum number of sires set to four. Runs were conducted with
and without maternal genotypes. When the GERUD program
returned multiple solutions for progeny arrays, they were ranked
by likelihood based on the segregation of paternal alleles and
their deviation from Mendelian expectations (Jones 2005). The
combination of sires with the highest probability score was used
to calculate the minimum number of sires for the clutch.
The COLONY analyses were also performed using all four
loci. COLONY assigns sibships and parentage based on a
maximum-likelihood model. Offspring are clustered by full-sib
and half-sib (maternal and paternal), and parent–offspring
relationships are determined, with parents assigned to full-sib
groups. Unknown genotypes for either parent can be inferred
(Wang 2004; Wang and Santure 2009). For each rookery, all
genotyped offspring were analysed in a single dataset to identify
any paternal half-sibs, which would indicate males that sired
offspring with more than one female. COLONY was set to the
default parameters, a single medium-length run, with fulllikelihood analysis, assuming polygamy for both males and
females. Parallel to the GERUD analysis, COLONY runs were
performed with and without maternal genotypes.
COLONY can estimate paternity with datasets containing
missing or rare alleles, but GERUD cannot. Offspring for which
maternal alleles or data were missing were therefore excluded
from the GERUD analysis. The reduced dataset for the DHI
rookery included genotypes for 14 females and 791 offspring; full
dataset included 813 offspring. For BB, the reduced dataset
was for 4 females and 60 offspring; full dataset included
62 offspring. Finally, for the GB rookery, the reduced dataset
included 84 offspring while the full dataset analysed included
92 offspring. Following the consensus approach proposed by
Theissinger et al. (2009) and Stewart and Dutton (2011), multiple
�Variable rates of paternity in loggerheads
Australian Journal of Zoology
paternity was identified in each clutch if two of the three
methods used had detected more than one sire.
Results
All four loci were polymorphic, with the number of alleles
per locus ranging from 6 to 22, with observed heterozygosity
ranging from 0.70 to 1.00 (Table 2). The probability of females
from the BB and DHI rookeries sharing a multilocus genotype
ranged from 1.6 � 10 2 to 7.5 � 10 2. Genotypic frequencies for
the DHI rookery at all loci were in agreement with
Hardy–Weinberg equilibrium (P > 0.05), and no null alleles were
detected.
The estimated proportions of multiple paternity varied
among rookeries (Table 3). On the basis of initial inference,
the frequency of multiple paternity was 25.0% (1 of 4 clutches)
at BB, 35.7% (5 of 14 clutches) at DHI and 85.7% (6 of 7
clutches) at GB. The mean minimum number of sires per
clutch estimated using initial inference ranged from 1.2 to 1.9
(Table 3).
Estimates of multiple paternity and the minimum number of
sires per clutch were slightly higher when calculations were
based on the GERUD and COLONY analyses. The frequency
of multiple paternity ranged from 25% (1 of 4) to 100% (7 of 7)
and the minimum number of sires per clutch ranged from 1.1 to
2.1 (Table 3). Nevertheless, a similar pattern to the initial
inference estimates was apparent, with both estimates for the
large rookery at DHI being closer to the lower range values. The
GERUD estimates of minimum number of sires per clutch
and frequency of multiple paternity were identical when
calculated with or without maternal genotypes. Two additional
instances of multiple paternity were detected in the COLONY
analyses when runs were conducted without maternal genotype
(Table 3).
Reconstructed paternal genotypes from GERUD and
COLONY agreed six out of the 12 instances (50%) where
multiple paternity was determined across the three rookeries.
The analyses indicated that 16–25 individual males sired
offspring in the clutches sampled from the DHI rookery (n = 14),
Table 2. Descriptive statistics of the four polymorphic microsatellite
markers
n, sample size; A, mean number of alleles per locus; HO, observed
heterozygosity; HE, expected heterozygosity
Rookery
n
Locus
Allele size
range (bp)
A
HO
HE
791
Cc8E07
Cc5F01
Cc7C04
Cc7B07
248–299
115–178
184–233
212–304
13
18
14
22
0.901
0.886
0.804
0.833
0.873
0.916
0.862
0.915
Bungelup (BB)
60
Cc8E07
Cc5F01
Cc7C04
Cc7B07
248–291
116–169
192–233
216–304
9
11
6
13
0.883
0.967
0.700
1.000
0.827
0.891
0.769
0.909
Gnaraloo (GB)
84
Cc8E07
Cc5F01
Cc7C04
Cc7B07
248–315
115–190
188–233
216–308
13
15
11
17
0.833
0.917
0.905
0.940
0.885
0.929
0.844
0.911
Dirk Hartog (DHI)
E
5 males sired offspring in the clutches from BB (n = 4), and
11–15 males sired offspring in the clutches from the GB rookery
(n = 7). None of the males were identical across the three
rookeries. Where maternal genotypes were known, the
probability of two males from the BB and DHI rookeries sharing
a multilocus genotype ranged from 5.5 � 10 2 to 9.2 � 10 3.
Where the maternal genotype was not known, the probability of
two males from all three rookeries sharing a multilocus
genotype ranged from 1.6 � 10 2 to 9.2 � 10 3.
Discussion
At three C. caretta rookeries in Western Australia, females laid
clutches that were sired by multiple males 25–86% of the time
during peak nesting periods between 2011 and 2013. This result
is consistent with estimates of multiple paternity in populations
of C. caretta from the Northern Hemisphere and eastern
Australia, where rates of 25–33% are typical (Table 1).
The highest rate of multiple paternity was found at Gnaraloo
Bay (GB) where multiple males sired 86% of clutches
(assuming paternal genotypes were correctly deduced from
correctly inferred maternal genotypes). It is unclear why such a
high rate of multiple paternity should occur in a low-nesting
rookery such as GB, although the size of the offshore breeding
area occupied by males and females may impact the nesting
density, and hence male–female encounters. For example,
Zbinden et al. (2007) reported that 93% of C. caretta clutches
from the Laganas Bay rookery on Zakynthos Island in Greece
exhibited multiple paternity. They attributed this rate to the
small size of the bay that bordered the nesting beach, which
confined the population and increased densities of breeding
males and females. Lasala et al. (2013) also report a high rate of
multiple paternity (75%) for nests on Wassaw Island, Georgia.
The authors suggest that this may be due to a large number of
males migrating along the coastline and crossing nesting beach
boundaries. The GB rookery is situated on a wide and open bay
with near-continuous fringing reef (Short 2005; Hattingh et al.
2011), so it is plausible that the high rate of multiple paternity
found at this rookery is a result of large numbers of males
migrating along the fringing reefs. However, as we do not
know how much of the offshore area comprises the breeding
grounds, tracking of sea turtles in the water during the breeding
season would indicate the density of turtles at sea, and permit
estimation of the probability of male–female encounters
(Schofield et al. 2013).
In contrast to the rookery at GB, the frequency of multiple
paternity was lower in clutches sampled from the BB (25%)
and DHI (36%) rookeries. Although the estimate of low
multiple paternity for the BB rookery may reflect the relatively
small clutch and offspring sample sizes, this was not the case for
DHI, where sample sizes and the number of clutches analysed
were comparatively large (see Table 1). Uller and Olsson (2008)
proposed that, all else being equal, the degree of multiple
paternity should be positively correlated with the probability of
mate encounters. If this model applies to C. caretta in Western
Australia, it would imply that male density is higher in the
centre of the species’ Western Australian distribution. However,
additional survey and molecular work would be required to
verify this possibility.
�F
Australian Journal of Zoology
J. N. Tedeschi et al.
Table 3. Minimum number of sires per clutch in C. caretta as estimated by initial inference, GERUD 2.0, and COLONY 2.0 runs with and without
maternal genotype
Multiple paternity (MP) was concluded when at least two of the three methods detected a minimum of two sires per clutch (shown in bold). Percentages
(% MP) and mean values (� s.e.m.) of estimated rates of multiple paternity are indicated for each method across all clutches analysed
Rookery
DHI
Clutch
No. of embryos
analysed
(clutch size)
Initial
inference
A
B
C
D
E
F
G
H
J
L
M
N
P
R
41 (45)
60 (69)
37 (42)
45 (46)
52 (58)
53 (62)
50 (54)
61 (62)
71 (72)
73 (77)
55 (56)
73 (75)
65 (69)
55 (58)
1
2
1
2
1
1
1
1
1
2
1
2
1
2
1
3
1
2
1
1
3
1
1
3
1
3
1
3
1
3
1
2
1
1
3
1
1
3
1
3
1
3
1
2
1
1
1
1
1
1
1
1
1
2
1
1
1
2
2
1
1
2
1
1
1
1
1
2
1
1
N
Y
N
Y
N
N
N
N
N
Y
N
Y
N
Y
35.7% (5/14)
1.26 ± 0.13
42.9% (6/14)
1.79 ± 0.26
42.9% (6/14)
1.79 ± 0.26
14.3% (2/14)
1.14 ± 0.10
28.6% (4/14)
1.29 ± 0.13
35.7% (5/14)
1
2
1
1
1
2
1
1
1
2
1
1
1
2
1
1
1
2
1
1
N
Y
N
N
25% (1/4)
1.25 ± 0.25
25% (1/4)
1.25 ± 0.25
25% (1/4)
1.25 ± 0.25
25% (1/4)
1.25 ± 0.25
25% (1/4)
1.25 ± 0.25
25% (1/4)
% MP
Mean
BB
A
C
D
H
11 (11)
18 (19)
14 (14)
17 (18)
% MP
Mean
GB
A
B
C
D
F
G
H
% MP
14 (15)
10 (11)
12 (12)
10 (10)
13 (20)
13 (15)
12 (14)
GERUD 2.0
Without
With
maternal
maternal
genotype
genotype
COLONY 2.0
Without
With
maternal
maternal
genotype
genotype
Multiple
paternity?
2
1
2
1
2
2
3
2
2
2
2
2
2
3
3
2
1
1
1
1
2
Y
Y
Y
N
Y
Y
Y
71.4% (5/7)
100% (7/7)
42.9% (3/7)
85.7% (6/7)
We found no evidence of a relationship between rookery
size and the incidence of multiple paternity as has been
reported elsewhere in sea turtles (Lee 2008). The C. caretta
rookery at DHI is one of the largest in the world (Baldwin et al.
2003; Reinhold and Whiting 2014), but has one of the lowest
rates of multiple paternity reported. Phillips et al. (2013, 2014b)
found a similar pattern in a population of hawksbill turtles
(Eretmochelys imbricata) nesting in the Seychelles Islands.
They found a high number of males contributing to the clutches
sampled (47 males fertilised 43 clutches), but the frequency of
multiple paternity was low (9.3%), which they attributed to a
low rate of mate encounter over a widely dispersed breeding
area (Phillips et al. 2013, 2014b). The lack of a relationship
between rookery size and rates of multiple paternity might also
reflect a declining number of males associated with feminisation
of primary sex ratios due to climate change (Wright et al. 2012b;
Hawkes et al. 2014). However, no data on the trends in male
abundance in this genetic stock are available to support this
assumption.
If rookery topography is not a factor in determining the
frequency of multiple paternity at GB, perhaps population
demographics can explain this high estimate. Fitzsimmons et al.
(1997a) found that both male and female green turtles
(C. mydas) in eastern Australia exhibit similar levels of
philopatry to their native beaches. If this behaviour is also
common to loggerhead turtles in Western Australia, the high rate
of multiple paternity occurring at the GB rookery may reflect a
greater number of males returning to breed than at the DHI and
BB rookeries. Alternatively, more male offspring may be
produced at the GB rookery. Tentative support for this idea
comes from a study that compared empirical and modelled nest
temperatures at each of our three study rookeries, where the midrange GB rookery had cooler beach temperatures relative to the
two range-edge rookeries at DHI and BB (Woolgar 2012).
�Variable rates of paternity in loggerheads
Hence, as C. caretta has temperature-dependent sex
determination, with males being produced at cooler incubation
temperatures (Miller 1985; Standora and Spotila 1985;
Mrosovsky 1994), the GB rookery, at the centre of the species’
range, may produce relatively more male offspring than at the
other two rookeries studied (see Woolgar et al. 2013). This, in
turn, could drive differences in the OSRs of each nesting
population. Further, male-mediated gene flow is promoted by
mating on migration routes and possibly feeding grounds
(Fitzsimmons et al. 1997b), which may contribute to sex ratio
differences between rookeries, especially if females and males
travel different routes (Fitzsimmons et al. 1997b; Wright et al.
2012b). Measuring nest incubation temperatures across years to
assess long-term changes in hatchling sex ratios (Laloë et al.
2014) in combination with long-term genetic monitoring of the
nesting females will show whether the pattern we observed for
these three rookeries is temporally stable, and our data can be
used as a baseline for determining whether OSRs change
over time.
Two common methods for estimating OSRs in sea turtle
populations are to count the number of females and males
encountered along a transect (Hays et al. 2010) or to estimate
paternal contributions of clutches sampled from nesting beaches
(Stewart and Dutton 2011; Hawkes et al. 2014). OSRs change as
the nesting season progresses, as males and females arrive at
breeding grounds at different times, have different periods of
residence, and different remigration intervals (Limpus 1993;
Godley et al. 2002; Hays et al. 2010, 2014). As the remigration
interval for male C. caretta is shorter than for females, future
scenarios of climate change may not decrease population
viability even with increased feminisation of offspring (Hays
et al. 2010; Phillips et al. 2014b; but see Wright et al. 2012a).
As long as males return frequently to breeding grounds,
fertilisation success should be stable (Hays et al. 2010; Wright
et al. 2012b). Hence, healthy and genetically diverse
populations should be able to absorb a reduction in males given
the polyandrous nature of sea turtles, but periodic monitoring of
OSRs (e.g. every 5–10 years) is critical for detecting ratios that
could reduce population viability.
In summary, it is clear that multiple paternity is the normal
mating system in most species of sea turtle, and that rates vary by
species, population, and by the method of detection (Bowen and
Karl 2007). Despite the lack of a maternal genotype for one of
our three rookeries, all methods used in this study led us to
conclude that multiple paternity rates ranged from 25 to 86%
in C. caretta clutches sampled from Western Australian
rookeries. Additional samples from BB and GB (including
maternal tissue), as well as from the Muiron Islands at the
northern limit of the nesting range, would be valuable for
assessing whether our estimates of the rates of multiple paternity
are representative of the Western Australian population. Further,
reconstruction of the genotypes of males that successfully
mated with females, as we did in this study, allows the indirect
estimation of the number of males contributing to this
population and hence more realistic estimation of the adult
population size. The rates of multiple paternity we have detected
provide a snapshot of the mating system of the Western
Australian population, and it will be important to repeat our
sampling in order to detect changes in OSRs over time.
Australian Journal of Zoology
G
Acknowledgements
We thank the Editor and two anonymous reviewers for providing comments
that significantly improved the quality of an earlier version of the manuscript.
We thank the Western Australian Department of Parks and Wildlife (DPaW)
turtle-monitoring program coordinators and staff at Shark Bay and Cape
Range National Parks for facilitating our access to the rookeries and for
outstanding logistical support, in particular Dave Holley, Dave Charles, Chris
McMonagle, Peter Barnes and Keely Markovina. We also thank the many
turtle-monitoring volunteers from DPaW for their assistance in the field. Paul
Richardson, Karen Hattingh and the 2011 Gnaraloo Turtle Monitoring team
are also thanked for their assistance with our fieldwork. Sherralee Lukehurst
and Yvette Hitchen provided considerable guidance and support for our
molecular work. This study was conducted under licenses SF007689,
SF008414, SF009051 and SF009392 issued by the Western Australian
Department of Parks and Wildlife, and was approved by the UWA Animal
Ethics Committee (3/100/968, 3/100/1046, 3/100/1081, and 3/100/1195).
References
Baldwin, R., Hughes, G. R., and Prince, R. I. T. (2003). Loggerhead turtles in
the Indian Ocean. In ‘Loggerhead Sea Turtles’. (Eds B. E. Bolten and
A. B. Witherington.) pp. 218–234. (Smithsonian Books: Washington,
DC.)
Bollmer, J. L., Irwin, M. E., Rieder, J. P., and Parker, P. G. (1999). Multiple
paternity in loggerhead turtle clutches. Copeia 1999, 475–478. doi:10.23
07/1447494
Bowen, B., and Karl, S. (2007). Population genetics and phylogeography of
sea turtles. Molecular Ecology doi:10.1111/j.1365-294X.2007.03542.x
Crim, J. L., Spotila, D., Spotila, J. R., O’Connor, M., Reina, R., Williams, C. J.,
and Paladino, F. V. (2002). The leatherback turtle, Dermochelys coriacea,
exhibits both polyandry and polygyny. Molecular Ecology 16,
4886–4907.
Dutton, P., Bixby, E., and Davis, S. K. (2000). Tendencey towards single
paternity in leatherbacks detected with microsatellites. In ‘Proceedings
of the Eighteenth International Symposium on Sea Turtle Biology
and Conservation’. (Eds F. A. Abreu-Grobois, R. Briseno-Duenas,
R. Marquez, and L. Sarti.) p. 39. NOAA Technical Memorandum NMFSSEFSC-436. Technical Information Service, Springfield, Virginia.
Ekanayake, E. M. L., Kapurusinghe, T., Saman, M. M., Rathnakamura, D. S.,
Samaraweera, P., Ranawana, K. B., and Rajakaruna, R. S. (2013).
Paternity of green turtle (Chelonia mydas) clutches laid in Kosgoda,
Sri Lanka. Herpetological Conservation and Biology 8, 27–36.
Fitzsimmons, N. N. (1998). Single paternity of clutches and sperm storage
in the promiscuous green turtle (Chelonia mydas). Molecular Ecology 7,
575–584. doi:10.1046/j.1365-294x.1998.00355.x
Fitzsimmons, N. N., Limpus, C. J., Norman, J. A., Goldizen, A. R., Miller,
J. D., and Moritz, C. (1997a). Philopatry of male marine turtles inferred
from mitochondrial DNA markers. Proceedings of the National Academy
of Sciences of the United States of America 94, 8912–8917. doi:10.10
73/pnas.94.16.8912
Fitzsimmons, N. N., Moritz, C., Limpus, C. J., Pope, L., and Prince, R.
(1997b). Geographic structure of mitochondrial and nuclear gene
polymorphisms in Australian green turtle populations and male-biased
gene flow. Genetics 147, 1843–1854.
Godley, B. J., Broderick, A. C., Fraunstein, R, Glen, F, and Hays, G. C. (2002).
Reproductive seasonality and sexual dimorphism in green turtles.
Molecular Ecology Progress Series 226, 125–133. doi:10.3354/meps22
6125
Harry, J. L., and Briscoe, D. A. (1988). Multiple paternity in the loggerhead
turtle (Caretta caretta). The Journal of Heredity 79, 96–99.
Hattingh, K., Boureau, M., Duffy, M., and Wall, M. (2011). Gnaraloo Turtle
Conservation Program. Gnaraloo Bay Rookery, Final Report, Program
2010/11. Day monitoring program with night checks and crab burrow
surveys. 20 July 2011. Gnaraloo Station Trust, Western Australia.
�H
Australian Journal of Zoology
Hawkes, L. A., Broderick, A. C., Godfrey, M. H., Godley, B. J., and Witt,
M. J. (2014). The impacts of climate change on marine turtle reproductive
success. In ‘Coastal Conservation’. (Eds B. Masalo and J. L. Lockwood.)
pp. 287–310. (Cambridge University Press: Cambridge.)
Hays, G. C., Fossette, S., Katselidis, K. A., Schofield, G., and Gravenor, M. B.
(2010). Breeding periodicity for male sea turtles, operational sex ratios,
and implications in the face of climate change. Conservation Biology 24,
1636–1643. doi:10.1111/j.1523-1739.2010.01531.x
Hays, G. C., Mazaris, A. D., and Schofield, G. (2014). Different male vs.
female breeding periodicity helps mitigate offspring sex ratio skews in
sea turtles. Frontiers in Marine Science 1, 1–9. doi:10.3389/fmars.2014.
00043
Hoekert, W. E. J., Neuféglise, H., Schouten, A. D., and Menken, S. B. J.
(2002). Multiple paternity and female-biased mutation at a mirosatellite
locus in the Olive Ridley sea turtle (Lepidochelys olivacea). Heredity
89, 107–113. doi:10.1038/sj.hdy.6800103
Ireland, J. S., Broderick, A. C., Glen, F., and Godley, B. J. (2003). Multiple
paternity assessed using microsatellite markers, in green turtles Chelonia
mydas (Linnaeus, 1758) of Ascension Island, south Atlantic. Journal of
Experimental Marine Biology and Ecology 291, 149–160. doi:10.1016/
S0022-0981(03)00118-7
Jensen, M. P., Abreu-Grobois, F. A., Frydenberg, J., and Loeschcke, V.
(2006). Microsatellites provide insight into contrasting mating
patterns in arribada vs. non-arribada Olive Ridley sea turtle rookeries.
Molecular Ecology 15, 2567–2575. doi:10.1111/j.1365-294X.2006.
02951.x
Jensen, M. P., Fitzsimmons, N. N., and Dutton, P. H. (2013). Molecular
genetics of sea turtles. In ‘Biology of Sea Turtles. Vol III’. (Eds
J. Wyneken, K. J. Lohmann, and J. A. Musick) pp. 155–182. (CRC Press:
Boca Raton, FL.)
Jones, A. G. (2005). Gerud 2.0: a computer program for the reconstruction
of parental genotypes from half-sib progeny arrays with known or
unknown parents. Molecular Ecology Notes 5, 708–711. doi:10.1111/
j.1471-8286.2005.01029.x
Jones, A. G., Small, C. M., Paczolt, K. A., and Ratterman, N. L. (2010). A
practical guide to methods of parentage analysis. Molecular Ecology
Resources 10, 6–30. doi:10.1111/j.1755-0998.2009.02778.x
Joseph, J., and Shaw, P. W. (2011). Multiple paternity in egg clutches of
hawksbill turtles (Eretmochelys imbricata). Conservation Genetics 12,
601–605. doi:10.1007/s10592-010-0168-7
Kichler, K., Holder, M. T., Davis, S. K., Márquez-M, R., and Owens, D. W.
(1999). Detection of multiple paternity in the Kemp’s Ridley turtle with
limited sampling. Molecular Ecology 8, 819–830. doi:10.1046/j.1365294X.1999.00635.x
Laloë, J.-O., Cozens, J., Renom, B., Taxonera, A., and Hays, G. C. (2014).
Effects of rising temperature on the viability of an important sea
turtle rookery. Nature Climate Change 4, 513–518. doi:10.1038/
nclimate2236
Lara-De La Cruz, L. I., Nakagawa, K. O., Cano-Camacho, H., Zavala-Paramo,
M. G., Vazquez-Marrufo, G., and Chassin-Noria, O. (2010). Detecting
patterns of fertilization and frequency of multiple paternity in Chelonia
mydas of Colola (Michoacán, Mexico). Hidrobiológica 20, 85–89.
Lasala, J. A., Harrison, J. S., Williams, K. L., and Rostal, D. C. (2013).
Strong male-biased operational sex ratio in a breeding population of
loggerhead turtles (Caretta caretta) inferred by paternal genotype
reconstruction analysis. Ecology and Evolution 3, 4736–4747. doi:10.10
02/ece3.761
Lee, P. L. M. (2008). Molecular ecology of sea turtles: new approaches and
future directions. Journal of Experimental Marine Biology and Ecology
356, 25–42. doi:10.1016/j.jembe.2007.12.021
Lee, P. L. M., and Hays, G. C. (2004). Polyandry in a sea turtle: females
make the best of a bad job. Proceedings of the National Academy of
Sciences of the United States of America 101, 6530–6535. doi:10.1073/
pnas.0307982101
J. N. Tedeschi et al.
Limpus, C. J. (1993). The green turtle, Chelonia mydas, in Queensland:
breeding males in the southern Great Barrier Reef. Wildlife Research 20,
513–523. doi:10.1071/WR9930513
Marshall, T. C., Slate, J., Kruuk, L. E. B., and Pemberton, J. M. (1998).
Statistical confidence for likelihood-based paternity. Molecular Ecology
7, 639–655. doi:10.1046/j.1365-294x.1998.00374.x
Miller, J. D. (1985). Embryology of marine turtles. In ‘Biology of the
Reptilia. Vol. 14’. (Eds C. Gans, F. Billet, and P. Maderson.)
pp. 269–328. (John Wiley and Sons: New York.)
Moore, M. K., and Ball, R. M. Jr. (2002). Multiple paternity in loggerhead
turtle (Caretta caretta) nests on Melbourne Beach, Florida: a
microsatellite analysis. Molecular Ecology 11, 281–288. doi:10.1046/
j.1365-294X.2002.01426.x
Mrosovsky, N. (1994). Sex ratios of sea turtles. The Journal of Experimental
Zoology 270, 16–27. doi:10.1002/jez.1402700104
Pacioni, C., Trocini, S., Heithaus, M., Burkholder, D., Thomson, J., Warren,
K., and Krutzen, M. (2012). Preliminary assessment of the genetic profile
of the Western Australian loggerhead turtle population using
mitochondrial DNA. In ‘Proceedings of the First Western Australian Sea
Turtle Symposium’. p. 19. Department of Parks and Wildlife, Government
of Western Australia.
Peakall, R., and Smouse, P. E. (2012). GenAlEx 6.5: genetic analysis in
Excel. Population genetic software for teaching and research – an update.
Bioinformatics 28, 2537–2539. doi:10.1093/bioinformatics/bts460
Peare, T., and Parker, P. G. (1996). Local genetic structure within two
rookeries of Chelonia mydas (the green turtle). Heredity 77, 619–628.
doi:10.1038/hdy.1996.189
Pearse, D. E., and Avise, J. C. (2001). Turtle mating systems: behaviour,
sperm storage, and genetic paternity. The Journal of Heredity 92,
206–211. doi:10.1093/jhered/92.2.206
Phillips, K. P., Jorgensen, T. H., Jolliffe, K. G., Jolliffe, S.-M., Henwood, J.,
and Richardson, D. S. (2013). Reconstructing paternal genotypes to infer
patterns of sperm storage and sexual selection in the hawksbill turtle.
Molecular Ecology 22, 2301–2312. doi:10.1111/mec.12235
Phillips, K. P., Jorgensen, T. H., Jolliffe, K. G., and Richardson, D. S. (2014a).
Potential inter-season sperm storage by a female hawksbill turtle. Marine
Turtle Newsletter 140, 13–14.
Phillips, K. P., Mortimer, J. A., Jolliffe, K. G., Joregensen, T. H., and
Richardson, D. S. (2014b). Molecular techniques reveal cryptic life
history and demographic processes of a critically endangered marine
turtle. Journal of Experimental Marine Biology and Ecology 455, 29–37.
doi:10.1016/j.jembe.2014.02.012
Reinhold, L., and Whiting, A. (2014). High-density loggerhead sea turtle
nesting on Dirk Hartog Island, Western Australia. Marine Turtle
Newsletter 141, 7–10.
Rieder, J. P., Parker, P. G., Spotila, J. R., and Irwin, M. E. (1998). The mating
system of the leatherback turtle: a molecular approach. In ‘Proceedings of
the Sixteenth Annual Symposium on Sea Turtle Biolgy and
Conservation’. (Eds R. Byles and Y. Fernandez.) pp. 120–121. NOAA
Technical Memorandum NMFS-SEFSC-412. National Technical
Information Service, Springfield, Virginia.
Sakaoka, K., Yoshii, M., Okamoto, H., Sakai, F., and Nagasawa, K. (2011).
Sperm utilization patterns and reproductive success in captive
loggerhead turtles (Caretta caretta). Chelonian Conservation and
Biology 10, 62–72. doi:10.2744/CCB-0878.1
Schofield, G., Scott, R., Dimadi, A., Fossette, S., Katselidis, K. A.,
Koutsoubas, D., Lilley, M. K. S., Pantis, J. D., Karagouni, A. D., and Hays,
G. C. (2013). Evidence-based marine protected area planning for a highly
mobile endangered marine vertebrate. Biological Conservation 161,
101–109. doi:10.1016/j.biocon.2013.03.004
Shamblin, B. M., Faircloth, B. C., Dodd, M., Wood-Jones, A., Castleberry,
S. B., Carroll, J. P., and Nairn, C. J. (2007). Tetranucleotide microsatellites
from the loggerhead sea turtle (Caretta caretta). Molecular Ecology Notes
7, 784–787. doi:10.1111/j.1471-8286.2007.01701.x
�Variable rates of paternity in loggerheads
Australian Journal of Zoology
Shine, R. (2005). Life-history and evolution in reptiles. Annual Review of
Ecology Evolution and Systematics 36, 23–46. doi:10.1146/annurev.
ecolsys.36.102003.152631
Short, A. D. (2005). Gnaraloo Bay. In ‘Beaches of the Western Australian
Coast – Eucla to Roebuck Bay: A Guide to Their Nature, Characteristics,
Surf and Safety’. pp. 322–323. (Sydney University Press: Sydney.)
Standora, E. A., and Spotila, J. R. (1985). Temperature dependent sex
determination in sea turtles. Copeia 1985, 711–722. doi:10.2307/1444
765
Stewart, K. R., and Dutton, P. H. (2011). Paternal genotype reconstruction
reveals multiple paternity and sex ratios in a breeding population of
leatherback turtles (Dermochelys coriacea). Conservation Genetics 12,
1101–1113. doi:10.1007/s10592-011-0212-2
Sunnucks, P., and Hales, D. F. (1996). Numerous transposed sequences of
mitochondrial cytochrome oxidase I–II in aphids of the genus Sitobion
(Hemiptera: Aphididae). Molecular Biology and Evolution 13, 510–524.
doi:10.1093/oxfordjournals.molbev.a025612
Theissinger, K., Fitzsimmons, N. N., Limpus, C. J., Parmenter, C. J., and
Phillott, A. D. (2009). Mating system, multiple paternity and effective
population size in the endemic flatback turtle (Natator depressus) in
Australia. Conservation Genetics 10, 329–346. doi:10.1007/s10592-0089583-4
Trocini, S. (2013). Health assessment and hatching success of two Western
Australian loggerhead turtle (Caretta caretta) populations. Ph.D. Thesis,
Murdoch University, Perth.
Uller, T., and Olsson, M. (2008). Multiple paternity in reptiles: patterns and
processes. Molecular Ecology 17, 2566–2580. doi:10.1111/j.1365-294X.
2008.03772.x
Van Oosterhout, C., Hutchinson, W. F., Wills, D. P. M., and Shipley, P.
(2004). Micro-Checker: software for identifying and correcting
genotyping errors in microsatellite data. Molecular Ecology Notes 4,
535–538. doi:10.1111/j.1471-8286.2004.00684.x
I
Wang, J. (2004). Sibship reconstruction from genetic data with typing errors.
Genetics 166, 1963–1979. doi:10.1534/genetics.166.4.1963
Wang, J., and Santure, A. W. (2009). Parentage and sibship inference from
multilocus genotype data under polygamy. Genetics 181, 1579–1594.
doi:10.1534/genetics.108.100214
Woolgar, L. (2012). A comparison of two techniques used to model
sand temperatures and sex ratios at loggerhead turtle (Caretta caretta)
rookeries in Western Australia. M.Sc. Thesis, The University of Western
Australia, Perth.
Woolgar, L., Trocini, S., and Mitchell, N. (2013). Key parameters describing
temperature-dependent sex determination in the southernmost
population of loggerhead sea turtles. Journal of Experimental Sea
Biology and Ecology 449, 77–84. doi:10.1016/j.jembe.2013.09.001
Wright, L. I., Fuller, W. J., Godley, B. J., McGowan, A., Tregenza, T., and
Broderick, A. C. (2012a). Reconstruction of paternal genotypes over
multiple breeding seasons reveals male green turtles do not breed
annually. Molecular Ecology 21, 3625–3635. doi:10.1111/j.1365-294X.
2012.05616.x
Wright, L. I., Stokes, K. L., Fuller, W. J., Godley, B. J., McGowan, A., Snape,
R., Tregenza, T., and Broderick, A. C. (2012b). Turtle mating patterns
buffer against disruptive effects of climate change. Proceedings of the
Royal Society B: Biological Sciences 279, 2122–2127. doi:10.1098/
rspb.2011.2285
Zbinden, J. A., Largiadèr, C. R., Leippert, F., Margaritoulis, D., and Arlettaz,
R. (2007). High frequency of multiple paternity in the largest rookery
of Mediterranean loggerhead sea turtles. Molecular Ecology 16,
3703–3711. doi:10.1111/j.1365-294X.2007.03426.x
Handling Editor: Paul Cooper
www.publish.csiro.au/journals/ajz
�
 Nicola Mitchell