HIV/AIDS
MAJOR ARTICLE
Corticosteroid Therapy, Vitamin D Status,
and Inflammatory Cytokine Profile in the
HIV-Tuberculosis Immune Reconstitution
Inflammatory Syndrome
Anali Conesa-Botella,1,2,3 Graeme Meintjes,1,4,5,6 Anna K. Coussens,7 Helen van der Plas,6 Rene Goliath,1
Charlotte Schutz,1,5 Rodrigo Moreno-Reyes,8 Meera Mehta,3 Adrian R. Martineau,4,7,9 Robert J. Wilkinson,1,4,5,6,7
Robert Colebunders,2,3 and Katalin A. Wilkinson1,6,7
1
Clinical Infectious Diseases Research Initiative, Institute of Infectious Diseases and Molecular Medicine, University of Cape Town, Observatory, South
Africa; 2Department of Clinical Sciences, Institute of Tropical Medicine, 3Epidemiology and Social Medicine, University of Antwerp, Belgium; 4Division
of Medicine, Imperial College London, United Kingdom; 5Infectious Diseases Unit, GF Jooste Hospital, Manenberg, 6Department of Medicine,
University of Cape Town, Observatory, South Africa; 7Division of Mycobacterial Research, MRC National Institute for Medical Research, London,
United Kingdom; 8Department of Nuclear Medicine, Erasme Hospital, Free University of Brussels, Belgium; and 9Centre for Primary Care and Public
Health, Queen Mary University of London, United Kingdom
Background. Tuberculosis-immune reconstitution inflammatory syndrome (TB-IRIS) in patients coinfected
with human immunodeficiency virus (HIV) and tuberculosis starting antiretroviral therapy (ART) is associated
with hypercytokinemia. As adjunctive corticosteroid therapy and vitamin D have immunomodulatory properties,
we investigated the relationship between cytokine/chemokine profiles, corticosteroid use, and vitamin D deficiency
in TB-IRIS patients.
Methods. Plasma from 39 TB-IRIS and 42 non-IRIS patients was collected during a prospective study of
HIV-associated tuberculosis patients starting ART. In total, 26% of patients received corticosteroid (CTC) therapy
pre-ART for severe tuberculosis. Concentrations of total 25-hydroxyvitamin D (25(OH)D) and 14 cytokines/chemokines were determined at ART initiation and 2 weeks later.
Results. Patients prescribed concurrent CTC had lower interferon γ (IFN-γ), IP-10, tumor necrosis factor (TNF),
interleukin (IL)-6, IL-8, IL-10, IL-12p40, and IL-18 pre-ART (P ≤ .02). TB-IRIS presented at 12 days (median) of ART,
irrespective of CTC use. In patients who developed TB-IRIS (not on CTC) IL-6, IL-8, IL-12p40, IL-18, IP-10, and TNF
increased during 2 weeks (P ≤ .04) of ART. Vitamin D deficiency (total 25(OH)D <75 nmol/L) was highly prevalent
(89%) at baseline. Although vitamin D deficiency at either baseline or 2 weeks was not associated with TB-IRIS, in
those not on CTC the median 25(OH)D decreased during 2 weeks (P = .004) of ART. Severe vitamin D deficiency
(total 25(OH)D <25 nmol/L) was associated with higher baseline TNF, IL-6, and IL-8 irrespective of IRIS status.
Conclusions. CTC modifies the inflammatory profile of those who develop TB-IRIS. The association between
severe vitamin D deficiency and elevated proinflammatory cytokines support a study of vitamin D supplementation in
HIV-TB co-infected patients starting ART.
Received 22 February 2012; accepted 5 June 2012; electronically published 19
June 2012.
Correspondence: Katalin A. Wilkinson, PhD, Institute of Infectious Disease and
Molecular Medicine, Clinical and Infectious Disease Research Initiative, Observatory 7925, Cape Town, South Africa (Katalin.Wilkinson@uct.ac.za).
Clinical Infectious Diseases 2012;55(7):1004–11
© The Author 2012. Published by Oxford University Press on behalf of the Infectious
Diseases Society of America. All rights reserved. For Permissions, please email: journals.permissions@oup.com. This is an Open Access article distributed under the terms
of the Creative Commons Attribution Non-Commercial License (http://creative
commons.org/licenses/by-nc/3.0), which permits unrestricted non-commercial use, distribution, and reproduction in any medium, provided the original work is properly cited.
DOI: 10.1093/cid/cis577
1004
•
CID 2012:55 (1 October)
•
HIV/AIDS
Africa accounts for 82% of the global human immunodeficiency virus type 1 (HIV-1) associated tuberculosis
burden [1]. Combined antiretroviral therapy (ART) rollout has grown steadily, with 54% of HIV-infected tuberculosis patients started on ART in South Africa [1].
When HIV-1-infected persons start ART, the resulting
rise in CD4 count and improved immune function partially restore pathogen specific immunity [2]. However,
8%–43% of patients will experience paradoxical
�deterioration, termed tuberculosis-associated immune reconstitution inflammatory syndrome (TB-IRIS) [3, 4]. Initiating
ART at lower CD4 count and advanced tuberculosis disease
are the main factors associated with this syndrome [4]. We
have previously shown an association between increased circulating proinflammatory cytokines (tumor necrosis factor
[TNF], interleukin [IL]-6, and interferon γ [IFN-γ]) and
TB-IRIS [5]. Corticosteroids (CTC) are antiinflammatory
molecules, which have an inhibitory effect on proinflammatory T-cells while stimulating antiinflammatory and regulatory
T cells [6]. Our randomized placebo-controlled trial of prednisone for the treatment of paradoxical TB-IRIS showed reduced
duration of hospitalization and therapeutic procedure numbers,
as well as hastened improvements in TB-IRIS symptoms, and
more rapid reduction in C-reactive protein (CRP) [7].
We also recently showed that vitamin D deficiency is highly
prevalent in Cape Town and is associated with active tuberculosis in both HIV-uninfected and infected patients, in whom
the association is stronger [8]. Others have shown that patients
with tuberculosis have significantly lower 25-hydroxyvitamin
D (25(OH)D) levels than those without in Tanzania and West
Africa [9, 10]. These findings are supported by the requirement of 25(OH)D for activating an IFN-γ mediated antimicrobial effector pathway via induction of antimicrobial peptide
synthesis and autophagy in human monocytes and macrophages [11], highlighting the importance of adequate amounts
of 25(OH)D for sustaining innate and acquired immunity
against infections. In vitro, 1,25-dihydroxyvitamin D has
also been shown to inhibit leukocyte secretion of IL-6,
IL-12p40, and IFN-γ, while inducing IL-10 [12–14] and
regulatory T-cell polarisation [15], suggesting that one of
its primary roles is to prevent chronic inflammation and limit
immunopathology.
As TB-IRIS has been associated with hypercytokinemia and
both HIV and tuberculosis treatment are known to interfere
with vitamin D metabolism [16, 17], we hypothesised that
vitamin D deficiency may be associated with TB-IRIS development. We therefore assessed the prevalence of vitamin D deficiency in a cohort of HIV-1 and tuberculosis coinfected
patients in Cape Town and investigated the relationship
between 25(OH)D and plasma cytokines/chemokines and TBIRIS development, in patients stratified by CTC use.
development of TB-IRIS and gave written informed consent
for inclusion in the study. Patients with available plasma at
both baseline and week 2 of ART (81 of 105 enrolled) were
included in this study. Our sample was representative of the
entire cohort. The University of Cape Town Research Ethics
Committee approved the study (REC 049/2009).
Definitions
Tuberculosis diagnosis was based on smear or culture positivity. Where this was negative or unavailable, diagnosis according to World Health Organization (WHO) guidelines for
smear-negative or extrapulmonary tuberculosis in HIV-1infected persons [18]. TB-IRIS was diagnosed according to a
published case definition [4]. “Non-IRIS” patients were IRISfree during the 3-month follow-up period. Severe vitamin D
deficiency was defined as total 25(OH)D ≤25 nmol/L, moderate as 25(OH)D between 25 and 50 nmol/L, and suboptimal
as 25(OH)D between 50 and 75 nmol/L [19]. Severe TB-IRIS
was defined by the presence of at least 4/8 symptoms from the
following categories: neurological, pulmonary, abdominal, increase or occurrence of new lymph nodes, presence of effusion
(pulmonary, cardiac, or ascites), occurrence of fever, a heart
rate above 120, and level of CRP above the median of 93 mg/L.
Sampling and Laboratory Assays
MATERIALS AND METHODS
Plasma was obtained at the start of ART and 2 weeks postinitiation and stored at −80°C for batched analysis. Total plasma
25(OH)D (25(OH)D2 and 25(OH)D3) was measured by radioimmunoassay (DiaSorin) in duplicate. Quality control was
performed by the vitamin D External Quality Assurance
Survey (DEQAS, www.deqas.org). To assess the association
between vitamin D status and hypercytokinemia, 14 cytokines/chemokines were measured based on our previous
study [5], in 39 IRIS and 38 non-IRIS patients with available
sample. Granulocyte-macrophage colony-stimulating factor
(GM-CSF), IFN-α2, Interferon gamma-induced protein 10 (IP10), macrophage inflammatory protein (MIP)-1α, MIP-1β,
TNF, IFN-γ, IL-2, IL-6, IL-8, IL-10, IL-12p40, and IL-17 were
quantified on the Bio-Plex platform (Bio-Rad Laboratories,
Hercules, United States), using customized Milliplex kits
(HCYTMAG-60K, Millipore, Missouri) and IL-18 by enzymelinked immunosorbent assay (ELISA; Medical&Biological Laboratories, Japan). Cytokine concentrations below the limit of
detection (LOD) were considered zero.
Study Population
Statistical Analysis
HIV-1-tuberculosis coinfected patients admitted to Brooklyn
Chest Hospital (Cape Town, South Africa) for severe tuberculosis, started ART while on tuberculosis treatment in the ward
between June 2009 and December 2010. All were inpatients
and monitored closely for 12 weeks after starting ART for
Statistical analyses were performed using Stata software
(version 10.2; StataCorp, Texas) and GraphPad Prism software
(version 5; GraphPad, San Diego, California). Baseline characteristics, 25(OH)D and cytokine levels were summarized
by count and proportion (%) or median with interquartile
HIV/AIDS
•
CID 2012:55 (1 October)
•
1005
�range (IQR). Normality was assessed using graphical procedures. All P values reported were 2-sided at α of 0.05. Differences between patient groups were assessed by Fisher exact
test for proportions, and Mann-Whitney U test for medians.
Differences in cytokine and 25(OH)D concentrations were
compared using Mann-Whitney U test or Wilcoxon signed
rank test for paired data.
Table 1.
Baseline Characteristics
Variablea
Non-IRIS
(n = 42)
16 (41)
33.7 (28–42)
17 (40)
33.5 (27–43)
January–March
April–June
4 (10)
9 (23)
4 (10)
9 (21)
RESULTS
July–September
17 (44)
20 (48)
9 (23)
9 (21)
Patient Characteristics
September–
December
In total, 39 of 81 patients developed IRIS during the longitudinal follow-up at 12 days median (IQR: 7–19) into ART. All
patients were on nonnucleoside reverse transcriptase inhibitor
(NNRTI)-based regimen: an NRTI backbone and either Efavirenz (n = 79) or Nevirapine (n = 2). Eight persons in the
IRIS group and 13 in the non-IRIS group were prescribed
adjunctive corticosteroid therapy (CTC) in addition to tuberculosis treatment before starting ART (Flow chart, Supplementary Figure 1). No difference was observed between the
IRIS and non-IRIS groups with regard to baseline study variables (Table 1). Baseline 25(OH)D concentrations were not
different among the 4 seasons.
Effect of Corticosteroids on Baseline Characteristics
CTC were prescribed to tuberculosis patients with life-threatening symptoms (thus severe tuberculosis) for median 33 days
(IQR: 25–38) in TB-IRIS and 41 days (IQR: 26–50) in nonIRIS (P = .298) before starting ART. The numbers of TB-IRIS
cases in both groups were comparable (CTC: 38.1%, nonCTC: 51.7%; P = .287). Both groups were also clinically
similar, with the only baseline characteristic significantly different being the method of tuberculosis diagnosis: in the CTC
group, more individuals were diagnosed by radiological identification (67%) rather than sputum culture (28%) or sputum
smear (5%), compared with the non-CTC group, where diagnosis was predominantly by culture (51%) rather than radiological identification (37%) or sputum smear (12%), P = .020.
Patients who received CTC pre-ART had significantly lower
baseline plasma concentrations of IL-6, IL-8, IL-10, IL-12p40,
IL-18, IFN-γ, IP-10, and TNF (P ≤ .016), compared with the
non-CTC group (Table 2). Because of this significant effect of
CTC on the cytokine profile of patients, we stratified the data
by CTC administration in further analyses.
Male sex
Age, years
IRIS
(n = 39)
Time of sampling
P
b
.960
.587
.952
TB treatment to ARTc
(days)
Viral load
(copies × 104/mL)
36 (27–61)
34 (23–56)
67 (20.3–130)
47 (14.5–160) .865
CD4 baseline (cells/mm3)
TB diagnosis
80 (31–132)
67 (33.5–118) .508
.942
Radiological
17 (43)
19 (45)
Sputum smear
Cultured AFB/MTB
3 (8)
19 (49)
5 (12)
18 (43)
5 (13)
6 (15)
7 (17)
11 (26)
28 (72)
24 (57)
4 (10)
6 (14)
Type TB
PTB
EPTB
PTB + EPTB
WHO stage
3
4
Pre-ART hospitalization,d
days
Corticosteroids pre-ART
Time on
corticosteroids, days
.809
.207
.584
35 (90)
36 (86)
18 (12–26)
14 (11–21)
9 (23)
33 (25–38)
.153
13 (31)
.429
41 (26–50)
.298
Abbreviations: AFB, acid fast bacilli; ART, antiretroviral therapy; EPTB,
extrapulmonary tuberculosis; IRIS, immune reconstitution inflammatory
syndrome; MTB, Mycobacterium tuberculosis; PTB, pulmonary tuberculosis;
TB, tuberculosis; WHO, World Health Organization,
a
Data are No. (%) or median interquartile range.
b
P values determined by Fisher exact test for proportions, and Mann–
Whitney for medians.
c
Time between the start of TB treatment and the start of ART.
d
Time of hospitalization before starting ART.
TB-IRIS patients also showed a trend for shorter hospitalization time after starting ART, compared with those who
received CTC: median, 92 days (IQR, 77–119) vs 130 days
(IQR, 107–146), P = .078.
Plasma Cytokines in TB-IRIS and Non-IRIS
Clinical Manifestation of IRIS in CTC and Non-CTC Groups
Although our study was not designed to analyse the differences in clinical outcome between the CTC and non-CTC groups,
we noted a trend for patients not on CTC to present with
more severe TB-IRIS clinical presentation, compared with patients on CTC (10/31, 32% vs 0/8, 0%); P = .082). Non-CTC
1006
•
CID 2012:55 (1 October)
•
HIV/AIDS
We previously demonstrated an association between increased
cytokine concentrations and TB-IRIS in a cross-sectional
study at week 2 post-ART [5]. We therefore wished to establish whether differences also existed during ART and determined the plasma concentration of 14 cytokines/chemokines
before and at 2 weeks of ART.
�Table 2. Baseline Plasma Cytokine ( pg/mL) and 25(OH)D
(nmol/L) Concentrations in Patients Who Were on Corticosteroid
Treatment or not on Corticosteroids Before Starting ART
Variablea
CTC (n = 21)
25(OH)Dc
25.5 (19.0–38.0)
28.2 (21.1–38.7)
.360
IFN-α2
47.9 (20.4–74.5)
45.9 (16.8–96.6)
.894
IFN-γ
IP-10
5.8 (1.6–15.2)
3194 (2105–5577)
19.0 (5.9–45.3)
6328 (4078–11 156)
MIP-1α
0 (0–20.2)
MIP-1β
TNF
29.7 (19.9–44.2)
22.8 (15.2–36.6)
Non-CTC (n = 56)
15.7 (0–33.8)
32.6 (25.8–55.2)
43.7 (30.0–61.5)
5.5 (0–13.8)
P
b
.004
<.001
.124
.197
<.001
IL-6
0 (0–3.6)
IL-8
IL-10
13.8 (8.4–20.5)
9.0 (4.1–15.3)
22.7 (17.0–45.7)
19.9 (9.0–29.6)
.005
.001
.016
IL-12p40
IL-18
0 (0–3.9)
1129 (853–1376)
15.5 (0–37.3)
1893 (1447–2834)
.002
.003
Abbreviations: CTC, corticosteroid; IFN, interferon; IL, interleukin; IP,
inflammatory protein; MIP, macrophage inflammatory protein; TNF, tumor
necrosis factor.
a
Data are median interquartile range.
b
P values determined by Mann-Whitney test.
c
n for 25(OH)D: CTC, n = 21; non-CTC, n = 60.
GM-CSF, IL-2, and IL-17 had median concentrations below
the limit of detection and were not included in statistical analyses. Patients not on CTC who developed TB-IRIS showed
higher baseline IFN-γ (P = .050), whereas those who received
CTC and developed TB-IRIS showed higher IL-8 concentrations (P = .037) and a trend toward lower baseline IFN-α2
(P = .054; Figure 1 and Supplementary Table 1). At week 2 of
ART, in the non-CTC group, TNF (P = .003), IFN-γ
(P = .004), IL-6 (P = .008), and IL-8 (P = .014) were significantly higher in TB-IRIS patients than non-IRIS. In patients
who received CTC, there were no significant differences
between TB-IRIS and non-IRIS (Figure 1).
During the first 2 weeks of ART, TB-IRIS patients not on
CTC showed a significant increase in IL-6, IL-8, IL-12p40, IL18, IP-10, MIP-1β, and TNF (P ≤ .036), whereas non-IRIS patients showed increased MIP-1α (P = .023) and MIP-1β (P
< .001). Conversely, patients on CTC who developed TB-IRIS
showed no significant cytokine increase during the 2 weeks of
ART, whereas non-IRIS patients showed significantly increased MIP-1β (P = .03) and decreased IL-18 (P = .050,
Figure 1, Supplementary Table 1). Comparing IRIS patients
on CTC with those not on CTC, the increase in TNF, IL-8,
Figure 1. Cytokine concentrations in immune reconstitution inflammatory syndrome (IRIS; filled circles) and non-IRIS (open circles) patients: A–H, not
on CTC (nIRIS = 31, nnonIRIS = 26); I–L, on CTC therapy (nIRIS = 8, nnonIRIS = 12). Line at median. Statistical test: Mann-Whitney (not paired data) and
Wilcoxon signed rank test ( paired data); significant P values are indicated on the graph. Abbreviations: IFN, interferon; IL, interleukin; IP, inflammatory
protein; LOD, limit of detection; MIP, macrophage inflammatory protein; TNF, tumor necrosis factor.
HIV/AIDS
•
CID 2012:55 (1 October)
•
1007
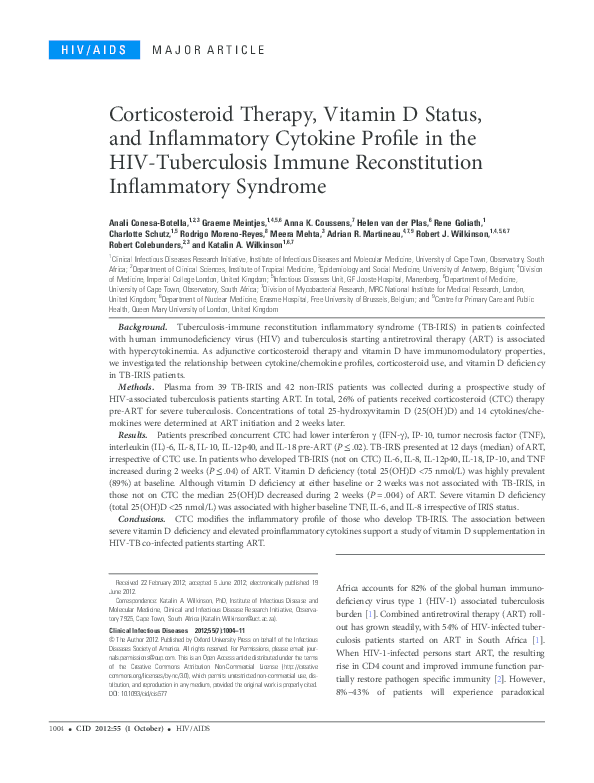
�Figure 2. Baseline vitamin D status for all patients (n = 81). Dotted
lines indicate the threshold for severe vitamin D deficiency (25(OH)D <25
nmol/L), moderate vitamin D deficiency (25(OH)D: 25–50 nmol/L), suboptimal 25(OH)D levels (25(OH)D: 50–75 nmol/L), and vitamin D sufficiency
(25(OH)D >75 nmol/L).
We next analysed plasma 25(OH)D concentrations during
the first 2 weeks of ART, stratified by CTC status (Figure 3).
There was no baseline difference in 25(OH)D between patients
who developed TB-IRIS and those who did not, irrespective of
CTC use. However, 25(OH)D showed a slight, but statistically
significant, decrease during the first 2 weeks of ART in those
who developed TB-IRIS and did not receive CTC: from 24.7
nmol/L (IQR 19.7–37.2) at day 0 to 22.5 nmol/L (IQR 19.2–
29.0) at 2 weeks, P = .004. At week 2 of ART, 25(OH)D was
significantly lower in non-CTC TB-IRIS patients compared to
non-IRIS patients: 22.5 nmol/L (IQR 19.2–29.0) vs 28.0 nmol/L
(IQR 24.0–33.7), P = .026. Consistent with the limited change
in cytokine profile in those who received CTC and developed
TB-IRIS, these patients also had no significant change in 25
(OH)D levels at week 2 of ART.
Association Between 25(OH)D Deficiency and Plasma Cytokines
and IL-18 during the first 2 weeks of ART was more pronounced in patients not on CTC (Supplementary Table 2).
We also compared the difference in cytokine concentrations
between week 2 and baseline (delta change). Patients not on
CTC who developed TB-IRIS had significantly increased IL-6,
IL-8, IL-18, and TNF (P ≤ .012). Conversely, in patients on
CTC, there was only a trend for decreased IL-10 in patients
who developed TB-IRIS (P = .064).
Relationship of Vitamin D Deficiency to TB-IRIS
and Corticosteroid Therapy
Vitamin D deficiency was highly prevalent: only 3 of 81 patients (3.7%) had optimal vitamin D levels (Figure 2). Severe
deficiency was observed in 37 of 81 patients (45.7%), moderate
deficiency in 35 of 81 patients (43.2%) and the remaining 6 of
81 patients (7.4%) had suboptimal levels of 25(OH)D. CTC
had no effect on baseline vitamin D status (Table 2).
Due to the observation that non-CTC TB-IRIS patients
showed a further decrease in 25(OH)D levels during ART and
that these patients had a significant increase in the concentration of a number of cytokines/chemokines at the development
of TB-IRIS, we next investigated if there was an association
between severe vitamin D deficiency (<25 nmol/L) and plasma
cytokine/chemokine concentrations in the non-CTC subgroup. Figure 4A–D shows the 4 cytokines that were associated
with vitamin D status, in non-CTC patients. Patients who
were severely vitamin D deficient had higher concentrations of
IL-8 and IL-18 (P ≤ .038) and a trend for higher IL-6
(P = .052) at baseline compared to non–severely deficient
patients, and this difference was maintained at week 2 of ART
for IL-8 (P = .030). There was a significant increase in plasma
TNF and IL-8 in the severely vitamin D deficient
patients during 2 weeks of ART (P ≤ .039), and a trend for
IL-6 (P = .068). At 2 weeks the number of TB-IRIS patients in
Figure 3. 25(OH)D concentration in patients who developed immune reconstitution inflammatory syndrome (IRIS; filled circles) or did not develop IRIS
(open circles) at baseline and after 2 weeks on antiretroviral therapy (A) in patients who did not receive corticosteroids nIRIS = 31, nnonIRIS = 29 and
(B ) in patients prescribed corticosteroids nIRIS = 8, nnonIRIS = 13. Solid line at median; dotted line indicates severe vitamin D deficiency. Statistical test:
Mann-Whitney (unpaired data) and Wilcoxon signed rank test ( paired data); significant P values are indicated on the graph.
1008
•
CID 2012:55 (1 October)
•
HIV/AIDS
�Figure 4. Cytokine concentrations stratified by severe vitamin D deficiency (25(OH)D <25 nmol/L, nbaseline = 15 immune reconstitution inflammatory
syndrome (IRIS; filled triangles) and 11 non-IRIS (open triangles), nweek2 = 20 IRIS and 7 non-IRIS) or nonsevere vitamin D deficiency (25(OH)D >25 nmol/
L, nbaseline = 15 IRIS and 15 non-IRIS, nweek2 = 10 IRIS and 19 non-IRIS) in patients who did not receive adjunctive corticosteroid therapy. Line at median.
P values determined by Mann-Whitney test for medians. Abbreviations: IL, interleukin; LOD, limit of detection; TNF, tumor necrosis factor.
the severely vitamin D deficient group was proportionally
higher than in the non–severely deficient group (20/27, 74%
vs 10/29, 34.5%, P = .003). Therefore, we conducted the same
analysis focusing on TB-IRIS patients only (Figure 4E–4H, not
on CTC): there was no difference in cytokine levels between
patients with 25(OH)D <25 nmol/L compared to >25 nmol/L,
at both time points. However, IL-6, IL-8, and TNF significantly increased during ART in both groups. This suggests
that vitamin D deficiency is likely to arise as a consequence of
TB-IRIS, rather than the cause.
DISCUSSION
We confirmed in a longitudinal study that increased circulating cytokines/chemokines associate with TB-IRIS. We also
report a very high prevalence of vitamin D deficiency in our
prospective cohort of hospitalised HIV-1-TB coinfected patients in Cape Town. Although we found that vitamin D deficiency is not a risk factor for TB-IRIS development, the
patients who develop TB-IRIS and do not receive CTC have a
further reduction in circulating 25(OH)D levels in the first 2
weeks of ART, with lower 25(OH)D concentrations compared
to non-IRIS, and a concomitant increase in circulating inflammatory cytokines/chemokines.
A recent study in HIV-1-infected women showed that 25
(OH)D sufficiency protected against all-cause mortality and
HIV-1 disease progression [20]. Only 3.7% patients in our
cohort had sufficient levels of 25(OH)D, comparable to the
findings described in our recent study on vitamin D in Cape
Town, not including IRIS patients [8]. Even taking into
account a median hospitalisation time of 2 weeks before their
baseline 25(OH)D was measured (which is less than the halflife of 25(OH)D [21]), suggests that at least 46% of patients
severely deficient at this time, were also deficient upon
hospitalization.
Because we previously demonstrated in a cross-sectional
study that TB-IRIS associates with hypercytokinaemia [5],
here we aimed to confirm this in a longitudinal study and determine when hypercytokinemia arose. As 26% of patients
were on adjunctive CTC therapy for severe tuberculosis before
starting ART, and CTC significantly reduced baseline plasma
cytokine levels, we stratified our data according to CTC use.
We found that 25(OH)D significantly decreased during the
first 2 weeks of ART in patients not on CTC who developed
TB-IRIS. Although the absolute magnitude of the drop in
25(OH)D was small, it may reflect a real biological phenomenon. We and others have previously demonstrated a
decrease in 25(OH)D concentrations in HIV-infected persons
HIV/AIDS
•
CID 2012:55 (1 October)
•
1009
�on NNRTI-based regimens [22–24]. In the present study, all
patients were on NNRTI-based regimen as well as on tuberculosis treatment. The fall in plasma 25(OH)D levels observed in
this study could be partly attributable to the interference of
ART and anti-tuberculosis therapy with vitamin D metabolism [25, 26].
Various explanations have been proposed as to why HIVinfected persons have lower vitamin D status [27]: (1) increased use of 25(OH)D for maturation and proliferation of T
lymphocytes during HIV infection; and (2) increased cytokine
levels, specifically TNF, blocking the stimulatory effect of parathyroid hormone on the production of the hormonally active
vitamin D (1,25-dihydroxyvitamin D, 1,25(OH)2D). Although
these explanations may account for the drop in 25(OH)D, it is
also possible that ART initiation in a patient who still has
high tuberculosis antigen load, despite starting antituberculosis therapy over activates macrophages and dendritic cells to
produce 1,25(OH)2D locally, stimulated by the reconstituting
T helper cell-produced IFN-γ [11]. Interestingly, baseline
IFN-γ was significantly higher in TB-IRIS compared to nonIRIS patients not on CTC. Increased production of 1,25
(OH)2D will then induce catabolism of 25(OH)D and 1,25
(OH)2D through their catabolising enzyme CYP24A1. This
phenomenon has been used to explain the low 25(OH)D associated with granulomatous diseases where activated macrophages convert 25(OH)D to 1,25(OH)2D [19]. Confirmation
of this hypothesis would be measuring 1,25(OH)2D and
vitamin catabolites in plasma, resulting from systemic spillover, but this was not performed in our study due to limited
sample volume.
We found that TB-IRIS was associated with lower 25(OH)D
and higher cytokine concentrations 2 weeks following ART in
those not receiving CTC and that these differences did not
exist at baseline. The increased concentrations of IL-6, IL-8,
IL-18, and TNF at TB-IRIS presentation are in line with our
previous cross-sectional study [5] and also support the role for
neutrophils (IL-8) and natural killer (NK) cells (IL-18) in the
pathogenesis of IRIS [28]. Moreover, we showed that IL-8 and
IL-18 concentrations were significantly higher in severely 25
(OH)D deficient patients at baseline. However, although
Figure 4 shows a correlation between high cytokine levels and
lower vitamin D in the whole cohort, there is no correlation
between severe vitamin D deficiency and hypercytokinemia
within TB-IRIS patients. This suggests that the rise in cytokines in TB-IRIS patients is not due to decreased 25(OH)D
after starting ART. In fact, it may be that lower 25(OH)D in
IRIS patients is a consequence of the combination of 25(OH)
D consumption during hypercytokinemia and an interaction
between tuberculosis therapy and ART with vitamin D metabolism. Thus, although decreased 25(OH)D may not be the
cause of TB-IRIS, it may contribute to the continued
1010
•
CID 2012:55 (1 October)
•
HIV/AIDS
hyperinflammatory response. Indeed, 1,25(OH)2D has been
shown to inhibit neutrophil chemotaxis, degranulation, and
oxidative burst in response to chemokines such as IL-8, via
the complement fragment C5a [29, 30]. Moreover, 1,25
(OH)2D inhibits the production of proinflammatory cytokines
via inhibition of intracellular pathways, such as the p38 signaling for IL-6 or the NF-κB complex pathway for IL-8 [31].
Therefore, a continued increase in neutrophil activation and
cytokine production would be seen in absence of sufficient
conversion of 25(OH)D toward 1,25(OH)2D.
Finally, the different immunological profiles observed
between those who received corticosteroids compared to those
who did not, suggests there might be different immunological
triggers leading to TB-IRIS development. From all patients receiving CTC pre-ART, 38% developed TB-IRIS despite decreased CTC-induced plasma cytokine concentrations.
Clinically, there was a trend toward less severe clinical manifestation of TB-IRIS in these patients but longer time of hospitalization from the start of ART. The latter could be explained by
the fact that CTC was mainly prescribed to patients requiring
intensive medical care. Future studies should therefore stratify
patients according to CTC use, when investigating immunological correlates of IRIS risk and disease manifestation.
In conclusion, we found vitamin D deficiency not to be a
risk factor for developing TB-IRIS, but patients developing
TB-IRIS become more severely vitamin D deficient after 2
weeks of ART, while they also develop hypercytokinemia. Due
to an association between IL-6, IL-8, and IL-18 with vitamin
D status at baseline, together with the in vitro evidence of
antiinflammatory and the antimycobacterial properties of
vitamin D, the role of 25(OH)D and its active form 1,25
(OH)2D should be further elucidated in TB-IRIS. Future work
should identify what is triggering the reduction in 25(OH)D,
whether this correlates with increased 1,25(OH)2D and
whether 25(OH)D reduction occurs before or after hypercytokinemia and the onset of IRIS symptoms. An approach would
be to supplement patients with vitamin D prior to initiation
of ART and to determine if this decreases TB-IRIS incidence.
Supplementary Data
Supplementary materials are available at Clinical Infectious Diseases online
(http://cid.oxfordjournals.org). Supplementary materials consist of data
provided by the author that are published to benefit the reader. The
posted materials are not copyedited. The contents of all supplementary
data are the sole responsibility of the authors. Questions or messages
regarding errors should be addressed to the author.
Notes
Acknowledgments. We are grateful to Dr M. X. Rangaka, P. Mouton,
and M. Abrahams for their help in recruiting patients. We also would like
to acknowledge B. Hauquier for vitamin D testing and R. Titus for compiling baseline patient data.
�Financial support. A. C.-B. holds a PhD student award from the
Flemish Interuniversity council (VLIR-UOS). This study was funded by
the Wellcome Trust (084323, 088316, 090677, 081667), MRC
(U.1175.02.002.00014.01), and the Department of Health, South Africa.
Potential conflicts of interest. All authors: No reported conflicts.
All authors have submitted the ICMJE Form for Disclosure of Potential
Conflicts of Interest. Conflicts that the editors consider relevant to the
content of the manuscript have been disclosed.
15.
16.
References
17.
1. World Health Organization (WHO). Global Tuberculosis Control
report 2011. Geneva, Switzerland: WHO, 2011.
2. Wilkinson KA, Seldon R, Meintjes G, et al. Dissection of regenerating
T-Cell responses against tuberculosis in HIV-infected adults sensitized
by Mycobacterium tuberculosis. Am J Respir Crit Care Med 2009;
180:674–83.
3. Muller M, Wandel S, Colebunders R, Attia S, Furrer H, Egger M.
Immune reconstitution inflammatory syndrome in patients starting
antiretroviral therapy for HIV infection: a systematic review and metaanalysis. Lancet Infect Dis 2010; 10:251–61.
4. Meintjes G, Lawn SD, Scano F, et al. Tuberculosis-associated immune
reconstitution inflammatory syndrome: case definitions for use in resource-limited settings. Lancet Infect Dis 2008; 8:516–23.
5. Tadokera R, Meintjes G, Skolimowska KH, et al. Hypercytokinaemia
accompanies HIV-tuberculosis immune reconstitution inflammatory
syndrome. Eur Respir J 2011; 37:1248–59.
6. Dimeloe S, Nanzer A, Ryanna K, Hawrylowicz C. Regulatory T cells,
inflammation and the allergic response: the role of glucocorticoids
and vitamin D. J Steroid Biochem Mol Biol 2010; 120:86–95.
7. Meintjes G, Wilkinson RJ, Morroni C, et al. Randomized placebocontrolled trial of prednisone for paradoxical tuberculosis-associated
immune reconstitution inflammatory syndrome. AIDS 2010; 24:
2381–90.
8. Martineau AR, Nhamoyebonde S, Oni T, et al. Reciprocal seasonal
variation in vitamin D status and tuberculosis notifications in Cape
Town, South Africa. Proc Natl Acad Sci U S A 2011; 108:19013–7.
9. Friis H, Range N, Pedersen ML, et al. Hypovitaminosis D is common
among pulmonary tuberculosis patients in Tanzania but is not explained by the acute phase response. J Nutr 2008; 138:2474–80.
10. Wejse C, Olesen R, Rabna P, et al. Serum 25-hydroxyvitamin D in a
West African population of tuberculosis patients and unmatched
healthy controls. Am J Clin Nutr 2007; 86:1376–83.
11. Fabri M, Stenger S, Shin DM, et al. Vitamin D is required for IFN-γmediated antimicrobial activity of human macrophages. Sci Transl
Med 2011; 3:104ra102.
12. Khoo AL, Joosten I, Michels M, et al. 1,25-Dihydroxyvitamin D(3)
inhibits proliferation but not the suppressive function of regulatory T
cells in the absence of antigen-presenting cells. Immunology 2011;
134:459–68.
13. Martineau AR, Wilkinson KA, Newton SM, et al. IFN-gamma- and
TNF-independent vitamin D-inducible human suppression of mycobacteria: the role of cathelicidin LL-37. J Immunol 2007; 178:7190–8.
14. Khoo AL, Chai LY, Koenen HJ, et al. Vitamin D(3) down-regulates
proinflammatory cytokine response to Mycobacterium tuberculosis
18.
19.
20.
21.
22.
23.
24.
25.
26.
27.
28.
29.
30.
31.
through pattern recognition receptors while inducing protective cathelicidin production. Cytokine 2011; 55:294–300.
Gregori S, Casorati M, Amuchastegui S, Smiroldo S, Davalli AM,
Adorini L. Regulatory T cells induced by 1 alpha,25-dihydroxyvitamin
D3 and mycophenolate mofetil treatment mediate transplantation tolerance. J Immunol 2001; 167:1945–53.
Cozzolino M, Vidal M, Arcidiacono MV, Tebas P, Yarasheski KE,
Dusso AS. HIV-protease inhibitors impair vitamin D bioactivation to
1,25-dihydroxyvitamin D. AIDS 2003; 17:513–20.
Schuster I. Cytochromes P450 are essential players in the vitamin D
signaling system. Biochim Biophys Acta 2011; 1814:186–99.
World Health Organization. TB-HIV: Improving the diagnosis and
treatment of smear-negative pulmonary and extrapulmonary tuberculosis among adults and adolescents. Recommendations for HIV-prevalent and resource-constrained settings. Stop TB Department, HIV/
AIDS, Tuberculosis and Malaria; World Health Organization, ed.
2006.
Holick MF. Vitamin D deficiency. N Engl J Med 2007; 357:266–81.
Mehta S, Giovannucci E, Mugusi FM, et al. Vitamin D status of HIVinfected women and its association with HIV disease progression,
anemia, and mortality. PLoS One 2010; 5:e8770.
Vieth R. Vitamin D supplementation, 25-hydroxyvitamin D concentrations, and safety. Am J Clin Nutr 1999; 69:842–56.
Conesa-Botella A, Florence E, Lynen L, Colebunders R, Menten J,
Moreno-Reyes R. Decrease of vitamin D concentration in patients
with HIV infection on a nonnucleoside reverse transcriptase inhibitor-containing regimen. AIDS Res Ther 2010; 7:40.
Mueller NJ, Fux CA, Ledergerber B, et al. High prevalence of
severe vitamin D deficiency in combined antiretroviral therapy-naive
and successfully treated Swiss HIV patients. AIDS 2010; 24:1127–34.
Van Den Bout-Van Den Beukel CJ, Fievez L, Michels M, et al.
Vitamin D deficiency among HIV type 1-infected individuals in the
Netherlands: effects of antiretroviral therapy. AIDS Res Hum Retroviruses 2008; 24:1375–82.
Yin M, Stein E. The effect of antiretrovirals on vitamin D. Clin Infect
Dis 2011; 52:406–8.
Epstein S, Shneider AE. Drug and hormones effects on vitamin D metabolism. In: Feldman D, Pike JW, Glorieux FH, eds. Vitamin D. 2nd
ed. Elsevier, 2005:1253–91.
Villamor E. A potential role for vitamin D on HIV infection? Nutr
Rev 2006; 64(5 Pt 1):226–33.
Conradie F, Foulkes AS, Ive P, et al. Natural killer cell activation distinguishes Mycobacterium tuberculosis-mediated immune reconstitution syndrome from chronic HIV and HIV/MTB coinfection. J Acquir
Immune Defic Syndr 2011; 58:309–18.
Binder R, Kress A, Kan G, Herrmann K, Kirschfink M. Neutrophil
priming by cytokines and vitamin D binding protein (Gc-globulin):
impact on C5a-mediated chemotaxis, degranulation and respiratory
burst. Mol Immunol 1999; 36:885–92.
Shah AB, DiMartino SJ, Trujillo G, Kew RR. Selective inhibition
of the C5a chemotactic cofactor function of the vitamin D binding
protein by 1,25(OH)2 vitamin D3. Mol Immunol 2006; 43:1109–15.
Krishnan AV, Feldman D. Mechanisms of the anti-cancer and antiinflammatory actions of vitamin D. Annu Rev Pharmacol Toxicol
2011; 51:311–36.
HIV/AIDS
•
CID 2012:55 (1 October)
•
1011
�
 A. Coussens