Beauducel, A., Kersting, M. & Liepmann, D. (2005). A multitrait-multimethod model for the measurement of
sensitivity to reward and sensitivity to punishment. Journal of Individual Differences, 26, 168-175.
A. BeauducelJournal
et al.: Model
of Individual
of Sensitivity
Differences
© 2005toHogrefe
Reward
2005; Vol.
&and
Huber
26(4):168–175
Pun
Publishers
ishment
A Multitrait-Multimethod
Model for the Measurement
of Sensitivity to Reward
and Sensitivity to Punishment
André Beauducel1, Martin Kersting2, and Detlev Liepmann3
1
Mannheim University, 2RWTH Aachen, 3Free University of Berlin, all Germany
Abstract. It was investigated whether sensitivity to reward and sensitivity to punishment as conceived in Gray’s (1991) Reinforcement Sensitivity Theory could be measured by means of a multitrait-multimethod (MTMM) model containing method
factors representing situational variance. On the basis of the similarities between sensitivity to reward and punishment with
promotion- and prevention-orientation, as discussed in the organizational context, the situational contexts were mainly chosen
from school and organization. A total of 347 German participants completed a 58-item questionnaire measuring sensitivity to
reward and punishment in the context of the team, of supervisors/instructors, and consumption. Confirmatory factor analysis
revealed a factor for sensitivity to reward, for sensitivity to punishment, and three situational context factors (team, supervisor/instructor, and consumption). Thus, the situational variance could be controlled by means of the MTMM design. Moreover, some
relations of sensitivity to reward and punishment with educational performance were found.
Keywords: reinforcement sensitivity theory, prevention-orientation, promotion-orientation, MTMM
Introduction
There have been several attempts to develop inventories
for the assessment of the dimensions of the Reinforcement
Sensitivity Theory (RST) from J.A. Gray (1991, 1994).
These developments were related to Gray’s (1987) idea
that impulsivity and anxiety are more fundamental dimensions than extraversion and neuroticism in the Eysenck
system (Eysenck, 1967). Impulsivity is regarded as representing primarily the activity of a neural system, the behavioral approach system (BAS), and anxiety is regarded
as representing primarily the activity of the behavioral inhibition system (BIS). The BAS reflects the sensitivity to
stimuli representing reward or the relief of punishment,
and the BIS reflects sensitivity to stimuli representing punishment or frustrative nonreward (Pickering et al., 1997).
In addition, Gray postulated a Fight/Flight System (FFS),
which is activated by the presence of unconditioned aversive stimuli. In a recent modification of the RST, the FFS
is called Fight-Flight-Freeze System (FFFS) and is responsible for mediating reactions to all aversive stimuli, conditioned and unconditioned (Gray & McNaughton, 2000).
Journal of Individual Differences 2005; Vol. 26(4):168–175
DOI 10.1027/1614-0001.26.4.168
It, thus, takes over most of the roles that were previously
attributed to the BIS. The BIS is responsible for the inhibition of behavior that might result in a goal conflict between approach and avoidance. As Corr (2004) notes, this
modification raises the question of which personality traits
now correspond to the FFFS, BAS, and BIS. The aim of
the present paper is the development of scales for the RST
in an applied setting. In light of the latest changes of the
RST, one should be careful with the naming of the scales.
It was, therefore, decided to only use the terms “sensitivity
to reward” (SR) and “sensitivity to punishment” (SP) for
the scales and to leave the question whether SP might be
primarily be related to the BIS (as was previously assumed) or to the FFFS (as is currently assumed) open for
further research.
Psychometric Measures of Gray’s
Dimensions
There have been several attempts to develop psychometric measures for the RST, especially for anxiety and im© 2005 Hogrefe & Huber Publishers
A. Beauducel et al.: Model of Sensitivity to Reward and Punishment
pulsivity. First, measures for impulsivity and anxiety
were developed on the basis of Eysenck’s extraversion
and neuroticism dimension as they are represented in the
Eysenck Personality Questionnaire (EPQ; Eysenck &
Eysenck, 1975). Subjects were classified in the four
quadrants according to their extraversion and neuroticism scores (Patterson, Kosson, & Newman, 1987). One
of the first measures that was developed in order to represent the RST dimensions more specifically was the
Gray Wilson Personality Questionnaire (GWPQ; Wilson, Barrett, & Gray, 1989). The GWPQ is based on six
scales designed to measure individual differences in the
BIS, the BAS, and the FFS. The six scales were intended
to measure the following behavior tendencies: Passive
Avoidance and Extinction (BIS), Active Avoidance and
Approach (BAS), and Fight and Flight (FFS). However,
the empirical six-factor structure did not correspond exactly to the intended structure (Wilson, Gray, & Barrett,
1990).
Carver and White (1994) presented a four-factor
structure that was the basis for the development of the
BIS/BAS-scales and contained a scale for the measurement of the BIS-sensitivity and a scale for the measurement of the BAS-sensitivity, which contain the three subscales Drive, Reward Responsiveness, and Fun Seeking.
Carver and White (1994) found that the three BAS factors loaded on a second-order factor representing BAS.
Jorm et al. (1999) replicated the four-factor structure in
an Australian sample. However, Heubeck, Wilkinson,
and Cologon (1998) could not replicate the four-factor
structure. The Heubeck et al. (1998) results pointed toward a two-factor structure with one factor representing
the BIS sensitivity and another factor representing the
BAS sensitivity. The results of Strobel, Beauducel, Debener, and Brocke (2001) were similar. They found only
weak evidence for the four-factor structure as it was presented in Carver and White (1994).
One reason for the problems with the development of
scales for the BIS- and BAS-sensitivity may be that the
RST is closely related to stimuli that represent reward or
punishment. There may be a considerable amount of individual differences in the interpretation and the relevance of stimuli. An example given in Torrubia, Ávila,
Moltó, and Caseras (2001) is that environmental influences could produce a different level of motivation for
money. These individual differences in the interpretation
of stimuli as representing reward or punishment may be
one reason for problems in the development of optimal
scales. Nevertheless, one may ask for rather general
events or stimuli and focus on the emotional reactions to
the stimuli. This was the strategy chosen by Carver and
White (1994). For example, a BIS-item like “I worry
about making mistakes” (Carver & White, 1994, p. 323,
Table 1) does not specify in which situation the mistakes
© 2005 Hogrefe & Huber Publishers
169
occur and does not specify the consequences to worry
about. The focus is on the worries resulting from the
mistakes. The strategy to focus on the emotions instead
of specific situations or reactions was successful, since
factors representing BIS- and BAS-sensitivity could be
established. On the other hand, it was not surprising that
Carver and White (1994) found strong correlations of the
BIS/BAS-scales with the Positive and Negative Affect
Scale (PANAS; Watson, Clark, & Tellegen, 1988), which
is only based on adjectives. The use of unspecific stimuli
leads to a reduction of the situation-specific variance in
the items. The missing specificity of the item content
may be one reason for the finding that the BIS/BAS
scales did not represent the expected relations with Eysenck’s extraversion and neuroticism dimension (Heubeck et al., 1998).
Torrubia et al. (2001) developed the Sensitivity to
Punishment and Sensitivity to Reward Questionnaire
(SPSRQ) as a measure of Gray’s anxiety and impulsivity
dimensions. They could establish two factors, one representing the Sensitivity to Punishment (SP) and the other
the Sensitivity to Reward (SR). As with the BIS/BAS
scales, the stimulus content of the items of the SP was
rather unspecific. On the other hand, the items of the SR
scale contained more specific rewards (e.g., money, sex,
social power, and approval). They assumed that the items
containing specific stimuli could be interpreted with less
ambiguity.
The Aim of the Present Study
The present study contains a further investigation of the
utility of more specific stimuli for the assessment of SP
and SR. The main idea of the present study is to treat the
specific stimulus variance as method variance within a
multitrait-multimethod (MTMM) design (Campbell &
Fiske, 1959). This is conceptually close to the approach
of van Heck, Perugini, Caprara, and Fröger (1994), even
though they formulated their ideas in the framework of
the generalizability theory (Cronbach, Gleser, Nanda, &
Rajaratnam, 1972). Moreover, the van Heck et al. (1994)
study was related to situational variance within the FiveFactor Model of Personality (Costa & McCrae, 1992),
whereas the present study investigates situational variance within the RST.
In order to treat the situational variance within the
MTMM approach it is necessary to establish factors that
represent the situational variance. Therefore, the situational variance must be substantial, and it is important to
find domains that may contain relevant stimuli and may,
therefore, lead to a substantial amount of situational variance.
Journal of Individual Differences 2005; Vol. 26(4):168–175
170
A. Beauducel et al.: Model of Sensitivity to Reward and Punishment
A domain leading to a substantial amount of situational variance, which may allow one to establish situational
factors, is the workplace and, for younger people, the
school or university. It is probably especially important
for people whether they receive reward or punishment at
their workplace or at school. There is already some evidence for the relevance of the sensitivity to reward and
punishment at work. For example, Higgins (1997) proposed a regulatory focus theory that was also discussed
in the context of industrial psychology (Brockner & Higgins, 2001). According to Higgins (1997), the nurturance-related focus leads to promotion-orientation,
whereas the security-related focus leads to preventionorientation. Regulatory focus theory suggests that the nature of the emotional consequences of goal attainment/nonattainment may be quite different, depending
on whether people are engaged in goal-directed behavior
with a promotion or prevention focus. From the description of the promotion-orientation one can derive that it is
related to rewarding stimuli, since nurturance-related
stimuli should be rewarding in general. Thus, the promotion-orientation should be related to a high sensitivity to
reward. The security-related focus has to do with the
avoidance of negative stimuli. Thus, the prevention-orientation should be related to the sensitivity to punishment. The parallelism of the motivational or regulatory
orientations with the stimulus sensitivities leads to the
assumption that different sensitivities to punishment and
reward may be important in the organizational and in the
instructional contexts.
The parallelism of the trait-oriented RST with the regulatory focus theory explains why the distinction between sensitivity to reward and sensitivity to punishment
was expected to be relevant in the organizational context.
However, it does not specify different types of rewarding
and punishing stimuli. Different stimulus types may be
expected on the basis of the following: It may be important whether the rewards or punishments come from colleagues at the same hierarchical level or whether they
come from supervisors or instructors. Some individuals
may have a special sensitivity to the rewards or punishments related to the team-level, and others may be more
sensitive to rewards or punishments coming from supervisors or instructors. This may be an interesting situational variance, which may be captured by corresponding situational factors. In order to enhance the situational
variance further it was decided to incorporate nonsocial
situations of consumer behavior (e.g., buying something).
To summarize, the structural hypothesis was that it
would be possible to measure SR, SP, as well as situational context or method factors for the team, the supervisors or instructors, and in a nonsocial consumer context within a MTMM or facet design.
Journal of Individual Differences 2005; Vol. 26(4):168–175
Method
Sample
The personality questionnaire was administered to 347
German participants (151 females) ranging from 17 to
34 years of age (M = 21.8; SD = 3.63). A small majority
(56%; n = 196) of the participants were male. The participants were volunteers recruited from a secondary
school in Berlin that comprised all conventional German
school levels and from the Free University of Berlin,
Germany. The investigation was anonymous, and in order to reduce the tendency toward faking good, the participants were not obliged to give complete demographic
information. Therefore, the exact information on the
school level was missing for 85 (24%) of the participants. A total of 113 (33%) participants were students,
and 21 (6%) of the participants were in classes that lead
to a diploma qualifying for university entrance. From the
remaining participants, 103 (30%) attended a comprehensive school grade that would not necessarily qualify
for university entrance, and 25 (7%) participants were in
classes leading to the lowest conventional German
school grade. The sample covers a large range of educational levels.
Material: The Work Reinforcement
Sensitivity Questionnaire (WRSQ)
The WRSQ was developed in the context of a larger personality test (START-P) that is composed of several
scales for the assessment of young individuals who are
beginning their professional career (Kersting & Beauducel, in press). START is a German test battery that
covers a large range of job relevant abilities, personality
characteristics, knowledge, and competencies such as
English language competence (START-E; Liepmann,
Nettelnstroth, Tartler, & Smolka, 2005).
The WRSQ items were written according to the following scheme: They contain an individual appraisal
component (e.g., “I am very unhappy”), a conditioning
component with statements pointing to reward, relief
from punishment, punishment (e.g., “when I am rejected”) or frustrative nonreward (e.g., “when I don’t get an
expected reward”), and a situational context component
(e.g., “in my team,” “from my instructor,” “when I buy
something”). The appraisal components can also contain
an indirect appraisal (e.g., “I try to avoid”).
The item components were arranged in Table 1 in a
way that is similar to a mapping sentence (Guttman &
Levy, 1991). A complete mapping sentence would require that each appraisal component is combined with
each conditioning component and with each situational
© 2005 Hogrefe & Huber Publishers
A. Beauducel et al.: Model of Sensitivity to Reward and Punishment
Table 1. Examples for the three-item components.
Appraisal
Conditioning
Situational context
I am very unhappy
to be rejected
team
I am very unhappy
to be rejected
supervisor/instructor
I am very unhappy
not to get back
lost things
It is important for me
to be accepted
team
It is important for me
to be accepted
supervisor/instructor
It is important for me
to get back
lost things
171
lief from punishment as well as the corresponding items
containing the punishment or frustrative nonreward.
Note that each item was entered in one scale representing
sensitivity to reward or sensitivity to punishment and in
another scale representing the situational context (team,
supervisor/instructor, or consumption). The items were
presented in form of a six-point rating scale ranging from
complete disagreement to complete agreement.
context component. However, this was not possible, because not all combinations would lead to meaningful
sentences. For example, it would not make sense to combine “it is important for me” with “to be rejected” and
with “by my team.” Even when there may be special
occasions where such items would make sense, these occasions would be so rare that such items were avoided.
Moreover, a complete combination of all the item components would lead to a very large questionnaire with
many repetitions.
The distribution of the 58 items on the different components was not equal (see Table 2). Reward and relief
from punishment should both activate the BAS, whereas
punishment and frustrative nonreward should both activate the BIS (Pickering et al., 1997). It was, therefore,
expected that the reward items would load on one factor
together with the relief from punishment items, and that
the punishment items would load on one factor with the
frustrative nonreward items. It should be possible to aggregate the corresponding items containing reward or re-
Statistical Analyses
Descriptive analysis, Cronbach’s α, and regression analysis was performed with SPSS for Windows, Release 11.
The hypotheses were tested by means of confirmatory
factor analyses based on maximum likelihood estimation
(Mplus 3.11; Muthén & Muthén, 2004). The confirmatory factor analyses were based on aggregates (parcels)
for each combination of the item components presented
in Table 2. Performing structural equation modeling on
the basis of theoretically justified parcels instead of single items has been recommended because the single
items contain a much larger amount of error variance
(Little, Cunningham, Shahar, & Widaman, 2002). In the
present case, the theoretical justification of the parcels is
based on the MTMM design. For example, the sum of
the raw scores of the four items representing reward in
the team context gives the aggregate “RewTea” (see Table 2). The next aggregate was given by the sum of five
items representing reward by supervisors/instructors
(RewSup; see Table 2), etc. In order to evaluate model fit, besides the χ² test, the comTable 2. Distribution of the items on the different components.
parative fit index (CFI), the root mean
square error of approximation (RMSEA),
Reward/punishment
Situational context
No. items
Aggregate label
and the standardized root mean square reReward
team
4
RewTea
sidual (SRMR) were reported.
Reward
supervisor/instructor 5
RewSup
Reward
consumption
5
RewCon
Relief from punishment
team
3
RpunTea
Relief from punishment
supervisor/instructor
5
RpunSup
Relief from punishment
consumption
5
RpunCon
Punishment
team
7
PunTea
Punishment
supervisor/instructor
7
PunSup
Punishment
consumption
7
PunCon
Frustrative nonreward
team
4
FnonTea
Frustrative nonreward
supervisor/instructor
3
FnonSup
Frustrative nonreward
consumption
3
FnonCon
Results
Note: The aggregate labels were formed according to the item components. Reward
by the team = RewTea; Reward by supervisors/instructors = RewSup; Reward from
consumption = RewCon; Relief from punishment by the team = RpunTea; Relief
from punishment by supervisors/instructors = RpunSup; Relief from punishment
from consumption = RpunCon; Punishment by the team = PunTea; Punishment by
supervisors/instructors = PunSup; Punishment from consumption = PunCon; Frustrative nonreward by the team = FnonTea; Frustrative nonreward by supervisors/instructors = FnonSup; Frustrative nonreward from consumption = FnonCon.
© 2005 Hogrefe & Huber Publishers
Table 3 shows the descriptive data and the
internal consistencies of the WRSQ scales.
Females had larger sensitivity raw scores in
all scales that are related to social stimuli,
but the mean difference between males and
females was not significant for the Consumption scale.
The confirmatory factor analysis was
performed according to the expected structure, that is, for each scale of the instrument
(SR, SP, Team, Supervisors, and Consumption) a factor was formed. The factors were
formed according to a facet or MTMM
Journal of Individual Differences 2005; Vol. 26(4):168–175
172
A. Beauducel et al.: Model of Sensitivity to Reward and Punishment
Table 3. Means (standard deviations) and Cronbach’s α for the WRSQ scales.
Scale
Males (N = 196)
Females (N = 151)
Difference
Cronbach’s α
SR
116.41 (17.49)
124.84 (12.95)
**
.90
SP
115.32 (17.68)
126.91 (15.72)
**
.87
63.68 (12.29)
73.00 (10.46)
**
.91
Team
Sup/Inst
83.33 (13.84)
94.48 (12.34)
**
.91
Con
79.56 (10.99)
78.97 (10.23)
ns
.79
Notes: Difference = differences by sex; scale labels: SR, Sensitivity to Reward; SP, Sensitivity to Punishment; Team, Sensitivity to reward
or punishment by the team; Sup/Inst, Sensitivity to reward or punishment by supervisors/instructors; Con, Sensitivity to reward or
punishment in consumption; **p < .001; ns, p > .05.
SR
.19
RewSup
.32
RpunSup
.41
.35
.21
PunSup
.37
.34
FnonSup
.34
RewTea
.38
RpunTea
.17
PunTea
.33
FnonTea
.61
RewCon
.39
RpunCon
.62
PunCon
.56
FnonCon
.57
.62
.71
.44
.56
.59
.41
.37
SP
.19
.18
.70
.54
.69
.56
.91
.70
.71
.81
.73
Team
.27
.50
.31
.58
.64
model. This means that each variable had one freely estimated loading on the SR or the SP factor and another
freely estimated loading on one of the context factors
(Team, Supervisors, Consumption). The remaining loadings were fixed at zero. In order to assure model identification the context factors were not allowed to correlate
with the SR and SP factors, and the factor variances were
fixed to unit variance. The data did not conform to the
multivariate normal distribution (χ² = 432.11; df = 2; p <
.001). Therefore, the Satorra-Bentler scaled χ² statistic
(Satorra & Bentler, 1994) was used as a basis for the
evaluation of model fit. This statistic was shown to work
effectively with nonnormal data when the sample size is
not large (Hu, Bentler, & Kano, 1992). On this basis, the
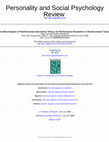
fit of the model presented in Figure 1 was acceptable
(χ² = 98.74; df = 38; p < .001; CFI = .97; RMSEA =
.068; SRMR = .051).
As expected, SP and SR could be shown together with
Journal of Individual Differences 2005; Vol. 26(4):168–175
Sup/Inst
Con
.10
Figure 1. Confirmatory factor analysis of
the WRSQ aggregates described in Table 2
(completely standardized solution). Variable labels: RewTea = Reward by the team;
RewSup = Reward by supervisors/instructors; RewCon = Reward from consumption; RpunTea = Relief from punishment
by the team; RpunSup = Relief from punishment by supervisors/instructors; RpunCon = Relief from punishment from consumption; PunTea = Punishment by the
team; PunSup = Punishment by supervisors/instructors; PunCon = Punishment
from consumption; FnonTea = Frustrative
nonreward by the team; FnonSup = Frustrative nonreward by supervisors/instructors; FnonCon = Frustrative nonreward
from consumption. Factor labels: SR, Sensitivity to Reward; SP, Sensitivity to Punishment; Team, Sensitivity to reward or
punishment by the team; Sup/Inst, Sensitivity to reward or punishment by supervisors/instructors; Con, Sensitivity to reward
or punishment in consumption.
the method factors corresponding to the situational context. Since the correlation between the factors Team and
Supervisors/Instructors was very high, it was investigated whether a single factor could account for the variance
explained by the two factors. Therefore, a model that
corresponds exactly to the previous model, but with a
single factor for Team and Supervisors/Instructors, was
tested. The fit of this model was still acceptable (χ² =
111.06; df = 40; p < .001; CFI = .96; RMSEA = .072;
SRMR = .050), however, the Satorra-Bentler scaled χ²difference test (see Satorra & Bentler, 2001) for the two
models was significant (χ²diff = 11.49; dfdiff = 2; p < .01),
indicating that the model with separate factors for Team
and Supervisors/Instructors had a more pronounced fit.
Thus, the intended model is supported by the data, even
when the differentiation between sensitivity to reward
and punishment by the team or supervisors/instructors is
rather weak.
© 2005 Hogrefe & Huber Publishers
A. Beauducel et al.: Model of Sensitivity to Reward and Punishment
A model containing only factors for SP and SR had a
poor fit (χ² = 300.04; df = 53; p < .001; CFI = .87;
RMSEA = .112; SRMR = .086) and the fit was significantly worse than the fit of the initial model containing
five factors (χ²diff = 201.05; dfdiff = 15; p < .01). A further
model containing only the three method factors Team,
Supervisors/Instructors, and Consumption had also a
poor fit (χ² = 334.16; df = 51; p < .001; CFI = .85;
RMSEA = .126; SRMR = .079), and the fit of this model
was also significantly worse than the fit of the initial
model (χ²diff = 239.55; dfdiff = 13; p < .01).
Discussion
The aim of the present study was the development of a
questionnaire for the measurement of sensitivity to reward and sensitivity to punishment, as they are conceived in Gray’s (1991, 1994) theory. In Gray and McNaughton’s (2000) modification of the RST the BIS is
no longer regarded as the primary neurological basis of
SP. It was proposed that SP is related to the FFFS, which
is responsible for mediating reactions toward aversive
stimuli. Therefore, the psychometric SP dimension, as it
was developed here, should not be regarded as a dimension representing the BIS. However, further research is
needed in order to clarify the correspondence between
the neurological systems of the revised RST and psychometric traits.
The present study follows the MTMM approach with
three method factors representing different situational
contexts (team, supervisors/instructors, and consumption). Confirmatory factor analysis revealed that SR, SP,
and the situational context factors explained a substantial
amount of variance. Representing the situational context
in which reward and punishment occur by means of
method factors is regarded as an advantage because it
controls for the specific situational variance instead of
avoiding it. When the situational variance is avoided or
unspecific, as, for example, in the BIS/BAS scales
(Carver & White, 1994), the scales may be primarily
related to general emotional traits, as they are, for example, measured with the PANAS (see Heubeck et al.,
1998). When the specific situational variance is not
avoided, this specific variance may conceal the underlying SR and SP dimensions when it is not controlled by
means of a MTMM design. The present approach was to
be specific with respect to the item content and to control
for the situational variance by means of a MTMM design. The results show that it was possible to control for
the situational variance in the SR and SP dimensions.
The MTMM approach used here has consequences for
scoring the questionnaire. According to Humphreys
© 2005 Hogrefe & Huber Publishers
173
(1962) the aggregation of raw scores across a heterogeneous facet of unwanted variance (the situational or
method variance, in the present case) would suppress or
balance out some of this unwanted variance, and the variance from the homogeneous aspects of the scores (i.e.,
the SR or SP variance) would be enhanced. An example
demonstrating this effect of aggregation of variables
across heterogeneous facets is discussed in Süß and
Beauducel (2005). However, it would be insufficient to
rely only on the aggregation effect in order to provide SR
and SP scores that contain a minimum of situational or
method variance, especially because the correlation between the Team and Superior/Instructor factor was so
large that not much of the respective variance can be
suppressed through aggregation. It is, therefore, recommended that factor scores be used in order to provide an
optimal scoring of the WRSQ. The conventional regression score estimates that can be calculated with Mplus
3.11 are not recommended here because they are generally much more correlated than the factors, which they
should represent. A more compelling type of factor score
estimate, which preserves the correlations of the original
factors in the scores, is available with LISREL 8.3 (Jöreskog, Sörbom, du Toit, & du Toit, 2000). Another type of
scoring that may be interesting when uncorrelated scores
are intended would be Anderson-Rubin (1956) score estimates (cited in Gorsuch, 1983). A SPSS job calculating
the orthogonal Anderson-Rubin score estimates from a
confirmatory factor pattern and the intercorrelations of
the variables is available from the first author. It would,
of course, be premature to prescribe a single type of scoring of the WRSQ for future research, since further research and larger samples are needed to provide solid
knowledge on optimal weighting of the variables as well
as for the calculation of reference norms.
It was shown that the sensitivity to reward and punishment in the social context was more pronounced in
females than in males, whereas there was no gender difference for the Consumption scale. The higher sensitivity
to punishment of females may be related to enhanced
neuroticism or anxiety scores of females (Eysenck & Eysenck, 1991). However, the fact that no gender difference
was found on the Consumption scale indicates that even
the larger neuroticism or anxiety scores of females typically found in personality questionnaires could be related
to the focus on social stimuli in these questionnaires.
When questionnaires do not contain many items related
to social stimuli, the difference between males and females on neuroticism may be reduced, as in the present
study. On the other hand, the fact that females score higher both on SR and SP supports the idea that the reinforcement systems underlying these sensitivities are mutually
interdependent in their functional outputs (Corr, 2004).
The present study was, of course, limited with respect
Journal of Individual Differences 2005; Vol. 26(4):168–175
174
A. Beauducel et al.: Model of Sensitivity to Reward and Punishment
to the situational contexts investigated. However, the organizational and school context was regarded as especially interesting for the assessment of SR and SP, because it was assumed that strong rewards and punishments are possible in this context. Moreover, two general
motivational tendencies that are similar to SR and SP
were proposed in the organizational context on the basis
of Higgins’ (1997) theory on regulatory focus. The general motivational focus that is closest to SR is promotionorientation, that is, pursuing all means of advancement.
The motivational focus that is most similar to SP is the
prevention-orientation, that is, carefully avoiding any
mistakes. Promotion-orientation and prevention-orientation have been discussed as relevant dimensions in the
context of organizational psychology (Brockner & Higgins, 2001; Kluger, Stephan, Ganzach, & Hershkovitz,
2004; Brockner, Parachuri, Idson, & Higgins, 2002).
One aspect of the parallelism between Higgins’ (1997)
regulatory focus theory and Gray and McNaughton’s
(2000) RST is that the regulatory focus theory is based
on general motivational orientations, whereas the RST is
based on the sensitivity toward positive and negative
stimuli. The regulatory focus theory typically emphasizes reactions to stimuli that are anticipated for months or
years in advance (e.g., starting a new company or creating a supportive environment for one’s children; Spiegel,
Grant-Pillow, & Higgins, 2004), whereas the RST is focused on stimuli that are anticipated within a rather short
time interval (typically within an experiment – one day)
or even the reactivity to immediate stimuli. It might be
regarded as an advantage to expand the time range for
the anticipation of positive and negative stimuli of the
RST by integrating long lasting anticipation processes as
they were typically treated within the regulatory focus
theory. Another interesting aspect of this parallelism is
that the regulatory focus theory provides descriptions of
general cognitive attitudes that may go along with specific sensitivities to positive and negative stimuli. Therefore, these two theories may be mutually enriched when
related to each other.
Moreover, one may ask whether the dimensions that
are measured by the WSRQ are primarily personality
traits in the sense of Gray (1991, 1994) or whether they
are primarily self-regulatory tendencies in the sense of
Higgins (1997). However, Gray (1994) emphasized the
situational aspect of his traits, since they are directly related to stimuli, whereas Higgins (2000) emphasized the
stability or the dispositional component of the self-regulatory tendencies. There is, of course, no fundamental
psychometric difference between stable self-regulatory
tendencies and personality traits. The difference is more
on a conceptual level and has to do with the research
context in which the concepts were integrated. The focus
on the personality trait concept has stimulated the search
Journal of Individual Differences 2005; Vol. 26(4):168–175
for underlying biopsychological dimensions (e.g., Gray,
1991), whereas the focus on the self-regulatory concept
has stimulated the search for specific cognitive processes
underlying the dimensions (e.g., Brockner et al., 2002).
However, there is no need to fix the dimensions at one or
the other side; it seems more interesting to maintain both
the social-cognitive and the biopsychological perspective on these dimensions.
References
Anderson, R.D., & Rubin, H. (1956). Statistical inference in factor
analysis. Proceedings of the Third Berkeley Symposium of
Mathematical Statistics and Probability, 5, 111–150.
Brockner, J., & Higgins, E.T. (2001). Regulatory focus theory:
Implications for the study of emotions at work. Organizational
Behavior and Human Decision Processes, 86, 35–66.
Brockner, J., Pauchuri, S., Idson, L.C., & Higgins, E.T. (2002).
Regulatory focus and the probability estimates of conjunctive
and disjunctive events. Organizational Behavior and Human
Decision Processes, 87, 5–24.
Campbell, D.T., & Fiske, D.W. (1959). Convergent and discriminant validation by the multitrait-multimethod matrix. Psychological Bulletin, 56, 81–105.
Carver, C.S., &White, T.L. (1994). Behavioral inhibition, behavioral activation, and affective responses to impending reward
and punishment: The BIS/BAS scales. Journal of Personality
and Social Psychology, 67, 319–333.
Corr, P.J. (2004). Reinforcement sensitivity theory and personality. Neuroscience and Biobehavioral Reviews, 28, 317–332.
Costa, P.T., Jr., & McCrae, R.R. (1992). The Revised Neo Personality Inventory (NEO-PI-R) and NEO-Five Factor Inventory
(NEO-FFI) Professional Manual. Odessa: Psychological Assessment Resources.
Cronbach, L.J., Gleser, G.C., Nanda, H., & Rajaratnam, N. (1972).
The dependability of behavioral measurements: Theory of generalizability for scores and profiles. New York: Wiley.
Eysenck, H.J. (1967). The biological bases of personality. Springfield, IL: Thomas.
Eysenck, H.J., & Eysenck, S.B.G. (1975). Manual of the Eysenck
Personality Questionnaire (Junior & Adult). London: Hodder
& Stoughton.
Eysenck, H.J., & Eysenck, S.B.G. (1991). Manual of the Eysenck
Personality Questionnaire (EPS Adult). London: Hodder &
Stoughton.
Gorsuch, R.L. (1983). Factor analysis (2nd ed.). Hillsdale, NJ:
Erlbaum.
Gray, J.A. (1987). Perspectives on anxiety and impulsivity: A
commentary. Journal of Research in Personality, 21, 493–509.
Gray, J.A. (1991). The neuropsychology of temperament. In J.
Strelau & A. Angleitner (Eds.), Explorations in temperament
(pp. 105–128). New York: Plenum.
Gray, J.A. (1994). Three fundamental emotion systems. In P. Ekman & R.J. Davidson (Eds.), The nature of emotion: Fundamental questions (pp. 243–247). New York: Oxford University
Press.
Gray, J.A., & McNaughton, N. (2000). The neuropsychology of
© 2005 Hogrefe & Huber Publishers
A. Beauducel et al.: Model of Sensitivity to Reward and Punishment
anxiety: An enquiry into the functions of the septo-hippocampal system. Oxford: Oxford University Press.
Guttman, L., & Levy, S. (1991). Two structural laws for intelligence tests. Intelligence, 15, 79–103.
Heubeck, B.G., Wilkinson, R.B., & Cologon, J. (1998). A second
look at Carver and White’s (1994) BIS/BAS scales. Personality
and Individual Differences, 25, 785–800.
Higgins, E.T. (1997). Beyond pleasure and pain. American Psychologist, 52, 1280–1300.
Higgins, E.T. (2000). Does personality provide unique explanations for behaviour? Personality as cross-person variability in
general principles. European Journal of Personality, 14,
391–406.
Hu, L., Bentler, P.M., & Kano, Y. (1992). Can test statistics in
covariance structure analysis be trusted? Psychological Bulletin, 112, 351–362.
Humphreys, L. (1962). The organization of human abilities.
American Psychologist, 17, 475–483.
Jöreskog, K.G., Sörbom, D., du Toit, S., & du Toit, M. (2000).
LISREL 8: New statistical features (2nd printing with revisions). Chicago, IL: Scientific Software International.
Jorm, A.F., Christensen, H., Henderson, A.S., Jacomb, P.A., Korten, A.E., & Rodgers, B. (1999). Using the BIS/BAS scales to
measure behavioural inhibition and behavioural activation:
Factor structure, validity, and norms in a large community sample. Personality and Individual Differences, 26, 49–58.
Kersting, M., & Beauducel, A. (in press). Berufsbezogener Persönlichkeitstest für Jugendliche und junge Erwachsene
[START-P. Occupation-referred personality test for young
adults]. Göttingen: Hogrefe.
Kluger, A.N., Stephan, E., Ganzach, Y., & Hershkovitz, M. (2004).
The effect of regulatory focus on the shape of probabilityweighting function: Evidence from cross-modality matching
method. Organizational Behavior and Human Decision Processes, 95, 20–39.
Liepmann, D., Nettelnstroth, W., Tartler, K., & Smolka, S. (2005).
START-E – Eine Testbatterie im Bereich der Personalarbeit
[START-E – A test battery for personnel psychology]. Göttingen: Hogrefe.
Little, T.D., Cunningham, W.A., Shahar, G., & Widaman, K.F.
(2002). To parcel or not to parcel: Exploring the question,
weighing the merits. Structural Equation Modeling, 9, 151–
173.
Muthén, L.K., & Muthén, B.O. (2004). Mplus, Version 3.11. Los
Angeles, CA: Muthén, & Muthén.
Patterson, C.M., Kosson, D.S., & Newman, J.P. (1987). Reaction
to punishment, reflectivity, and passive avoidance learning in
extraverts. Journal of Personality and Social Psychology, 52,
565–575.
Pickering, A.D., Corr, P.J., Powell, J.H., Kumari, V., Thornton,
J.C., & Gray, J.A. (1997). Individual differences in reactions to
reinforcing stimuli are neither black nor white: To what extent
are they Gray? In H. Nyborg (Ed.), The scientific study of personality: Tribute to Hans J. Eysenck at 80 (pp. 36–67). London: Elsevier.
© 2005 Hogrefe & Huber Publishers
175
Satorra, A., & Bentler, P.M. (2001). A scaled difference χ² test
statistic for moment structure analysis. Psychometrika, 66,
507–514.
Satorra, A., & Bentler, P.M. (1994). Corrections to test statistics
and standard errors in covariance structure analysis. In A. von
Eye and C.C. Clogg (Eds.), Latent variables analysis: Applications for developmental research (pp. 399–419). Thousand
Oaks, CA: Sage.
Spiegel, S., Grant-Pillow, H., & Higgins, E.T. (2004). How regulatory fit enhances motivational strength during goal pursuit.
European Journal of Social Psychology, 34, 39–54.
Strobel, A., Beauducel, A., Debener, S., & Brocke, B. (2001). Psychometrische und strukturelle Merkmale einer deutschsprachigen Version des BIS/BAS-Fragebogens von Carver und White
[Psychometric and structural characteristics of a German version of the BIS/BAS-scales from Carver and White]. Zeitschrift
für Differentielle und Diagnostische Psychologie, 22, 216–
227.
Süß, H.-M., & Beauducel, A. (2005). Faceted models of intelligence. In O. Wilhelm & R. Engle (Eds.), Understanding and
measuring intelligence (pp. 313–332). London: Sage.
Torrubia, R., Ávila, C., Moltó, J., & Caseras, X. (2001). The Sensitivity to Punishment and Sensitivity to Reward Questionnaire
(SPSRQ) as a measure of Gray’s anxiety and impulsivity dimensions. Personality and Individual Differences, 31, 837–
862.
van Heck, G.L., Perugini, M., Caprara, G.V., & Fröger, J. (1994).
The Big Five as tendencies in situations. Personality and Individual Differences, 16, 715–731.
Watson, D., Clark, L.A., & Tellegen, A. (1988). Development and
validation of brief measures of positive and negative affect:
The PANAS scales. Journal of Personality and Social Psychology, 54, 1063–1070.
Wilson, G.D., Barrett, P.T., & Gray, J.A. (1989). Human reactions
to reward and punishment: A questionnaire examination of
Gray’s personality theory. British Journal of Psychology, 80,
509–515.
Wilson, G.D., Gray, J.A., & Barrett, P.T. (1990). A factor analysis
of the Gray-Wilson personality questionnaire. Personality and
Individual Differences, 11, 1037–1045.
André Beauducel
Department of Psychology II
Mannheim University
Schloss, Ehrenhof Ost
D-68131 Mannheim
Germany
Tel. +49 621 181-2131
Fax +49 621 181-2129
E-mail beauducel@tnt.uni-mannheim.psychologie.de
Journal of Individual Differences 2005; Vol. 26(4):168–175
Keep reading this paper — and 50 million others — with a free Academia account
Used by leading Academics

Hatice Kafadar
Abant Izzet Baysal University, Bolu, Turkey

Thomas Pettigrew
University of California, Santa Cruz

Thomas L Webb
The University of Sheffield
Michael B Buchholz
International Psychoanalytic Berlin