Fuzzy Integral Analysis for Proactive Strategies in the
Semiconductor Foundry Business
Mei-Chen Lo(1), Jerzy Michnik(2) and Jonathan C. Ho(3)
1. National United University, Taiwan
2. The K. Adamiecki University of Economics in Katowice, Poland
3. Yuan Ze University, Taiwan
ABSTRACT
The wafer foundry is a highly competitive business and is subjected to continuous
technology innovation. Their services enable integrated circuit (IC) design firms to
produce products at low costs with high quality. Being the technological leaders in
semiconductor manufacturing processes, wafer foundry companies frequently
spearhead process advancements by skillfully leveraging its own R&D resources and
the world-class expertise of its material suppliers, IC designers or service alliance
partners. This study analyzes the important attributes to operating an efficient wafer
foundry fabrication (Fab) and empirically tests the attributes with a selected case.
The proposed approach uses fuzzy integral and a simple additive weighting (SAW)
method to assign weights. Experts, including internal employees, varied groups of
experts and leaders were organized to facilitate the research process.
INTRODUCTION
Integrate circuit (IC) is the heart of the electronic industry and is the driving force of many
technological progresses. The supply chain of IC devices includes IC design, mask making,
IC manufacturing, assembly and testing. The supply chain spread all over the world such
that IC is a trans-national industry with the characteristics of capital intensive and
technology intensive.
Many of the new designs from IC design companies and integrated device manufacturers
(IDMs) will go into production via setting order to foundry for manufacturing wafer. To
avoid expensive manufacturing facilities, many IC design firms have selected to be fabless
firms who leave the manufacturing activities to foundries.
The semiconductor
manufacturing industry is a capital-intensive industry and its technologies upgrade rapidly
(Yuan et al., 1998). For a sustainable growth rate in semiconductor industry, cost reduction,
superior customer service, and effective communication and information sharing within the
firm are critical. Besides, successful market player must look at the application of its process
technologies, although the integration of technologies and market imposes difficulty to move
forward productivity and the possible output. Still the market-driven force leads the direction
of investment. The purpose of this study is to develop an analytical method for technology
management and decision-making in the industries with environment which is characterized
by rapidly changing technology, shortening product life-cycle, innovative activities in
information quality and knowledge management (Tzeng et al., 2005b).
�The study uses combined qualitative and quantitative approaches to strategic management
process and intend to obtain deeper insight into semiconductor business. With the developed
methods, various strategies and their related attributes are collectively weighted for their
importance. Methodologically comparison of various methods and approaches can shed
some light to their characteristics and abilities to solve certain management issues. The
method used in the study is proven to be a useful tool for practical decision-making.
HIERARCHICAL MODEL OF BUSINESS PERFORMANCE EVALUATION
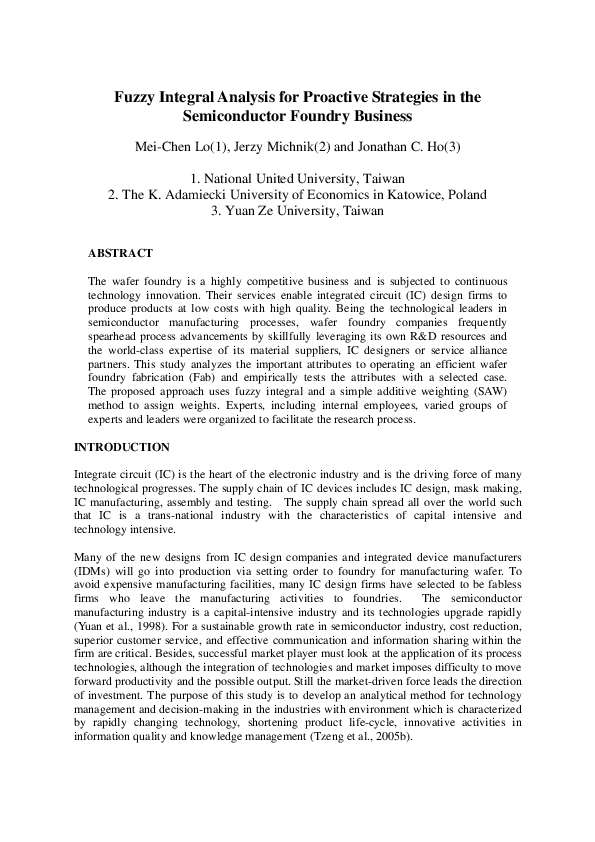
The main goal of the hierarchical framework is the performance evaluation of the
semiconductor companies. Four dimensions under this goal are established from the
economic viewpoint: the enterprise aspects, the market aspects, the environment and the
prospects. The hierarchical structure, adopted to deal with the problems of semiconductor
companies’ assessment, is shown in Figure 1. Weights reveal the importance of aspects,
criteria and sub-criteria in view of the factors of considered business strategies. They have
been obtained as the averages from 20 experts.
G oal
A sp ec ts
C r ite r ia
C1 The Enterprise
(0 .2 6 3 )
C2 The Market
The Factors Considered for
Business Strategies
C 1 1 S tra te gic A d va n ta ge
(0 .3 2 9 )
C 1 2 C o m p e titiv e C o m p e te n c e
(0 .3 4 1 )
C 1 3 O p e ra tio n R e sp o n se
(0 .3 3 0 )
C 2 1 M a rk e t S tra te g y
(0 .5 1 3 )
C 2 2 In d u stry L in k
(0 .2 5 2 )
C 3 T h e E n v ir o n m e n t
(0 .2 4 7 )
C 4 T h e P r o sp e c ts
(0 .2 3 8 )
(0 .4 8 7 )
S u b -C r ite r ia (A ttrib u te s)
C 1 1 1 D iffe re n tia tio n (0 .3 2 7 )
C 1 1 2 C o m p e titive A d va n ta g e (0 .3 6 4 )
C 1 1 3 N a m e R e c o gn itio n (0 .3 1 0 )
C 121
C 122
C 123
C 124
S e rv ic e & S u p p o rt ( 0 .2 6 2 )
M a rk e t S h a re (0 .2 5 6 )
A b ility to P ro m o te (0 .2 4 0 )
S ta yin g P o w e r (0 .2 4 2 )
C 1 3 1 O p tio n s to A b a n d o n (0 .3 0 4 )
C 1 3 2 P ro p e n sity to A tta c k (0 .3 2 0 )
C 1 3 3 S p e e d o f R e sp o n se (0 .3 7 6 )
C 211
C 212
C 213
C 214
C 215
M a rk e t L ife C yc le (0 .2 0 5 )
M a rk e t G ro w th R a te (0 .2 0 4 )
M a rk e t S e gm e n ts (0 .1 9 5 )
W a ys to O b ta in (0 .1 9 6 )
A d v a n ta g e (0 .2 0 0 )
C 221
C 222
C 223
C 224
T h re a t o f S u b stitu te s (0 .2 6 4 )
D istrib u tio n C h a n n e ls (0 .2 3 7 )
D e p e n d a b le S u p p lie rs (0 .2 4 9 )
E a se o f S w itc h in g (0 .2 5 0 )
C 31
C 32
C 33
C 34
C 35
G o v e rn m e n t A c tio n ( 0 .2 0 5 )
D e m o gra p h ic s (0 .1 8 3 )
T e c h n o lo g y (0 .2 2 0 )
C u ltu re (0 .1 8 4 )
E c o n o m y (0 .2 0 8 )
C 41
C 42
C 43
C 44
C 45
P ric e S e n sitivity (0 .2 0 6 )
N e g o tia tin g S tre n gth (0 .2 1 7 )
Im p a c t o f F a ilu re (0 .1 9 3 )
R isk o f P u rc h a se (0 .1 9 1 )
P ric e A w a re n e ss (0 .1 9 2 )
Figure 1 Defuzzified and Normalized Weights (Average of 20 Experts)
The rich content of our hierarchy makes the classical AHP pair-wise comparisons too
laborious for interviewed persons; it could make worse a quality of the results. As the experts
are highly experienced (long average service in the field) we assumed that they were able to
set direct weights reasonably.
For both, criteria importance (weights) and satisfaction, we use fuzzy triangular numbers for
evaluation. To assess criteria importance, the interviewed experts were allowed to use fuzzy
triangular numbers from interval [1,9] with accuracy of one decimal digit. No limits on
�membership functions were imposed except the obvious ascending order of lower bound, the
most possible value and upper bound. For satisfaction, the only difference was in the interval,
which was [1,10] in that case. Before subsequent calculations, the defuzzification of input
data was performed with the COA (centre of area) method.
From Table 1, the satisfaction upon current circumstances, has been located to each
sub-criterion by experts. On this basis the synthetic performance value (SPV) has been
figured out as the weighted sum of values of satisfactions. Similar procedure was performed
for two higher levels in hierarchy. The results suggest that the business strategy effectively
enters in work field; they also illustrate that the identical groups in the various units sustain
their unique characteristic. It can be clearly seen that there is much room (overall result 6.24
of 10) for improvement (Table 1). Especially, overall performance measures in the categories
(professional groups and areas), show average consistent results for the top five alternatives,
indicating that C133, C112, C132, C113 and C111 are the items which need most
improvements.
According to our results, domestic and non-domestic subjects demonstrate the different way
of view how the global businesses are implemented in practice. The market planning and
positioning are important issues when company considers its cross-boundary stand-point
(position). Differences between the non-domestic and domestic view of business strategies
can be explained by different environment and focus, which can affect directly the
speed-to-market and potentiality of regional business development.
During the recession time, top management tends to view potential opportunities in wide and
review internal capability for preparing next fight of new business cycling. It is the reason
that top management provides different priority on viewing business strategies.
Table 1 SPV by Professional Groups/Areas Categories
The
Enterprise
C11
C12
C13
Overall
SPV
0.32 (3) 2.05 (2)
0.35 (1) 2.35 (1)
0.33 (2) 1.88 (3)
The
Market
C21
C22
0.51 (1) 3.14 (1) 3.24 (1)
0.49 (2) 2.97 (2) 2.40 (2)
2.94 (1)
2.94 (2)
3.68 (1)
2.83 (2)
2.99 (1) 3.55 (1) 2.68 (1)
2.82 (2) 2.99 (2) 2.57 (2)
Business
Strategies
C1
C2
C3
C4
0.27 (1)
0.25 (2)
0.24 (3)
0.24 (4)
1.58 (2)
1.52 (3)
1.59 (1)
1.38 (4)
1.62 (2)
1.46 (3)
1.70 (1)
1.35 (4)
1.89 (1)
1.74 (2)
1.14 (4)
1.32 (3)
1.57 (3)
1.39 (4)
1.68 (1)
1.64 (2)
1.88 (1)
1.68 (2)
1.50 (3)
1.43 (4)
1.40 (3)
1.31 (4)
1.65 (1)
1.41 (2)
6.27
4.88
6.13
5.64
6.40
5.06
SPV (Rank)
Total
Weight
SPV
1.69 (1)
1.53 (2)
1.52 (3)
1.51 (4)
6.24
Fab
Operation
Marketing
Operation Support
1.96 (3) 1.95 (3) 2.21 (2)
2.22 (1) 2.14 (1) 2.31 (1)
2.17 (2) 1.95 (2) 2.08 (3)
Top
T
G
Manager
1.89 (3) 2.26 (2) 1.68 (3)
2.02 (2) 2.53 (1) 1.78 (2)
2.04 (1) 2.15 (3) 1.93 (1)
Rank
(1)
(4)
(2)
(3)
(1)
(2)
Remark: “T” stands for Domestic company, “G” stands for non-domestic company.
Due to the specificity of the industry, the group of fab operation reveals the highest SPV in
comparison with others (Table 1). As wafer foundry business presents a high technology and
professional services in the field, so the operation efficiency and marketing implementation
�in the industry contains a certain vision of exercising business strategies. The weight and the
overall SPV point on the enterprise as the most important aspect. The three of the
professional groups agree that the environment as well as technology development are
superior to the others aspects. They also think that the technology driven force via the
strategic technology collaboration is the best way to push the foundry business forward. In
view of the market, market strategy distinct from industry linkage, market segmentation is to
be drawn for satisfaction of customer needs. To continue implementation of the strategic
industry competition-cooperation model can help industry survival.
PROACTIVE STRARTEGIES ANALYSIS
In our case the role of alternatives are played by strategies. The nine strategies were
considered:
S1: Cost Control: cost control on operation activities;
S2: Marketing and Sales: marketing and selling skill in each aspect of the marketing mix,
market research and new product development, market network and sales point (REP,
globalization service center, logistic service, maintenance support, etc.), training and
skills of the sales force;
S3: Quality Activities: quality driven on operation oriented processes and product
diversification (yield improvement, output, utilization and efficiency);
S4: Innovation and Knowledge Management: knowledge based activities and
mechanism-information quality, information technology and innovated knowledge
management;
S5: Customer Services and Support: to fulfill customers’ satisfaction and focus on
customers’ requirement on application, product, market, regional exploration, strategic
business unit, advanced technology;
S6: Technology Development and Integration: technology driven on development and
integration (leading edge)—R&D capability, patent, copyrights, in-house capability in
the research and development process (product research, process research, basic research
and development), access to outside sources of research and engineering (e.g., suppliers,
customers, contractors), R&D staff skills in terms of creativity, simplicity, quality,
reliability;
S7: Talent incubation and human resource development: flexibility on business strategies –
manufacturing, marketing and technology development;
S8: Corporate resources integration and allocation: resources rearrangements and reasonable
allocations (production and logistic);
S9: Capital management and financial risk management: Cash flow, short- and long-term
borrowing capacity (relative debt/equity ratio), new equity capacity over the foreseeable
future, financial management ability, including negotiation, raising capital, credit,
inventories, and account receivable.
The evaluation of strategies was based on the numerical values from the interval [0, 10] with
accuracy of one decimal digit. This scale was designed to represent intuitive expert’s
judgment as follows: the medium point of the scale (5.0) represents the neutrality of a
strategy towards given attribute. Values to the left of 5.0 represent the level of negative
influence of strategy on given attribute with the highest negative influence given by 0.0.
Accordingly, values to the right of 5.0 represent the level of positive influence, with the
highest possible value equal 10.
�With the assumption of independence of the criteria we can use the additive measure for
calculating the overall evaluation of alternatives. The SAW has been chosen for this task.
More general, we can take into account some level of dependence between criteria. In this
case use of non-additive MCDM method such as fuzzy measure and Choquet fuzzy integral
for joint evaluation of the alternative is reasonable. For more profound comparison, the other
method – experts’ intuitive judgment – has been included.
According to a definition of fuzzy integral (Appendix) the parameter λ need to be
determined. For every evaluator, λ - value was calculated. The assignment of λ to our
hierarchy is as follows: Level 1: λ10 – (C1-C4). Level 2: λ6 - (C31-C35), λ7 - (C41-C45), λ8 (C11-C13), and λ9 - (C21-C22). At Level 3: λ1- (C111-C113), λ2h - (C121-C124), λ3 (CC131-C133), λ4 - (C211-C215), and λ5- (C221-C224).
The overall λi -value is obtained (i=1,2,…,10) by using the arithmetic averages from all
experts input values. λi -values for different professional categories and overall λi -values
are listed in Table 2.
λ -value
λ1
Table 2 λ - Values for Fuzzy Integral
λ2
λ3
λ4
λ5
λ6
λ7
λ8
λ9
λ10
Fab operation
-0.992 -0.999 -0.916 -1.000 -0.929 -0.998 -0.994 -0.998 -0.980 -0.999
Operation Support
-0.998 -0.999 -0.998 -1.000 -0.994 -1.000 -1.000 -0.997 -0.988 -1.000
Marketing
-0.999 -0.998 -0.999 -1.000 -1.000 -0.996 -1.000 -0.998 -0.988 -1.000
Top management
-0.645 -0.768 -0.986 -1.000 -0.991 -0.996 -0.999 -0.999 -0.962 -0.999
Overall
-0.973 -0.994 -0.986 -1.000 -0.994 -0.999 -0.999 -0.995 -0.971 -0.999
According to Table 2, λ - values appear negative in all cases from different categories of
experts. In this case the influence of improving the criteria with lower score is weakened by
the effect of non-additivity.
ANALYSIS RESULTS AND COMPARISONS
The results analysis provides a picture of the strategies comparison. It describes the analysis
result from SAW, fuzzy integral and experts’ intuition evaluation. Comparisons of solutions
received with different methodologies give the deeper insight into the evaluation process and
the opportunity to attain more objective view of the studied problem. Various methods and
approaches reveal its own unique characteristic and feasibility of explanation in business
strategies as well as the ability to solve practical management problems.
The higher evaluation 7.9 given by fuzzy integral in comparison to SAW value 6.1 (Table 3),
can be enlighten according to the generic characteristics of these two methods. The large
value of fuzzy integral calculation is the combined effect of the sign of λ - value and the
normalization. When sum of input weight is greater then 1, λ is negative and lower the
fuzzy integral value, but normalization used for SAW, lower the weighted sum even stronger.
It may be symptomatic that the experts’ intuition evaluation lies in between the two.
�C11
Fuzzy Integral
S1
6.209
S2
7.610
S3
6.566
S4
8.120
S5
6.946
S6
8.595
S7
7.358
S8
6.170
S9
5.880
Strategy
Effect
SAW
S1
S2
S3
S4
S5
S6
S7
S8
S9
Strategy
Effect
C12
Table 3 Comparison of the Results
C13 C21 C22
C3
C4
C2
Overall
7.693
8.280
6.624
6.924
9.113
8.083
7.834
6.299
5.725
5.867
6.574
4.974
8.974
7.780
6.773
6.697
7.565
7.443
7.402
7.978
5.969
8.046
7.338
8.642
5.869
6.245
5.129
7.239
6.530
5.447
6.612
6.806
7.680
6.025
5.577
5.351
7.787
7.441
5.755
7.201
5.412
7.363
6.635
6.574
7.540
8.443
7.654
6.368
6.521
5.847
6.927
6.044
6.266
7.372
7.447
8.147
6.575
8.796
8.880
8.470
7.741
7.346
7.172
7.378
7.770
5.894
7.840
7.261
8.504
5.994
6.149
5.307
8.283 (4)
8.083 (5)
6.525 (9)
8.624 (1)
8.583 (2)
8.466 (3)
7.549 (6)
7.215 (8)
7.491 (7)
6.0
7.1
7.0
8.3
6.4
8.1
7.1
7.4
6.6
7.9
5.784
7.334
6.563
6.768
6.489
7.553
6.095
5.778
5.227
6.464
7.119
6.273
6.079
7.921
7.383
6.615
6.313
5.443
5.256
6.317
4.897
7.663
5.980
6.414
5.803
5.950
6.278
6.227
7.214
5.446
6.597
6.402
7.431
5.158
5.754
4.799
6.281
5.451
5.770
6.164
4.998
6.140
5.511
5.638
5.150
5.908
6.437
4.855
6.341
4.840
5.432
6.232
5.575
5.926
7.400
6.285
5.862
6.712
5.834
6.110
4.926
6.024
6.712
5.849
6.924
5.914
6.820
6.824
7.119
6.181
6.022
5.648
6.253
6.359
5.603
6.387
5.721
6.805
5.329
5.698
4.970
6.337 (4)
6.510 (2)
5.567 (9)
6.569 (1)
5.825 (6)
6.386 (3)
5.674 (8)
5.833 (5)
5.802 (7)
6.4
6.6
6.1
6.1
5.7
5.7
6.2
6.4
5.9
6.1
5.875
8.250
6.250
7.625
7.125
7.500
6.625
7.125
5.750
6.750
6.625
6.250
7.375
6.000
6.750
6.375
7.250
6.500
5.125
6.375
5.125
6.125
5.125
6.000
6.625
6.000
6.875
7.625
6.625
6.375
8.000
6.500
7.250
6.750
6.625
7.188
6.590
7.488
6.055
8.006
7.946
7.817
7.296
6.678
6.349
7.320
7.254
5.708
7.329
7.072
8.161
5.947
5.911
5.240
6.750 (9)
7.563 (3)
6.875 (6)
8.125 (1)
6.875 (6)
8.125 (1)
7.275 (5)
7.438 (4)
6.788 (8)
6.7
6.6
6.2
6.7
7.1
6.7
7.2
Expert's Intuition Evaluation
S1
6.150 8.125 6.250
S2
7.250 7.625 5.750
S3
6.375 7.125 6.000
S4
7.250 7.375 7.625
S5
6.250 7.688 7.000
S6
8.000 8.213 6.875
S7
5.625 6.625 7.125
S8
5.750 6.375 7.438
S9
6.750 5.688 6.438
Strategy
Effect
C1
6.3
6.9
6.7
Table 4 demonstrates very strong consistency among different methods of strategies
evaluation. Innovation and knowledge management (strategy S4) receives the first place
independently of the method used. Well-established platform for information transmission
and knowledge management is important for building effective databank within a knowledge
pool. Due to pure foundry business have operated in Taiwan over 18 years (since 1987), the
business models also shift along learning curve, to the point in which maximum output (for
lowering cost), yield control (max. fab yield and product yield), production control (higher
utilization and lower machine down-time), on-time delivery (min. product cycle time) ensure
operation activities and allow to reach business plan. In addition, financial concepts about
capital composition may impact long-term business plan.
�Table 4 Ranking Comparisons from Different Models
Strategies
S1: Cost Control
S2: Marketing and Sales
S3: Quality Activities
S4: Innovation and Knowledge Management
S5: Customer Services and Support
S6: Technology Development and Integration
S7: Talent Incubation and Human Resource Development
S8: Corporate Resources Integration/Allocation
S9: Capital Management and Financial Risk Management
Fuzzy
Integral
SAW
Experts'
Intuition
4
5
9
1
2
3
6
8
7
4
2
9
1
5
3
8
6
7
9
3
6
1
6
1
5
4
8
SUMMARY
Strategic decision-making is an extremely complex and difficult process. Many paradigms
are developed for strategic decision-making. Most of these paradigms suggest that the
strategic management process, both at corporate and business levels, should include
industrial evolution, strategy evaluation, environmental analysis, goal setting/formulation,
strategies formulation, strategy implementation, strategy evaluation, and strategy control.
Most of these processes are complex and unstructured. This research, applying the analytic
hierarchy process, structures the complexity relations among essential attributes, criteria, and
aspects in a model. The model allows decision makers to analyze strategic alternatives and
their supporting attributes in a systematic manner. Rather than using pairwise comparison
method, which is typically used in AHP, this research compared three data collecting
methods, namely fuzzy integral, SAW and expert intuition. Various data obtained with the
three approaches provide more powerful explanation than the traditional approach.
The developed methods are applied to semiconductor foundry business as an empirical case.
It shows the capability of facilitate decision-making process at strategic level. With minor
modification of the model, the methods are applicable to other industries with similar
technological and market challenges to the case industry. Selecting and evaluating of the
three approaches therefore would depend on the nature of the application and the judgment
of the decision maker. Further empirical studies of these methods in other industries can be
carried out in the future.
REFERENCES
Chen, T.Y. and Tzeng, G.H. (2000), “Using fuzzy integral for evaluating subjectively
perceived travel costs in a traffic assignment model,” European Journal of Operational
Research, 130(3), 653-664.
Chen, T.Y., Wang, J.C. and Tzeng, G.H. (2000), “Identification of general fuzzy measures by
genetic algorithm based on partial information,” IEEE Transactions on Systems, Man,
and Cubernetics Part B: Cybernetics, 30B(4), 517-528.
Dubois, D. and Prade, H. (1985), “A review of fuzzy set aggregation connectives,”
Information Science, 36, 85-121.
�Grabisch, M., Nguyen, H.T. and Walker, E.A. (1995), Fundamentals of uncertainty calculi
with applications to fuzzy inference, Dordrecht: Kluwer Academic Publish.
Sugeno, M. (1974), Theory of Fuzzy Integral and Its Applications, unpublished doctoral
dissertation, Tokyo Institute of Technology, Japan: Tokyo.
Tzeng, G.H., Ou Yang, Y.P., Lin, C.T. and Chen, C.B. (2005a), “Hierarchical MADM with
fuzzy integral for evaluating enterprise intranet web sites,” International Journal of
Information Sciences, 169, 409-426.
Tzeng, G.H., Chang, C.Y. and Lo, M.C. (2005b), “MADM Approach for Effecting
Information Quality of Knowledge Management,” International Journal of Information
Systems for Logistics and Management (IJISLM), 1 (1), 55-67.
Yuan, B.J.C., Chang, C.Y. and Lo, M.C. (1998), “Strategies of Semiconductor Industry in
Taiwan”, IEEE, IEMC 1998, 541-545.
APPENDIX – FUZZY INTEGRAL
The Choquet fuzzy integral of h(•) with fuzzy measure g (•) is defined as follows
(Sugeno, 1974; see also: Chen and Tzeng, 2000; Chen et al., 2000, Tzeng et al., 2005a):
(c) ∫ hdg = h( xn ) g ( H n ) + [h( xn −1 ) − h( xn )]g ( H n −1 ) + ... + [h( x1 ) − h( x2 )]g ( H1 )
= h( xn )[ g ( H n ) − g ( H n −1 )] + h( xn −1 )[ g ( H n −1 ) − g ( H n − 2 )] + ... + h( x1 ) g ( H1 ),
(A.1)
where H1 = {x1}, H 2 = {x1 , x2 },..., H n = {x1 , x2 ,..., xn } = X .
In the above definition:
1) h is a measurable function from X to [0,1] and h( x1 ) ≥ h( x2 ) ≥ ... ≥ h( xn ).
2) Fuzzy density gi = g λ ({ xi } ) for any subset {x a1 , x a2 ,..., x ak } of X, is calculated from the
equation:
ak
n
⎤
1 ⎡ ak
ak −1
g λ xa1 , xa2 ,..., xak = ∑ gi + λ ∑ ∑ gi g j + ... + λ g a1 g a2 ...g ak = ⎢∏ (1 + λ gi ) − 1⎥
λ ⎣ i = a1
i = a1
i = a1
j >i
⎦
(A.2)
where {a1 , a2 ,..., ak } is any subset of {1, 2,..., k} in ascending order.
3) For −1 ≤ λ ≤ ∞ boundary condition g λ ({ x1 , x2 ,..., xn } ) = 1 leads to equation
({
})
λ + 1 = ∏1 + λ gi which can be solved for unique value of λ.
n
i =1
�
 Jerzy Michnik