Article
Infrastructure Development and
Access to Basic Amenities in
Class-I Cities of West Bengal, India:
Insights from Census Data
Journal of Infrastructure Development
8(1) 36–84
© 2016 India Development Foundation
SAGE Publications
sagepub.in/home.nav
DOI: 10.1177/0974930616640089
http://joi.sagepub.com
Ismail Haque1
Abstract
Examination of the city-level infrastructure data from Census databases reveals that improvements in
both social and physical infrastructure parameters have occurred in class-I cities of West Bengal but
not in economic infrastructure aspects while access to basic amenities and assets has improved only
slightly at the household level. However, cities situated in the lowermost infrastructural development
categories dominate the urban scene in this state. Furthermore, any discernible improvements in infrastructural facilities during the last decade are totally confined to a few large cities like Kolkata, Howrah,
Asansol, Durgapur, Siliguri, Burdwan and Bally. As regards the overall infrastructural development,
about 48 per cent of the class-I cities experienced a very low-to-low level improvement in facilities
in 2011, implying the dismal status of infrastructure in the smaller class-I cities. The pace in growth of
infrastructure facilities in large cities is sluggish compared to many medium and small centres, due to
their inability to update the existing infrastructure base up to the required level to meet burgeoning
civic demands. Whatever success is gained is disproportionately distributed across the class-I cities of
the state, highlighting the tremendous inter-city disparity.
JEL Classification: H54, O1, O18
Keywords: Urbanisation, urban infrastructure, principal component analysis (PCA), basic amenities
and assets, class-I city, West Bengal
1. Introduction
Infrastructure development is of paramount importance for achieving sustainable and equitable economic growth through providing access to amenities to all citizens. Creating and maintaining globalstandard and lasting infrastructure is therefore a basic requirement for enhancing living standards by
enabling enterprises and societies to function efficiently while being environmentally responsible. These
comprise, mostly (but not exclusively), transportation and communication facilities, water and power
1
Centre for the Study of Regional Development (CSRD), School of Social Sciences (SSS), Jawaharlal Nehru University (JNU),
New Delhi, India.
Corresponding author:
Ismail Haque, Centre for the Study of Regional Development (CSRD), School of Social Sciences (SSS), Jawaharlal Nehru University
(JNU), New Delhi 110067, India.
E-mail: ismailhaque140489@gmail.com
Downloaded from joi.sagepub.com at JAWAHARLAL NEHRU UNIVERSITY on July 1, 2016
37
Haque
(electricity) supply, access to public institutions like school, colleges, hospitals, library and post offices,
among others.
Generally, infrastructure can be categorised into three types: first, physical infrastructure, which
comprises, for example, roads, water, sanitation, sewerage, electricity and firefighting services; second,
social infrastructure, which covers health, education, club and library facilities among others and third,
economic infrastructure, which includes banking facility, credit and insurance facilities among others
(Ghosh and De 1998, 3039). Physical infrastructure makes it possible for an economy to grow through
creation of incomes and jobs, by minimising transaction costs. Social infrastructure, on the contrary,
plays a critical role in the process of growth, through creation of human capabilities and capacity building by enhancing the quality of human life with better education, health and recreation facilities.
However, the recent unprecedented urban population growth, bereft of adequate investment in these
crucial infrastructure sectors, has exerted huge pressure on the limited existing infrastructure, such as
water supply, sanitation, sewerage and health. This has caused a gigantic gap between demand and supply of infrastructure and urban civic amenities. The escalating need for essential services by a growing
number of urbanities causes the gradual deterioration of the quality of services across sectors, such as
roads, water supply, drainage, electricity, housing, medical facility, banking and education. It may be
apprehended that the gap between demand and supply of infrastructure facilities is likely to be widened
rather than reduced in future, as the creation of newer infrastructural facilities has not kept pace with
their ever rising demand. Especially in West Bengal, the entire process of creating new infrastructure has
lagged behind relative to the growth in its large urban centres.
In this backdrop, the present article attempts to explore the trends and level of infrastructure development, and status of urban basic amenities and assets at the household (HH) level during 2001–11 in
class-I cities (>100,000 population) of West Bengal. Given that the Kolkata Urban Agglomeration (KUA)
exhibits a colossal metropolitan dominance housing 48.4 per cent of the total urban population of West
Bengal and that nearly greater than two-thirds class-I cities (42 out of total 61) are located here, therefore, it is felt appropriate to compare briefly the variations of infrastructure development and HHs’ basic
facilities and assets across class-I cities falling under KUA and outside KUA as well.1
1.1. Conceptual Framework
Urbanisation in West Bengal showcases peculiarities during the last two decades. A very stagnant urban
growth along with a highly-skewed nature of urbanisation indicates an irregular concentration of considerable portions of the overall urban population in the large cities, leading to the indirect collapse in civic
services. Consequently, the sharply rising demand and meagre availability of urban services has given
rise to severe problems in the field of housing causing a proliferation of slums, induced water scarcity,
created poor infrastructure and lowered the quality of life, all of which have induced lopsided urban
growths in class-I cities of West Bengal. By and large, the recent urbanisation of West Bengal is primarily a crucial manifestation of the demographic explosion as well as a poverty induced rural to city-ward
migration. A higher engagement of rural people in non-farm activities has also paved the way for more
villages to be classified as urban, after fulfilling the Census criteria in the past decades, leading to the
emergence of the highest number of Census towns (Guin 2014; Guin and Das 2015; Prodhan 2013b;
Samanta 2012). During the past couple of decades, in West Bengal, urbanisation has taken place without
substantial industrialisation and a simultaneously developing strong economic base (Bose and Chowdhury
2013; Giri 1998; Khasnabis 2008).2
Although, to some extent, after the 1990s, economic reforms especially those of Liberalisation,
Privatisation and Globalisation boosted the process of urbanisation in the state, markedly and optimistically,
Downloaded from joi.sagepub.com at JAWAHARLAL NEHRU UNIVERSITY on July 1, 2016
38
Journal of Infrastructure Development 8(1)
through considerable investments in Information Technology (IT) industries in some pockets, an undeniable fact remains that, globalisation has affected the poor adversely. There is no doubt that liberalisation
allows cheap imports, but it also ruins the traditional rural agrarian economy and HHs industries on
which rural people depend largely.3 On the contrary, privatisation diminishes the expenditure of the
labour class. These, in turn, propel poverty, leading to huge migration towards large urban areas in search
of jobs and other economic opportunities. Thus, poverty led rural–urban migration, which is considered
as one of the proximate determinants of urban growth stems not due to urban pull rather due to rural push
(Sarkar 2011). A higher chunk of migrants has been working routinely in both the sectors of economy—
traditional and modern, and this has invited the problems of urban services and has led to the deterioration of the quality of life in the large cities of West Bengal. In reality, large cities of this state lack the
infrastructural facilities, which are not present at all in many of the small urban centres yet.
The accelerating rate of urbanisation with ill-assorted infrastructure facilities gives rise to all kinds of
pollution, causes scarcity of safe drinking water, leads to expeditious emergence of slums followed by very
poor sanitation and health facilities as well as existence of vital problems relating to transport congestion.
Above all, there is a need for suitable urban governance and planning strategies, and balanced development in the cities and towns. Usually any policies formulated, or plan assistances received by the state
for urban development, are earmarked for particular urban centres like the KUA, Asansol- Durgapur
industrial node and Siliguri region, causing a lagging behind of the rest of the state, leading to huge discrepancies among others class-I cities in most of the districts in terms of resource allocation, infrastructural development as well as socio-economic development.
These burning issues of contemporary urbanisation in West Bengal have seldom received scholarly
attention and therefore deserve a serious in-depth investigation in the context of the infrastructure development and access to basic amenities across the class-I cities. Figure 1 shows the conceptual framework
of this study.
2. Database and Research Techniques
A glorious tradition of the Indian population Census has been to provide rich data pertaining to several
aspects of urban infrastructure and housing, and HHs facilities and services for urban area in general and
for cities in particular. Data required for the present study have been extracted from the Town Directory
2001 and 2011, Primary Census Abstract-Houselisting and Housing Census 2001 and 2011, West Bengal.
To address the prime aims outlined above, some statistical and cartographic methods have been used
lucidly, for instance, simple per cent distribution, correlation analysis and PCA among others. A composite index is constructed through PCA of 19 select infrastructure indicators (grouped under three broad
categories).
2.1. Selection of Indicators for Composite Indices
In common parlance, the level of various infrastructure facilities as well as other basic amenities differs
among cities. Contrarily, a city having better road facility may not have a sufficient number of educational institutions or adequate hospitals. Accordingly, a proper measure derived from the inclusion and
amalgamation of several suitable indicators can best reflect the level of infrastructure development in a
city. Hence, a composite index computed by considering the most depictive and best possible indicators
can serve this objective. Here I have considered 19 infrastructure indicators. Table 1 reports the details
of variables and their definitions applied.
Downloaded from joi.sagepub.com at JAWAHARLAL NEHRU UNIVERSITY on July 1, 2016
39
Haque
Natural Increase of
Population
Adversity of Rural Conditions:
a.
b.
c.
d.
Low wage rate,
Lack of job opportunities,
Low agricultural output,
Less-Profitable household industries etc.
RuralUrban
Migration
Rural-Urban
Reclassification
More engagement of Rural
People in Non-Farm
Activities
Urban Growth
Multifaceted/Diversified
Functions of Cities:
a.
b.
c.
d.
e.
f.
g.
h.
Administrative,
Trade & Commerce
Communication,
Transports,
Manufacturing,
Construction
Industries,
Services (Public utility,
Socio-cultural, Recreational
etc.)
Concentration of more
people from Lower Order
Towns (VI-II) to Big Cities
for better provisions of
services & opportunities.
Growth of Population in Class-I
Pressure/Demand of Infrastructure,
Basic Services and Amenities increase:
a.
b.
c.
d.
e.
f.
g.
h.
Roads,
Power supply (Electricity),
Safe drinking water,
Sewerage,
Education & health,
Housing,
Transport, &
Social Security, among others.
Infrastructural Development
Figure 1. Conceptual Framework
Source: Author’s own.
These urban infrastructure indicators have been selected on the following grounds. Any urban centre,
especially a city, plays a crucial role in the process of economic development and in turn acts as an
‘engine of economic growth’ (Bhagat 2011, 2). Basically, this attribute of the city is supported by an
adequate, accessible and far-reaching transport network. The insufficiency of railway services across
the districts of West Bengal further accentuates the significance of roads as the key means of transportation
for increasing the productivity and efficiency of economic activities. Thus pucca roads (asphalted
or tar-covered roads) are a vital indicator of development as they play a prime role in the economic
advancement of any region. Similarly, as far as the health risk factors and sanitary environment are
Downloaded from joi.sagepub.com at JAWAHARLAL NEHRU UNIVERSITY on July 1, 2016
40
Journal of Infrastructure Development 8(1)
Table 1. Component Score Coefficient of the Select Indicators Pertaining to Various Aspects of the
Infrastructure Development in Class-I City of West Bengal (Base Year: 2001)
Select Infrastructure Indicators and Their Definitions
Physical Infrastructure Indicators (PHII)
Pucca road per sq. km
Per cent households (HHs) having closed drainage to total HHs
Percent HHs using tap water within premises to total HHs
Component Score Coefficient#
Percent HHs having flush latrine within premises to total HHs
Number of domestic electric connections per 100 HHs
Electric road light point per sq. km
Social Infrastructure Indicators (SII)
Medical facilities
Number of health institutions per 10,000 population*
Number of beds in medical institutions per 1,000 population
Educational facilities
Number of colleges per 10,000 population**
Number of senior secondary and secondary schools per 5,000 population
Number of middle and primary schools per 5,000 population
Recreational facilities
Number of stadium per 10,000 population
Number of cinema halls per 10,000 population
Number of auditorium per 10,000 population
Number of public library per 10,000 population
Number of reading rooms per 10,000 population
Economic Infrastructure Indicators (EII)
Number of banks per 10,000 population
Number of agricultural credit society per 5,000 population
Number of non-agricultural credit society per 5,000 population
–0.074
0.596
0.168
0.248
0.696
–0.166
–0.054
0.260
0.110
0.359
0.963
0.600
0.939
0.843
0.703
0.369
0.956
–0.083
0.931
Source: Computed from Town Directory 2001 and 2011 (West Bengal), Census of India.
Notes: Studies have been carried out on 58 Class-I, 2 Class-II cities of 2001 Census and 61 Class-I cities of 2011 census.
#Component score coefficient has been derived from principal component analysis (PCA).
*Health institution includes hospitals, dispensaries, family welfare clinics, health centres, tuberculosis clinic, nursing
homes and among others.
**Colleges include arts, science, commerce, arts–science, arts–commerce, arts–science–commerce, law, medical,
polytechnic, engineering and among others.
concerned, the system of sewerage and waste disposal methods are critical in urban areas (Snow 1854).
There are several methods of waste water outlet systems across the HHs as per the data provided by the
Census. Among them, closed drainage is believed to be hygienic and good. Provisions of adequate
numbers of latrine facilities are of utmost important for the sustenance of a better quality of life in urban
centres (UNDP 2005). As far as the 2011 Census is concerned, one in ten HHs in class-I cities still do not
have latrine facility in their houses in West Bengal. Flush latrine is considered to be best in this respect.
Unquestionably, water is considered to be the lifeline for human beings and nothing can be done
Downloaded from joi.sagepub.com at JAWAHARLAL NEHRU UNIVERSITY on July 1, 2016
41
Haque
bereft of this precious resource. Being the crucial basic amenity in cities, accessibility to safe drinking
water is obviously a vital indicator of health and well-being. Mainly taps and hand pumps may be
regarded as safe sources of drinking water (Bhagat 2011; Kundu 1999). I have taken tap water supplied
to HHs from both the treated and untreated sources indicators in the present analysis. The availability of
power, especially electricity is another inevitable aspect of urban areas. A city having larger number of
electrified HHs may indicate a better quality of HH living condition and vice-versa. Recent studies also
confirm this conjecture, that those states which enjoy higher electrification coverage also garner a higher
rank as per the HH quality of living index (Das and Mistri 2013, 166).
As far as the social infrastructure indicators are concerned, provisions for health facilities play a crucial role in human well-being. Therefore, aspects like access to medical facilities, such as hospitals,
nursing homes and availability of beds in medical institutions are useful in studying the social development of a region. Similarly, the presence of educational facilities, such as numbers of schools and colleges, specially specialised skill-development centres, such as medical, engineering and law colleges,
and universities and polytechnic institutes are critical for human resource creation for the progress of a
society. Recreational facilities, such as presence of stadiums, cinema halls and auditoriums, public libraries and reading room facilities are nodal to community building and social integration in a city.
Last, but not least, the number of banks and other forms of monetary and credit facilities act as the
key agents of economic development in urban areas. Commenting on the rationale behind the different
infrastructure indicators, Ghosh and De (1998) argued that the physical infrastructure (e.g., roads,
electricity, housing and water supply) gave an impetus to economic growth and development resulting
from increase of investment, employment, output and income in a chain of ‘cumulative causation’.
Hence, ‘economics of agglomeration’ develop over a period of time resulting in further accumulation of
economic functions in a particular region and perpetuating this process. According to them, the aforementioned social infrastructure indicators (which are also conducive for production activity, albeit
indirectly in some instances), are no less significant.
2.2. Composite Index: Overall Infrastructure Development Index (OIDI)
To generate the composite index, the following steps have been followed:
1. Making the indicators scale independent4
2. Allocation of weights to each indicator
I computed weights with the help of PCA. The first principal component score coefficient derived
from PCA has been used as weights for each indicator respectively as it explains the maximum amount
of variance. Another crucial point is the temporal comparability of indices for the two consecutive
Census periods—2001 and 2011. For this, the values of weights were fixed for both time periods. For the
present study, component score coefficient for the base year (2001) has been applied to the indicators of
the 2011 Census as well.
The OIDI therefore consisted of three different sub-indices: Physical Infrastructure Index (PHII),
Social Infrastructure Index (SII) and Economic Infrastructure Index (EII). The selected 19 indicators
come under these three indices (Table 1). The whole procedure of composite indices could be expressed
as follows (see Figure 2)
OIDI = PHII+SII+EII
PHII = Pi = a,b,c..n Xiwi SII = Pi = a,b,c..n Xiwi EII = Pi = a,b,c..n Xiwi
Downloaded from joi.sagepub.com at JAWAHARLAL NEHRU UNIVERSITY on July 1, 2016
(1)
42
Journal of Infrastructure Development 8(1)
Secondary database: Census
PCA Houselisting
and Housing
Town directory
Pucca road, electrified HHs,
electric road light point, health
institutions, number of beds in
hospitals, colleges, primary,
middle and secondary school,
stadium, auditorium, cinema
hall, public library, reading
room, banks, agricultural credit
society and non-agricultural
credit society
Indicators
HHs having close
drainage, access to tap
water within premises
and flush latrine within
premises
Methods
Making indicators scale free by division
by mean (DM) method
Computation of weights for each select indicator through PCA
Weights are then multiplied by respective scale free values of indicators
Adding up the product to get final composite indices
Figure 2. The Infrastructure Development Index Algorithm
Source: Author’s own.
where
OIDI = Overall Infrastructure Development Index
a, b, c...n = indicator of the sub-indices
W = Component score coefficient of the base year (2001)
X = Scale free observed indicators.
3. Major Findings and Discussions
3.1. Infrastructure Development in Class-I Cities of West Bengal:
Trends and Levels (2001–11)
Applying the above discussed methods, three sub-infrastructure indices have been constructed. The
aggregate OIDI has been obtained by combining the score of three sub-indices (PHII, SII and EII). Cities
are then ranked based on their OIDI score, where higher values indicate relatively good infrastructure
Downloaded from joi.sagepub.com at JAWAHARLAL NEHRU UNIVERSITY on July 1, 2016
43
Haque
Table 2. Level of Infrastructure Development in Class-I Cities of West Bengal
2001
2011
Category
Composite Index
Values (OIDI)
Number of Cities
%
Number of Cities
%
Very high
More than 40.00
12
19.67
14
22.95
High
30.00–40.00
3
4.92
7
11.48
Medium
20.00–30.00
9
14.75
11
18.03
Low
10.00–20.00
20
32.79
17
27.87
Very low
Less than 10.00
17
27.87
12
19.67
61
100.00
61
100.00
Total Class-I city
Source: Computed from Census 2001 and 2011 data.
development while lower values represent poorer infrastructure development in them. Table 3 displays
cities falling under KUA and outside KUA region and their relative status of infrastructure development
during 2001 and 2011—thus variations can be analysed not only between the KUA and other urban entities in the state but also across the different urban bodies that comprise the KUA and are separate urban
entities in their own right.
Apart from that, to compare the level of infrastructure development, the cities have been grouped into
five categories, such as very high, high, medium, low and very low level on the basis of their OIDI values and were mapped to geographically display the index scores in a visually clear way (Table 2 and
Figures 7 and 8). It is observed that the overall infrastructure in the class-I cities of West Bengal has
improved over the decades.
The number of cities placed in the very highly developed group has increased sluggishly just from 12
to 14 during 2001–11 while the percentage of cities in the high development category has increased
markedly from 4.92 per cent to 11.48 per cent, recording a more than two times increase during the last
decade. Similarly, the proportion of cities under the medium development group registered a gradual
increase from 14.75 per cent to 18.03 per cent during both reference periods. One could further notice
the decadal improvement of infrastructure status in class-I cities, as nearly eight cities moved to the
higher category of infrastructure development from the low and very low groups. Table 2 makes it
quite possible to observe that a lesser number of cities now come under the low and very low level of
infrastructure development category as per the 2011 Census as compared to what it was in the preceding
Census. This implies that the Class-I cities of West Bengal have had better infrastructure facilities in the
recent decade than in the former.
An assessment of the trends and level of infrastructure development has been performed lucidly on
the ground of those cities experiencing improvement in infrastructure vis-à-vis those placed at the other
end of the spectrum (Figures 3–8 and Table 3). One can notice from Figures 3 and 4 that most of the
class-I cities have experienced considerable improvement in their physical and social infrastructure status during the recent decade. As many as 65.57 per cent of the cities flagged some improvement as far as
their physical infrastructure development was concerned, during 2001–11, whilst the corresponding
figure for social infrastructure development was 60.65 per cent. Some cities exhibited exceptionally
higher development in terms of their physical infrastructure in the 2011 Census from that of the 2001
Census, for instance, Uluberia, English Bazar, Baidyabati, Berhampore, North Dum Dum, Balurghat
followed by Barrackpore, Titagarh, Siliguri and Baranagar. Contrastingly, South Dum Dum, Bongaon,
Uttarpara-Kotrung, Naihati, Shantipur, Basirhat, Halisahar, Barasat, Kharagpur and Chandannagar have
recorded a remarkable deterioration in their physical infrastructure development during the last decade.
Downloaded from joi.sagepub.com at JAWAHARLAL NEHRU UNIVERSITY on July 1, 2016
Table 3. Infrastructure Development Index for the Class-I Cities of West Bengal: 2001 and 2011
2011
Districts
City Name
PHII
SII
2001
EII
OIDI
Rank
(OIDI)
PHII
SII
EII
OIDI
Rank
(OIDI)
Class-I Cities Falling under Kolkata Urban Agglomerations (42)
Downloaded from joi.sagepub.com at JAWAHARLAL NEHRU UNIVERSITY on July 1, 2016
Kolkata
Kolkata
6.6501
30.1381
162.1784
198.9665
1
5.9795
276.1291
99.9838
382.0924
1
Haora
Haora
2.9313
138.1419
46.9012
187.9744
3
2.2490
43.4971
3.5038
49.2500
9
N 24 Parganas
Bhatpara
1.8649
74.2629
0.8640
76.9919
7
0.9765
21.9092
0.3972
23.2829
20
N 24 Parganas
Panihati
1.8540
63.9539
0.9996
66.8075
8
1.4609
41.3503
1.9967
44.8079
11
N 24 Parganas
Barasat
1.3036
51.4924
–4.3243
48.4717
9
2.4946
16.3412
0.5280
19.3638
25
Haora
Bally (M)
2.9172
33.1189
9.8319
45.8679
13
2.1964
33.8352
1.1699
37.2015
13
N 24 Parganas
Dum Dum
3.0550
32.5118
7.5907
43.1575
14
2.0672
13.2959
0.3840
15.7471
35
N 24 Parganas
Bidhannagar
4.5363
33.3872
0.8640
38.7875
16
2.3137
77.5325
1.8239
81.6700
2
N 24 Parganas
Kanchrapara
0.8217
29.8799
4.6538
35.3553
19
1.1485
16.4075
0.1920
17.7480
29
Nadia
Kalyani
4.5247
28.2575
0.7200
33.5023
20
3.0191
14.0024
0.3972
17.4186
31
Nadia
Krishna Nagar
2.2688
26.5482
–3.8659
24.9510
26
1.3877
24.9380
–10.9670
15.3587
36
Hugli
Chandannagar
1.3168
22.5994
0.6156
24.5317
27
2.0997
31.5613
0.5676
34.2286
14
N 24 Parganas
Kamarhati
1.2772
21.8332
0.6240
23.7344
28
1.4038
14.1501
0.8076
16.3614
34
N 24 Parganas
Habra
1.6578
19.6190
0.6720
21.9488
29
1.0489
6.9053
–16.4562
–8.5020
61
Haora
Uluberia
3.9139
21.8564
–4.3243
21.4460
30
0.3379
18.4222
0.4800
19.2401
26
Hugli
Serampore
2.5711
17.9610
0.7200
21.2521
31
2.3305
22.3980
0.6024
25.3309
17
S 24 Parganas
Rajpur-Sonarpur
2.0143
17.9344
0.5760
20.5247
32
1.0090
18.8240
0.7944
20.6274
23
N 24 Parganas
South Dum Dum
0.4965
17.4675
1.4184
19.3825
33
2.0924
44.8286
2.3579
49.2788
8
Hugli
Hugli-Chinsurah
2.5384
24.3872
–9.3686
17.5569
34
1.7592
16.6354
–1.9026
16.4920
33
N 24 Parganas
Bongaigaon
0.9094
15.1590
0.3840
16.4524
35
3.8204
12.2589
0.5328
16.6120
32
S 24 Parganas
Maheshtala
0.8752
14.6435
0.4320
15.9507
36
1.1998
8.7259
0.4800
10.4057
43
Hugli
Rishra
0.9793
13.6918
0.6768
15.3479
37
1.4444
4.8577
0.7908
7.0929
49
N 24 Parganas
Khardaha
1.1739
13.5257
0.4800
15.1796
38
1.0535
6.2897
0.4584
7.8016
47
Downloaded from joi.sagepub.com at JAWAHARLAL NEHRU UNIVERSITY on July 1, 2016
N 24 Parganas
Basirhat
0.6628
13.5834
0.5760
14.8222
39
1.4409
8.9975
–3.7421
6.6963
50
N 24 Parganas
Barrackpore
2.8902
10.9059
0.7200
14.5161
40
1.0014
8.2193
0.8472
10.0679
44
N 24 Parganas
Naihati
0.4041
12.0637
0.4800
12.9478
41
1.1440
13.0438
0.5280
14.7158
39
Nadia
Nabadwip
1.4054
10.8131
0.4800
12.6984
42
1.0309
10.4044
0.5064
11.9417
42
Hugli
Bhadreswar
0.7243
11.0466
0.3012
12.0720
43
0.7695
4.5793
0.1440
5.4929
52
N 24 Parganas
Madhyamgram
0.7911
9.8778
1.0344
11.7033
44
0.9552
11.2170
0.5676
12.7398
40
N 24 Parganas
Baranagar
1.9387
7.9113
1.3441
11.1941
46
0.8467
16.6460
0.9119
18.4046
28
Hugli
Baidyabati
2.2981
7.8304
0.5280
10.6565
47
0.4740
4.6955
–3.6941
1.4755
58
N 24 Parganas
Halisahar
0.6373
9.6450
0.2880
10.5703
48
1.3599
0.9579
0.2400
2.5578
56
N 24 Parganas
Ashoknagar Kalyangarh
1.1497
13.8384
–4.9003
10.0878
49
0.5770
11.8065
0.1920
12.5755
41
N 24 Parganas
Rajarhat-Gopalpur
1.2639
8.2133
0.4932
9.9704
50
1.8309
12.5522
0.5280
14.9110
38
Nadia
Shantipur
0.2318
8.7314
0.3840
9.3472
51
0.5133
13.6515
–12.2822
1.8826
57
N 24 Parganas
North Barrackpore
2.3722
6.0514
0.2880
8.7116
52
1.5236
6.6478
–3.9209
4.2506
54
Hugli
Uttarpara-Kotrung
0.4263
6.0484
0.8292
7.3040
53
1.7253
6.0207
0.6372
8.3831
46
N 24 Parganas
North Dum Dum
2.0191
3.9834
0.4800
6.4825
55
0.5732
4.9162
0.2400
5.7293
51
Hugli
Champadani
0.7752
5.3063
0.1920
6.2735
56
0.6148
6.3541
0.2400
7.2088
48
N 24 Parganas
Titagarh
3.5176
0.6022
0.3492
4.4690
58
1.3140
8.2486
0.1920
9.7546
45
Hugli
Bansberia
1.5736
1.3838
0.2880
3.2454
59
1.4661
2.9183
0.2880
4.6724
53
Haora
Bally (CT)
2.0543
0.6907
0.2052
2.9502
60
1.6815
1.0568
0.1572
2.8956
55
Class-I Cities Falling outside Kolkata Urban Agglomeration (19)
Burdwan
Jamuria
1.3648
186.2829
0.3360
187.9837
2
0.6315
63.8459
–3.4097
61.0677
4
Jalpaiguri
Jalpaiguri
1.6382
161.0921
–3.1006
159.6297
4
0.7552
46.7165
–2.1341
45.3375
10
Burdwan
Durgapur
3.3313
83.9105
14.6562
101.8980
5
2.7999
66.3204
2.0416
71.1620
3
Uttar Dinajpur
Balurghat
2.5808
93.0610
0.7200
96.3618
6
0.8347
23.6006
–2.2865
22.1488
21
Darjeeling
Siliguri
3.3146
30.0713
14.0601
47.4459
10
1.3949
28.4160
13.5342
43.3451
12
Maldah
English Bazar
9.8150
39.4097
–1.8336
47.3911
11
1.9112
20.8356
–1.3470
21.3998
22
West Medinipur
Kharagpur
0.8515
44.0375
1.0080
45.8970
12
1.5454
12.6437
0.9599
15.1491
37
Burdwan
Asansol
1.5218
36.3951
1.9201
39.8370
15
1.7311
51.7707
2.8138
56.3156
6
(Table 3 Continued)
(Table 3 Continued)
2011
Downloaded from joi.sagepub.com at JAWAHARLAL NEHRU UNIVERSITY on July 1, 2016
Districts
City Name
Dakshin Dinajpur
Raiganj
PHII
SII
1.2512
33.4313
EII
2.3409
2001
OIDI
Rank
(OIDI)
PHII
SII
37.0234
17
0.7076
26.0151
OIDI
Rank
(OIDI)
2.1539
28.8766
16
EII
Darjeeling
Darjeeling
4.7476
28.2384
2.4464
35.4324
18
2.1795
51.8741
2.3111
56.3647
5
Burdwan
Barddhaman
2.2848
47.1640
–17.7857
31.6631
21
1.2445
45.4730
8.9558
55.6733
7
Burdwan
Kulti
1.3932
31.4198
–3.8620
28.9510
22
1.0358
3.8431
–6.7354
–1.8565
60
Bankura
Bankura
2.1413
20.6476
3.0931
25.8819
23
1.1482
16.8956
2.0183
20.0621
24
Murshidabad
Behrampur
1.8344
19.1534
4.7092
25.6970
24
0.4122
24.5652
–7.3006
17.6768
30
West Medinipur
Medinipur
1.3331
28.1548
–4.3243
25.1636
25
1.4545
16.9367
0.4800
18.8712
27
Purulia
Purulia
0.8561
14.9122
–4.3723
11.3959
45
1.3158
24.2497
–1.3866
24.1789
18
Burdwan
Raniganj
2.0972
4.2077
0.7680
7.0730
54
1.5219
29.4078
0.5280
31.4577
15
Purba Medinipur
Haldia
1.9169
43.3694
–39.1631
6.1232
57
1.1329
28.7012
–6.4306
23.4035
19
Darjeeling
Dabgram
1.1132
0.1210
–5.0443
–3.8102
61
N.A.
N.A.
N.A.
N.A.
59
Source: Computed from Census 2001 and 2011 data.
Note: Figures in the parentheses indicate number of Class-I cities under the concerned Region; N.A. denotes data not available.
47
Haque
Figure 3. Physical Infrastructure Development Index in Class I Cities of West Bengal: 2001 and 2011
Source: Prepared from Town Directory data 2001 & 2011 Census (W.B.).
Downloaded from joi.sagepub.com at JAWAHARLAL NEHRU UNIVERSITY on July 1, 2016
48
Journal of Infrastructure Development 8(1)
Figure 4. Social Infrastructure Development Index in Class I Cities of West Bengal: 2001 and 2011
Source: Prepared from Town Directory data 2001 & 2011 Census (W.B.).
Downloaded from joi.sagepub.com at JAWAHARLAL NEHRU UNIVERSITY on July 1, 2016
49
Haque
Figure 5. Economic Infrastructure Development Index in Class I Cities of West Bengal: 2001 and 2011
Source: Prepared from Town Directory data 2001 & 2011 Census (W.B.)
Downloaded from joi.sagepub.com at JAWAHARLAL NEHRU UNIVERSITY on July 1, 2016
50
Journal of Infrastructure Development 8(1)
Figure 6. Overall Infrastructure Development Index in Class I Cities of West Bengal: 2001 and 2011
Source: Prepared from Town Directory data 2001 & 2011 Census (W.B.).
Downloaded from joi.sagepub.com at JAWAHARLAL NEHRU UNIVERSITY on July 1, 2016
51
Haque
Figure 7. Level of Infrastructure Development in Class I Cities of West Bengal: 2001
Source: Prepared from Town Directory data 2001 & 2011 Census (W.B.).
Downloaded from joi.sagepub.com at JAWAHARLAL NEHRU UNIVERSITY on July 1, 2016
52
Journal of Infrastructure Development 8(1)
Figure 8. Level of Infrastructure Development in Class I Cities of West Bengal: 2011
Source: Prepared from Town Directory data 2001 & 2011 Census (W.B.).
Downloaded from joi.sagepub.com at JAWAHARLAL NEHRU UNIVERSITY on July 1, 2016
53
Haque
In terms of their social infrastructure development, the highest improvement has been noticed in cities
like Halisahar, Kulti, Balurghat, Kharagpur, Jalpaiguri, Bhatpara, Haora, Jamuria, Habra and Barasat. On the
other hand, a rapid decline in this infrastructure during the last decade has been seen in 24 class-I cities, for
instance, Kolkata (proper), Titagarh, Raniganj, South Dum Dum, Bidhannagar, Bansberia and Darjeeling.
Unlike the physical and social infrastructure development, the economic infrastructure in class-I
cities of West Bengal has displayed relatively less improvement during the last decade. The proportion
of cities encountering decadal improvement in economic infrastructure base, for instance, is quite low as
compared to their respective physical and social infrastructure development with the corresponding
figure being 50 per cent. Figure 5 makes it evident that the length of the bar graph is higher in 2011 than
that for 2001 in 31 cities, indicating some improvement in this infrastructure during last 10 years, for
example, Kanchrapara, Dum Dum, Haora, Bally (M), Durgapur, Haldia, Hugli-Chinsurah, Purulia,
Bhatpara and Bhadreswar. On the other hand, economic infrastructure in fewer than 50 per cent cities
declined markedly during the same period, such as Ashoknagar Kalayangarh, Uluberia, Medinipur,
Barasat, Burdwan, Berhampore, Balurghat, Basirhat and Jamuria among others.
In the forthcoming section, analysis of the category-wise level of overall infrastructure development
and their nature of decadal development has been studied (see Figures 6–8).
3.1.1 Very High Level
In 2001, one-fifth of the total Class-I cities have shown a very higher level of infrastructure development
such as the state capital, Kolkata, with an estimated composite index value of 382.0924, Bidhannagar
(81.6700) being the second highest in this respect followed by Durgapur (71.1620) and Jamuria (61.0677).
Others following them are the towns of Darjeeling, Asansol, Burdwan, South Dum Dum, Haora,
Jalpaiguri, Panihati while Siliguri is positioned at the 12th rank. This can possibly be attributed to the
fact that these large urban centres are the crucial nodes for business, education, health and industries
besides being a hub of readily available vital services since their inception and over a long time duration.
In almost all the sectors, they are well ahead of the other cities in this state, basically in terms of roads
connectivity, sanitation facilities and sewerage efficiency, water supply, health and educational services,
electric facilities and have a diverse economise across scales.
In the 2011 Census, nearly 23 per cent of the class-I cities reported a very higher level of infrastructure development in West Bengal, which is 3.28 percentage points greater than that from the 2001 Census.
Thus the pace of infrastructure development in the Class-I cities could be assumed to be increasing.
Again Kolkata ranked first, with an estimated index value of 198.9665 in 2011. Jamuria, which ranked
fourth in the preceding decade, moved into the second position with an estimated index value of 187.9837
as per the 2011 Census (Table 3). Haora city replaced Durgapur, acquiring the third position in 2011
while Durgapur dropped to fifth behind Jalpaiguri. Similarly, Panihati and Siliguri were positioned
eighth and tenth respectively. As many as seven cities from the medium, low and high categories have
moved to the very high level of infrastructure development in 2011, for example, Bhatpara, Balurghat,
English Bazar, Barasat, Dum Dum, Kharagpur and Bally (M) now occupy 7th, 6th, 11th, 9th, 14th, 12th
and 13th rank, respectively. Surprisingly, five entities, namely, Bidhannagar, Darjeeling, Asansol,
Burdwan and South Dum Dum have lost their position during the last decade and moved down to the
high and low infrastructure category, implying a relatively lower rate of infrastructure development in
these cities as compared to the earlier decade.
3.1.2. High Level
The colonial city of Chandannagar, mining city of Raniganj and Bally (M) were the cities of high level
of infrastructure development in 2001 Census, being relatively medium and small cities with lesser base
population as well as smaller area having comparatively higher road density, road alight points and other
Downloaded from joi.sagepub.com at JAWAHARLAL NEHRU UNIVERSITY on July 1, 2016
54
Journal of Infrastructure Development 8(1)
social infrastructure facilities. In the next decade, Bally (M) moved to the very high category while
Chandannagar and Raniganj shifted to lower level of infrastructure development in 2011 Census. As
many as seven cities, namely, Asansol, Bidhannagar, Darjeeling, Burdwan from the very high category,
Raiganj from the medium category and Kalyani and Kanchrapara from the low category, have been classified to have had a higher level of infrastructure development respectively.
3.1.3. Medium Level
The share of cities enjoying medium level of infrastructure development recorded a gradual increase,
that is, 3.28 per cent point during 2001–11. In 2001, cities like Raiganj, Serampore, Purulia, Haldia,
Bhatpara, Balurghat, English Bazar, Rajpur-Sonarpur and Bankura appeared to be moderately developed
in terms of their infrastructure base. Three cities namely Serampore, Raiganj and Bankura retained their
erstwhile position whereas the rest of these towns, barring Purulia, were pushed upward into the higher
and very higher level of infrastructure development category in 2011 Census showing some improvement in their infrastructure status. On the contrary, another ten cities from the very low, low and high
category shifted to the medium level of infrastructure development group in the first decade of twentyfirst century, for example, Kulti, Bankura, Berhampore, Medinipur, Krishnanagar, Chandannagar,
Kamarhati, Habra, Uluberia and Rajpur-Sonarpur.
3.1.4. Low Level
Cities with a low level of infrastructure facilities dominate the urban scene in West Bengal during both
the Census periods, possibly highlighting the overall malaise in the urban development scenario in this
state. However, the number of cities in this category registered a marginal decline in the 2011 Census as
compared to what it was in the preceding Census. However, nearly 28 per cent cities (which is also
higher than that of remaining four categories) still experienced low infrastructure development in West
Bengal. Along with smaller Class-I cities, many medium sized and large Class-I cities also seem to have
low infrastructure facilities. From Figure 7, it becomes apparent that, out of the 61 cities in the 2001
Census, 20 were in the low infrastructure development category, for example, Barasat, Uluberia,
Medinipur, Baranagar, Kanchrapara, Berhampore, Kalyani, Bongaon, Hugli-Chinsurah, Kamarhati,
Dum Dum, Krishnanagar, Kharagpur, Rajarhat-Gopalpur, Naihati, Madhyamgram, Ashoknagar
Kalyangarh, Nabadwip, Maheshtala and Barrackpore. Furthermore, nine of them remained in the low
level of infrastructure development category also in the next decade, for example, Baranagar, Bongaon,
Hugli-Chinsurah, Naihati, Madhyamgram, Ashoknagar Kalyangarh, Nabadwip, Maheshtala and
Barrackpore. The possible explanation of this could be that despite having a sizable base population,
these cities markedly lacked the crucial physical and other infrastructure facilities coupled with other
important civic functions. Some of the cities in this low level group, however, moved to a higher category of infrastructure development in the 2011 Census, namely Barasat, Uluberia, Kanchrapara, Dum
Dum and Kharagpur among others. Concomitantly, in the 2011 Census, South Dum Dum got placed in
the low category from its earlier higher status, something seen also for Purulia town. Contrarily, cities
like Rishra, Khardaha, Basirhat, Bhadreswar, Baidybati and Halisahar have now appeared in this category from their earlier very low category, revealing some good sign as far as their infrastructure development is concerned.
3.1.5 Very Low Level
As many as 17 out of the total 61 class-I cities have flagged a very low level of infrastructure development in 2001 Census in West Bengal and the corresponding figure for the last Census is almost 12,
suggesting a gradual improvement of infrastructure facilities in these Class-I cities. Notable among them
were Titagarh, Uttarpara-Kotrung, Khardaha, Rishra, Champadani, Basirhat, North Dum Dum and
Downloaded from joi.sagepub.com at JAWAHARLAL NEHRU UNIVERSITY on July 1, 2016
55
Haque
Bhadrsewar, followed by Bansberia, North Barrackpore, Bally (CT), Halisahar, Shantipur, Baidyabati,
Kulti, Dabgram and Habra. Nine of them did not report any improvement in their level of infrastructure
facilities in 2011 Census, such as, Titagarh, Uttarpara-Kotrung, Champadani and North Dum Dum being
followed by Bansberia, North Barrackpore, Bally (CT), Dabgram and Shantipur as well. On the other
hand, three cities namely Raniganj, Haldia and Rajarhat-Gopalpur, which enjoyed relatively better infrastructure facilities in the preceding decade, have also been grouped in the very low level of infrastructure
development in the last Census. Furthermore, very poor composite index values have been obtained by
these cities. Basically most of them served as regional urban centre but enjoyed considerably low level
of infrastructure and for some vital facilities: health, education, firefighting services, for instances, the
inhabitants seem to have often depended on the nearest larger class-I cities. This implies that the population growth of these cities has not kept pace with their infrastructure development.
3.2. Pace of Infrastructure Growth in Class-I Cities
Here, I have examined the temporal changes which have occurred with regard to the infrastructure growth
for each city in West Bengal during 2001–11. For this purpose, the values of composite indices of both the
reference periods for these cities have been utilised. For the sake of temporal comparability of the composite indices, I have used the component score coefficient of the base year (2001) as weightage for the
2011 Census as well (see the methodology section). Then I simply computed the per cent change of the
index values (Table A1). The tabulated result shows that nearly 30 per cent of cities have recorded a
remarkable growth in their estimated composite index values during 2001–11. A more than two to seven
times increase has been achieved by the urban entities, such as Baidybati, Shantipur, Balurghat, Halisahar,
Haora, Jamuria, Kharagpur, English Bazar, Kulti and Bhatpara. A positive but relatively sluggish growth
of the index value has also been witnessed in 33 per cent of the total Class-I cities in West Bengal, for
example, Kanchrapara, Khardaha, Kalyani, Krishnanagar, Maheshtala, Panihati, Berhampore, Kamarhati,
Barrackpore, Durgapur and Siliguri. It is also discernible from this analysis that more than one-third of the
total class-I cities appear to have tallied a negative change in their composite index value during the examined period, indicating some deterioration in the status of their respective infrastructure facilities in the last
Census than that during the preceding one. It is quite surprising to note that some large cities, which have
enjoyed a marked urban primacy since their inception, fall under this category. Such cities are the state
capital of Kolkata, Asansol, Burdwan, Darjeeling, Raniganj, South Dum Dum, Chandannagar and Haldia,
which are followed by Titagarh, Serampore, Rajarhat-Gopalpur, Purulia and Bidhannagar.
By and large, nearly two-thirds of the total Class-I cities have experienced some positive sign in terms
of their infrastructure development in West Bengal during the last decade, which is obviously a welcome
phenomenon. From the entire analysis, it may be deduced that the large cities (Kolkata, Asansol,
Durgapur, Siliguri, Haora, Bhatpara, Burdwan, Bally (M) and Barasat) have better infrastructure facilities whilst the relatively smaller cities in West Bengal are in a destitute situation as far as their infrastructure availability is concerned.5 This can possibly be attributed to the fact that whatever government
programmes, policies are formulated and public as well as private investments are introduced, they are
broadly directed towards large cities like Kolkata, Durgapur, Asansol, Burdwan, Haora and Siliguri
among others. Although some programmes and policies are being initiated but due to their large population bases, available resource crunch and extreme budgetary deficits, the smaller and medium sized
class-I cities benefit meagrely from the planning initiatives. Actually bigger cities have better infrastructure facilities than that of their lower order counterparts and the prime reasons behind this is that the
many of the small and medium towns or cities do not have the capacity to meet the challenges of globalisation because of their destitute financial position (Bhagat 2002).
Downloaded from joi.sagepub.com at JAWAHARLAL NEHRU UNIVERSITY on July 1, 2016
56
Journal of Infrastructure Development 8(1)
3.3. Comparison of Infrastructure Development across Cities Falling Within and
outside the KUA (and Variations among the KUA Constituents)
As discussed in the forthcoming sections, the summary statistics for the various infrastructure indices
shows a wide range of variations across and within this region. The standard deviations (SD) and coefficient of variation of the four indices—PHII, SII, EII and OIDI—are measures of dispersion across
cities within the KUA region and outside it. The higher the dispersion, the more inequality there is
among cities of a particular region. Table 4 displays useful insights into the concentration of infrastructure aspects within KUA and outside KUA. An additional advantage of this empiric is that it could be
compared across regions lucidly on the ground that it measures variation rather than absolute levels. The
findings reveal that class-I cities falling under KUA and outside KUA region are spatially unequal in
various aspects. For instance, in 2001, all the four indices indicated that inequalities across class-I cities
are more pronounced within the KUA than outside it and that they are even higher than that of the aggregate level inequality as well (Table 4). In 2011, however, the picture appeared to be quite different as
class-I cities falling outside the KUA exhibit a notably greater inequality with respect to their physical,
social and over all infrastructure development indices. Contrarily, economic infrastructure inequality
across cities rises towards the KUA region.
Table 4. Comparison of Infrastructure Development across Class-I Cities Falling under KUA and outside KUA
2011
Facts
PHII
SII
2001
EII
OIDI
PHII
SII
EII
OIDI
Cities Falling under KUA (42)
Min
0.2318
0.6022
–9.3686
2.9502
0.3379
0.9579
–16.4562
–8.5020
Max
6.6501
138.1419
162.1784
198.9665
5.9795
276.1291
99.9838
382.0924
Mean
1.8949
21.6880
5.3257
28.9087
1.5651
22.3340
1.7024
25.6016
SD
1.3262
24.1052
25.9760
40.6095
1.0024
42.6733
16.0015
58.6110
Variances
1.7588
581.0619
674.7512
1649.1291
1.0049
1821.0084
256.0466
3435.2478
Cities Falling outside KUA (19)
Min
0.8515
0.1210
–39.1631
–3.8102
0.0000
0.0000
–7.3006
–1.8565
Max
9.8150
186.2829
14.6562
187.9837
2.7999
66.3204
13.5342
71.1620
Mean
2.3888
49.7410
–1.7594
50.3704
1.2504
30.6374
0.2509
32.1386
SD
2.0451
49.3845
11.4116
51.1722
0.6494
18.8032
5.0272
20.7618
Variances
4.1825
2438.8301
130.2246
2618.5899
0.4218
353.5588
25.2732
431.0512
Total Class-I Cities (61)
Min
0.2318
0.1210
–39.1631
–3.8102
0.0000
0.0000
–16.4562
–8.5020
Max
9.8150
186.2829
162.1784
198.9665
5.9795
276.1291
99.9838
382.0924
Mean
2.0488
30.4258
3.1189
35.5935
1.4671
24.9203
1.2503
27.6377
SD
1.5842
36.0596
22.6073
44.8655
0.9137
36.9521
13.5280
49.8603
Variances
2.5098
1300.2935
511.0922
2012.9096
0.8348
1365.4560
183.0065
2486.0519
Source: Computed from census data.
Notes: Figures in the parentheses indicate number of class-I cities.
Downloaded from joi.sagepub.com at JAWAHARLAL NEHRU UNIVERSITY on July 1, 2016
57
Haque
Table 5. Level of Infrastructure Development in Class-I Cities by Region
Cities under KUA
2001
Category
Composite Index
Values (OIDI)
Very high
More than 40.00
High
30.00–40.00
Medium
20.00–30.00
2
Low
10.00–20.00
18
Very low
Less than 10.00
15
Total Class-I city
Number
Cities outside KUA
2011
2001
2011
%
Number
%
Number
%
Number
%
5
11.9
7
16.7
7
36.8
7
36.8
2
4.8
3
7.1
1
5.3
4
21.1
4.8
7
16.7
5
26.3
4
21.1
42.9
16
38.1
4
21.1
1
5.3
42
35.7
100
9
21.4
2
42
100.0
19
10.5
100
3
19
15.8
100
Source: Computed from Census 2001 and 2011 data.
Cities falling outside the KUA region have enjoyed comparatively better infrastructure facilities during both the reference periods as evidenced by the higher average OIDI values in this region than that of
the KUA. This holds true even if one looks at the PHII and SII in 2011 as well.
Table 5 further makes it clear that a handful number of cities exhibit a high to very high level of infrastructure development (Kolkata, Haora, Bhatpara, Barasat, Bally (M) and Bidhannagar) and huge number
of small sized class-I cities (Bally (CT), Bansberia, Titagarh, Shantipur, Champadani and Bhadreswar
among others) still stand in a low to very low level of infrastructure development category in KUA. The
corresponding picture for cities falling outside the KUA seems to be quite better (see Figures 7 and 8).
This raises a matter of some concern. The dismal infrastructure status in the relatively small sized class-I
cities is well recorded in KUA. Barring a few large entities, possibly these smaller class-I cities are bereft
of adequate government attention with respect to their infrastructure demand and many of them have
reached saturation point in terms of their population, HHs and available resources as well. By and large,
the very higher degree of inter-regional as well as inter-city infrastructure variations make one feels that
prioritising some handful cities from a particular area as ‘mission cities’ under schemes like the Jawaharlal
Nehru National Urban Renewal Mission (JnNURM) or its recommended new icon called the National
Urban Development Mission (NUDM) or even the so called ‘Smart Cities’ initiatives are not enough. In
the context of resource allocation and central or state-level urban missions, priority should rather be
given to the smaller urban centres and the weakest urban infrastructural areas and aspects where such
amenities are severely deficient.
3.4. Inter Censual Changes and Inter-city Variations of
Access to Basic Amenities and Assets across Class-I Cities
The status of basic amenities and assets available in HHs during last two consecutive Census periods in
Class-I cities of West Bengal is now examined. Table 6 reports the findings for cities falling under KUA,
outside KUA and at the aggregate level.
Access to basic amenities is without doubt a critical aspect for examining the HHs’ quality of living.
In this respect, Bhagat (2011) stresses that access to basic amenities is the most important aspect of the
quality of urbanisation. Basically, urban amenities, such as water, electricity, sanitation and clean fuel are
the critical determinants of living conditions and good health of the urbanites (Ali, Isa and Rahaman
2004; Clegg and Garlick 1979). Though there are an ample number of basic amenities in a community,
Downloaded from joi.sagepub.com at JAWAHARLAL NEHRU UNIVERSITY on July 1, 2016
Table 6. Status of Households’ Basic Amenities and Assets in Class-I Cities of West Bengal (2001–11)
Percentage of HHs to Total HHs
Basic Amenities and
Assets available to the
Households
City Under
KUA
2001
2011
City Outside
KUA
Change
Total City
Class-I Cities (2011)
2001
2011
Change
2001
2011
Change
47.18
52.6
5.42
70.73
73.23
2.5
Highest
Lowest
Main Source of Drinking Water (Within Premises)
Downloaded from joi.sagepub.com at JAWAHARLAL NEHRU UNIVERSITY on July 1, 2016
Tap1
76.65
78.24
Tube well and hand pump
21.6
1.59
Halisahar (97.70)
21.15
–0.45
26.82
28.95
2.13
22.65
22.76
1.75
0.62
–1.13
26
18.45
–7.55
6.62
4.09
87.16
93.64
6.48
73.5
84.35
10.85
84.13
91.45
7.32 Dum Dum and
Darjeeling (97.40)
Dabgram (56.80)
Latrines within premises
93.08
93.82
0.740
74.99
80.88
5.890
89.07
90.77
1.7
Jamuria (44.50)
Pit latrine
23.07
16.71
–6.362
14.88
10.79
–4.086
21.25
15.32
–5.93 Ashok Nagar (64.80) Darjeeling (0.50)
Water closet
63.90
76.35
12.449
52.47
68.95
16.478
61.36
74.62
13.26 Uttarpara-Kotrung
(92.40)
Uluberia (27.50)
Other latrine3
6.11
0.75
–5.357
7.64
1.13
–6.511
6.45
0.84
–5.61 Dabgram (4.30)
Bansberia (0.10)
HHs having no latrine
6.92
6.18
–0.741
25.01
19.12
–5.891
10.93
9.23
–1.7
Rajarhat-Gopalpur (1.13)
Others2
0.11 Berhampore (88.50)
Dabgram (5.00)
–2.53 Dabgram (87.8)
Darjeeling (0.30)
Dum Dum (0.30)
Power (Electricity)
Electricity
Latrine Facilities
Rajarhat-Gopalpur
(98.70)
Jamuria (55.50)
Sewerage/Bathroom Facilities
Bathroom within premises 65.28
83.6
18.32
57.20
74.58
17.38
63.48
81.46
Closed drainage
30.77
40.37
9.60
14.56
16.04
1.48
27.17
34.59
17.98 Dum Dum (87.50)
7.42 Kolkata (81.30)
Dabgram (2.80)
Open drainage
46.49
43.27
–3.22
50.42
58.76
8.34
47.36
46.95
–0.41 Panihati (83.10)
Kolkata (13.80)
No drainage
22.74
16.36
–6.38
35.02
25.2
–9.82
25.46
18.46
–7
Titagarh (2.10)
61.79
3.64
51.19
51.81
0.62
41.82
59.44
17.62 Darjeeling (92.80)
Uluberia (72.50)
Uluberia (23.50)
Energy Consumption for Cooking
LPG/PNG
58.15
Jamuria (11.60)
Availing Banking Facility
Banking
63.97
77.73
13.76
58.94
69.64
10.71
62.84
75.81
Radio/transistor
46.85
37.97
–8.87
36.88
16.76
–20.12
44.61
32.94
Television
63.72
78.88
15.17
60.98
73.08
12.11
63.1
77.51
12.97 Dum Dum (88.00)
Dabgram (30.00)
Assets
–11.67 Kolkata (47.50)
14.41 Darjeeling (88.60)
Balurghat (6.60)
Dabgram (45.40)
a. Computer/Laptop
With internet
Downloaded from joi.sagepub.com at JAWAHARLAL NEHRU UNIVERSITY on July 1, 2016
Without internet
9.59
5.03
8.51
Bidhannagar (29.40)
Dabgram (0.90)
10.88
9.91
10.65
Khardah (14.90)
Dabgram (4.60)
Khardah (9.00)
Raniganj (2.00)
Darjeeling (81.90)
Bidhannagar (42.80)
b. Telephone/Mobile, etc.
Landline only
5.23
3.79
4.89
Mobile only
65.19
64.50
65.02
Both land and mobile
23.14
13.39
–9.76
16.31
9.22
–7.09
21.61
12.4
–9.21 Bidhannagar (38.70)
Dabgram (1.80)
40.73
47.42
6.69
61.97
66.05
4.08
45.5
51.84
6.34 Hugli-Chinsurah
(82.60)
Darjeeling (1.10)
Two-wheelers4
8.21
12.59
4.37
17.92
26.80
8.88
10.39
15.96
5.57 Durgapur (39.60)
Darjeeling (2.50)
Car/jeep/van
4.37
3.34
4.14
5.64
1.5
Bidhannagar (25.60)
Titagarh (1.00)
Bidhannagar (24.80)
Titagarh (1.00)
c. Other Assets
Bicycle
5.83
1.46
HHs with TV, computer/laptop,
telephone/mobile phone and
scooter/car
7.04
7.04
Assets not specified
5.43 –13.36
18.80
18.89
5.03
1.68
7.94
7.94
8.23
–10.67
7.26
18.82
6.1
–12.72 Raiganj (17.80)
Source: Computed from Census data 2001 and 2011.
Notes: 1Tap includes both treated and untreated sources.
2
Include well, spring, river, canal, tank, pond, lake and others sources.
3
Include night soil disposed into open drain, service latrine: night soil removed by human, service latrine: night soil serviced by animal.
4
Two-wheelers include scooter/motorcycle/moped.
North Barrackpore
(2.50)
60
Journal of Infrastructure Development 8(1)
various literatures, however, accentuate three main aspects, namely, drinking water, sanitation and electricity (Das and Nipun 2012; Kundu 1999; Shaw 2007).
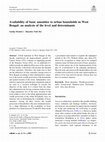
1. Source of drinking water: Want for clean drinking water is crucial but minimal as it is less than
1 per cent of the aggregate water demand (Planning Commission 2008). There is a multi-faceted
impact of safe drinking water as basically it lessens risk of diseases and deaths, decreases expenditure on health and thus saves money and enhances the quality of human life. Sources of safe
drinking water covers taps (treated and untreated), hand pumps and tube wells. It is observed that
(Table 6, see also Figure 9) more than 78 per cent HHs of class-I cities falling under the KUA
are getting access to tap water within their premises in 2011, which is also 1.59 per cent points
higher than in the earlier decade. The corresponding igure for cities located outside the KUA is
only 53 per cent in 2011, which is also lower than the total average. In this regard, however, the
outside KUA cities have witnessed the highest decadal improvement (5.42 per cent). Halisahar
(97.70 per cent) tops the ranks in tap water usage while Dabgram (5 per cent) is at the bottom.
The proportion of HHs having tube wells and hand pumps as the main source of drinking water
appears to be higher outside the KUA than within it. Berhampore in Murshidabad district is the
top user (88.50 per cent) in this category and Darjeeling (possibly due to its topographic location)
is in the last position (0.30 per cent) as per the 2011 Census. Per cent of HHs receiving drinking
water from other sources like wells, ponds, rivers, canals and tanks also seems to be higher outside
the KUA in 2011, however recording a 7.55 per cent point reduction from preceding 2001 Census.
The corresponding igure for the KUA in this category is marginal.
2. Power (electricity): Provision of electricity in the HHs is positively correlated to a higher quality of living (Das and Mistri 2013, 166). Results from correlation analysis (Table 7) helped infer
that the supply of electricity to the HHs is strongly and positively correlated to ownership and
use of radios, televisions, availing of banking facility, having a bathroom within the premises and
liqueied petroleum gas (LPG)/piped natural gas (PNG) connections, while the electricity supply
was moderately but also positively correlated to owning a computer or laptop with or without an
Internet connection, having a cellular phone, access to tap water and latrine facilities within the
premises. Thus all these select basic amenities and assets seem to have a statistically signiicant
positive relation with the HHs electricity and indicate that the HHs having them are more well off
in terms of living standards. However, the picture of electricity facilities depicts a wide inter-city
disparity (Figure 10). As many as 93.64 per cent of HHs in class-I cities under the KUA get electricity services in 2011, which is notably higher than that outside the KUA. However, highest decadal improvement has occurred outside the KUA (10.85 per cent), possibly due to a lower initial
base value. Dum Dum and Darjeeling (97.40 per cent) are the highest electriied HHs cities and
Dabgram (56.80 per cent) is the lowest electriied city as far as 2011 Census is concerned. This
suggests that the provision for electricity facilities in class-I cities in West Bengal has improved
considerably during the last decade. However, almost 16 per cent HHs do not have electricity connections in urban areas outside the KUA and this needs to be addressed at the earliest.
3. Sanitation: The third vital basic requirement is sanitation facilities. In common parlance, when
one talks about quality health and hygiene, two prime aspects are involved, provision of safe
drinking water as well as sanitation. Basically sanitation is a broad concept consisting of personal
hygiene, clean potable water, domestic sanitation, garbage disposal, excreta disposal and waste
water outlet (Ministry of Drinking Water and Sanitation, 2012). It has unequivocally been believed that a sanitary toilet, within or near the HHs, gives privacy and dignity to women (Planning
Commission 2008).
Downloaded from joi.sagepub.com at JAWAHARLAL NEHRU UNIVERSITY on July 1, 2016
61
Haque
Figure 9. Percent of HHs having Access to Tap Water Facility within the Premises in Class I City, W.B. (2011)
Source: Prepared by Author using Census 2011 data.
Downloaded from joi.sagepub.com at JAWAHARLAL NEHRU UNIVERSITY on July 1, 2016
62
Journal of Infrastructure Development 8(1)
Table 7. Pearson Correlations between Electricity and Households Assets and Basic Amenities, Class-I Cities,
West Bengal (2011)
Facts
Electricity Radio
TV
Electricity
1
Radio
0.621**
1
TV
0.798**
0.489** 1
0.475**
0.132
Mobile
1
0.580
**
0.816
**
0.461
**
Latrines
0.441
**
Bathroom
0.690**
LPG/PNG
**
Computer/laptop
Bank
Tap
2
0.648
Mobile
Tap
LPG/
Latrines2 Bathroom PNG
0.539** 1
0.536
**
0.546
**
0.295
*
0.483
**
0.712** 0.082
0.865
**
0.391
0.427
**
0.426
**
1
**
0.741**
1
0.051
0.365**
0.482**
0.222
**
**
0.410
0.522** 0.917** 0.411**
0.503
Computer/
Laptop1
Bank
**
0.851
**
0.421
**
0.394
0.705**
0.832**
**
**
0.751
0.774
1
–0.133
0.379**
0.207
1
0.587**
0.657
**
1
0.892**
1
Source: Computed from Census data 2011.
Notes: 1Computer/laptop with and without internet connections; 2Latrines within premises; **Correlation significant at 0.01
level (2-tailed), *Correlation significant at 0.05 level (2-tailed), N = 61.
i. Latrine facility: Nearly 94 per cent of the HHs have in-house latrine facilities in class-I cities
under KUA in 2011. The corresponding igure for cities outside the KUA is 81 per cent, which is
lower than the aggregate level as well, but reporting a 6 per cent point decadal growth. RajarhatGopalpur ranks top (98.70 per cent) in HHs with latrine facilities within their premises and
Jamuria is at the bottom position (44.50 per cent). Percentage of HHs having pit latrine facilities
reduced in both the regions in 2011 than that in the preceding Census. Ashoknagar Kalyangarh
is the top ranker (64.80 per cent) in this respect and Darjeeling is at the bottom (0.50 per cent).
Higher than 76 per cent HHs have water closet latrine within the KUA as per the last Census.
Though the inter-censual improvement is considerably higher in areas outside the KUA, still 31
per cent HHs do not have access to this facility within their premises. Uttarpara-Kotrung is the
highest user (92.40 per cent) whilst Uluberia is the least (27.50 per cent). The per cent of HHs
using other category of latrine facilities recorded a sharp decline during the recent decade. This
implies that the people are more likely to accept relatively sophisticated means of latrine facilities, such as water closet. However, about 10 per cent of HHs do not have any latrine facility
at all in their premises across all Class-I cities in West Bengal and the corresponding igure for
the outside KUA region is about 19 per cent (Table 6). For instance, as many as 55.50 per cent
of HHs do not have latrine facility in Jamuria city (Figures 11 and 12). It seems that the smaller
cities are quite devoid of such crucial facilities.
ii. Sewerage/bathroom facility: Table 6 also reveals that about 84 per cent of HHs in cities under
the KUA enjoyed bathroom facilities within their own premises in 2011, while the corresponding igure for cities outside KUA was much lower (75 per cent). Furthermore, a satisfactory
decadal improvement in terms of access to bathrooms within premises is discernible during
the recent decade in all regions. Dum Dum tops (87.50 per cent) in this regard and Uluberia
in the bottom position (23.50 per cent). There is a huge variation in the methods of sewerage
disposal system across the cities (Figures 13 and 14). It is evident that the per cent of HHs having wastewater outlet connected to a closed drainage (CD) system has increased by 10 per cent
Downloaded from joi.sagepub.com at JAWAHARLAL NEHRU UNIVERSITY on July 1, 2016
63
Haque
Figure 10. Percent of HHs having Electric Connection in Class I City, W.B. (2011)
Source: Prepared by Author using Census 2011 data.
Downloaded from joi.sagepub.com at JAWAHARLAL NEHRU UNIVERSITY on July 1, 2016
64
Journal of Infrastructure Development 8(1)
Figure 11. Percent of HHs having Access to Latrine Facility within the Premises in Class I City, W.B. (2011)
Source: Prepared by Author using Census 2011 data.
Downloaded from joi.sagepub.com at JAWAHARLAL NEHRU UNIVERSITY on July 1, 2016
65
Haque
Figure 12. Percent of HHs without Latrine Facility within the Premises in Class I City, W.B. (2011)
Source: Prepared by Author using Census 2011 data.
Downloaded from joi.sagepub.com at JAWAHARLAL NEHRU UNIVERSITY on July 1, 2016
66
Journal of Infrastructure Development 8(1)
Figure 13. Percent of HHs having Access to Bathroom Facility Within the Premises in Class I City, W.B. (2011)
Source: Prepared by Author using Census 2011 data.
Downloaded from joi.sagepub.com at JAWAHARLAL NEHRU UNIVERSITY on July 1, 2016
67
Haque
Figure 14. Percent of HHs having Closed Drainage Connectivity in Class I City, W.B. (2011)
Source: Prepared by Author using Census 2011 data.
Downloaded from joi.sagepub.com at JAWAHARLAL NEHRU UNIVERSITY on July 1, 2016
68
Journal of Infrastructure Development 8(1)
points in KUA during the last Census, that is, from 31 per cent in 2001 to 41 per cent in 2011.
Contrastingly, cities outside the KUA have witnessed little success in this respect, having only
16 per cent of HHs with CD system. The state capital Kolkata is in the highest position with
81.30 per cent HHs having this facility whereas Dabgram is at the bottom (2.80 per cent).
With respect to open drainage, Class-I cities outside the KUA recorded the highest decadal
improvement with 59 per cent HHs in this category in 2011. Panihati holds the top position
(83.10 per cent) and Kolkata is in the lowest position in terms of these facilities. It is observed
that the proportion of HHs having no drainage has declined remarkably in the regional as well
as aggregate levels during the last 10 years, indicating a good sign as far as sewerage facilities
is concerned. However in places, such as Uluberia about 72.50 per cent HHs do not have any
drainage facility for wastewater outlet, which is a matter of concern. From this analysis, it is
apparent that the sewerage system in class-I cities of West Bengal is still in a dismal situation
as nearly half of the HHs are connected to open drains and 18.46 per cent HHs have no bathroom facility within their premises, which in turn makes them severely prone to polluting their
neighbouring environments and can further cascade into detrimental ill health effects.
4. Energy consumption for cooking: LPG or PNG is considered as the cleanest fuel for cooking in the
HHs. Energy consumption pattern for cooking in the HHs in Class-I cities registered a rapid improvement in the last Census, that is, an almost 17.62 per cent points increase from 41.82 per cent
in 2001 to 59.44 per cent in the 2011 Census, indicating a rising pace of overall socio-economic
advancement of HHs during the last decade. In this respect, cities under the KUA have enjoyed a
better position compared to those outside the KUA, recording 62 per cent of their HHs using LPG/
PNG. Darjeeling is the top (92.80 per cent) user of LPG/PNG while Jamuria is the least (11.60
per cent), exhibiting wide inter-city variations in this respect (Figure 15).
5. Availing of banking and credit facilities: Wide and easy access to banking and credit facilities for
all levels of society is a crucial factor in promoting economic growth and urban development. One
could expect that a higher per cent of HHs availing banking facilities could have a positive impact
on the economic status of a community. The Government of India (GoI) tries to implement the
Banking Correspondent (BC) model where each beneiciary will have a ‘UID Bank Account’ (Das
and Mistri 2013). Furthermore, it could be immense useful to avert discrimination and corruptions for transferring payments of various government programmes and policies, for instance, the
National Rural Employment Guarantee Scheme (NREGS), Rajiv Awas Yojana (RAY) payments,
Janani Suraksha Yojana (JSY) and pensions and wages paid to Accredited Social Health Activities
(ASHA). Previous works also conirm that more than half of the HHs enjoy banking facilities in
India (Das and Mistri 2013). In West Bengal, about 75.81 per cent HHs avail banking facilities in
class-I cities in 2011, which is 12.97 per cent point higher than what it was during the preceding
decade. Cities under the KUA have 78 per cent HHs having access to banking services, which
is almost 10 per cent points higher than for HHs outside KUA. Both regions have witnessed a
considerable decadal improvement in this respect as well. Dum Dum ranked irst with 88 per cent
HHs enjoying banking facility and Darjeeling is in the lowest position (30 per cent) revealing a
colossal regional disparity in this facility (Figure 16).
3.5. Households Assets
Assets are primarily stocks of resources which are gathered and held over the period and it offers for
future consumption and means of security against contingencies (Nam et al. 2008). Actually, the ownership
Downloaded from joi.sagepub.com at JAWAHARLAL NEHRU UNIVERSITY on July 1, 2016
69
Haque
Figure 15. Percent of HHs Using LPG/PNG for Cooking in Class I City, W.B. (2011)
Source: Prepared by Author using Census 2011 data.
Downloaded from joi.sagepub.com at JAWAHARLAL NEHRU UNIVERSITY on July 1, 2016
70
Journal of Infrastructure Development 8(1)
Figure 16. Percent of HHs Availing Banking Facility in Class I City, W.B. (2011)
Source: Prepared by Author using Census 2011 data.
Downloaded from joi.sagepub.com at JAWAHARLAL NEHRU UNIVERSITY on July 1, 2016
71
Haque
status of HHs assets is an indirect method for analysing their poverty. Despite this, Gammage (2006) felt
that intra-HHs assets ownership within the members of HHs is also an indirect method to anticipate
intra-HHs inequality. HHs’ assets may be of variety types, such as financial and non-financial (Booysen
et al. 2005) or human, social and natural followed by physical and financial assets (Serrat 2008). In India,
the population Census is undoubtedly a valuable source of information pertaining to various HHs assets
(as enlisted in Table 6, see also Figures 17–22), where HHs having computers or laptops, with or without
Internet connections as well as mobile phone ownership were newly added enumeration parameters in
the 2011 Census.
It is discernible that all HHs assets have increased in both the region-wise and aggregate level from
the 2001 Census to the 2011 enumeration, with the exception of radios and HHs having both landline and
mobile phone ownership (Table 6).
1. Radio/transistor/TV: The proportion of HHs having radios or transistors decreased sharply in
2011 Census from that in 2001 and it is reported to be very high in cities outside the KUA (20.12
per cent points). The possible reason behind this may be the escalating growth of mobile phones
that in turn offers a two-in-one function. Kolkata is the top (47.50 per cent) user of radios or
transistors and Balurghat is the least (6.60 per cent). Concomitantly, HHs enjoying TV facilities
recorded marked increase in class-I cities of West Bengal in 2011 and KUA emerged as the highest, with a 15.17 per cent point increase during last decade, indicating the considerable spread of
entertaining facilities over the last decade.
2. Computer/laptop: Overall, about 8.51 per cent of HHs possess either a computer or a laptop with
an Internet connection while nearly 11 per cent HHs have the same without the Internet facility,
as per the 2011 Census, in class-I cities of West Bengal. Cities under the KUA showcase a much
better condition in this respect compared to those falling outside it (Table 6). A marked inter-city
variation has been noticed as Bidhannagar is the highest (29.40 per cent) in computer or laptop
user-ship with an Internet connection and Dabgram is the lowest (0.90 per cent) (Figure 19). On
the other hand, Khardaha (14.90 per cent) is the top ranker with HHs possessing a computer or a
laptop without any Internet connection, whereas Dabgram is at the bottom position (4.60 per cent)
with the same facility.
3. Telephone/mobile: As per the 2011 Census, a robust growth has been discernible in case of mobile
phones, that is, around 65 per cent HHs own them, whereas only 4.89 per cent HHs have only landline facility. In this respect, cities falling under the KUA and outside it showed quite negligible
variations. Basically, gradual liberalisation and institutional reforms within the telecom sectors in
the wake of 1980s are conducive for this drastic change (Das and Mistri, 2013). Similar to other
assets, a wide inter-city disparity persists here. Darjeeling is the top ranker (82 per cent) having
maximum mobile users and Bidhannagar is at the bottom (42.81 per cent). However, HHs possessing both landlines and mobile facilities declined notably in this decade as compared to the
previous one and this decline is higher for areas under the KUA.
4. Other assets: The most recent Census witnessed that about 66 per cent HHs have bicycles among
cities situated outside the KUA as compared to 47.42 per cent within the KUA. Hugli-Chinsurah
(82.60 per cent) is the top bicycle user and Darjeeling (possibly due to terrain conditions) is the
lowest (1.10 per cent). HHs possessing two-wheelers are also recorded to be higher in areas outside the KUA (27 per cent) with 9 per cent point decadal growth in this aspect. Durgapur is on top
(39.60 per cent) and Darjeeling (2.50 per cent) is at the bottom position. Similarly, HHs having
cars, jeeps or vans also increased but only marginally in 2011 as compared to the earlier enumeration and this aspect is higher for cities within the KUA. This asset also reveals regional disparity
Downloaded from joi.sagepub.com at JAWAHARLAL NEHRU UNIVERSITY on July 1, 2016
72
Journal of Infrastructure Development 8(1)
Figure 17. Percent of HHs having Radio in Class I City, W.B. (2011)
Source: Prepared by Author using Census 2011 data.
Downloaded from joi.sagepub.com at JAWAHARLAL NEHRU UNIVERSITY on July 1, 2016
73
Haque
Figure 18. Percent of HHs having Television (TV) in Class I City, W.B. (2011)
Source: Prepared by Author using Census 2011 data.
Downloaded from joi.sagepub.com at JAWAHARLAL NEHRU UNIVERSITY on July 1, 2016
74
Journal of Infrastructure Development 8(1)
Figure 19. Percent of HHs having Computer/Laptop with Internet Connections in Class I City, W.B. (2011)
Source: Prepared by Author using Census 2011 data.
Downloaded from joi.sagepub.com at JAWAHARLAL NEHRU UNIVERSITY on July 1, 2016
75
Haque
Figure 20. Percent of HHs with Bi-Cycle in Class I City, W.B. (2011)
Source: Prepared by Author using Census 2011 data.
Downloaded from joi.sagepub.com at JAWAHARLAL NEHRU UNIVERSITY on July 1, 2016
76
Journal of Infrastructure Development 8(1)
Figure 21. Percent of HHs Possessing Two-Wheelers in Class I City, W.B. (2011)
Source: Prepared by Author using Census 2011 data.
Downloaded from joi.sagepub.com at JAWAHARLAL NEHRU UNIVERSITY on July 1, 2016
77
Haque
Figure 22. Percent of HHs Possessing Car in Class I City, W.B. (2011)
Source: Prepared by Author using Census 2011 data.
Downloaded from joi.sagepub.com at JAWAHARLAL NEHRU UNIVERSITY on July 1, 2016
78
Journal of Infrastructure Development 8(1)
in its distribution as Bidhannagar is the top user of these vehicles (25.60 per cent) and Titagarh is
the lowest (1 per cent) (Figures 20–22). Per cent of HHs possessing each of the following assets—
televisions, computers or laptops, landline telephone or mobile phones and two-wheelers are almost equal in 2011 across both the region. Bidhannagar is at the top (24.80 per cent) and Titagarh
is at the bottom position (1 per cent) in this respect. One should bear in mind that still more than
6 per cent HHs did not report any assets in their Houses as per 2011 Census, this igure being 13
per cent point less than that enumerated during the 2001 Census.
From the above assessment, it could be argued that the HH level availability of infrastructure in class-I
cities during last decade (basic amenities and assets) has improved strikingly. It is also found that the
Class-I cities falling under the KUA enjoyed much better urban amenities and owned more essential
assets as compared to the cities located outside the KUA. Therefore, whatever success is gained towards
the development of all the Class-I cities in West Bengal is disproportionately distributed across them and
thus reflects a marked inter-city disparity. This could possibly be responsible for the fact that the relatively larger Class-I cities have a higher per capita income, accrue a larger share of manufacturing activities
and correspondingly, a higher level of investment in basic amenities across the board. Medium and
smaller class-I cities, on the other hand, are quite different in terms of their economies of scale and other
factors. These affect their level of basic infrastructure and other vital basic services, resulting in a yawning disparity across the various cities (Kundu 1999, 1895).
4. Conclusion
The forgoing analysis helps conclude that infrastructure development in Class-I cities in West Bengal is
in an apparently accelerating phase. The present study strongly manifests that the status of physical and
social infrastructure across the class-I cities has improved reasonably while economic infrastructure has
rather lagged behind, during the last decade. As far as the overall infrastructure development is concerned, many cities have shifted towards medium, high and very higher level of infrastructure development category from their earlier low and very low level categories. It implies that some progress in
providing infrastructure facilities has been achieved during the most recent decade. It is further observed
that cities in the low and very low level of infrastructure development category dominate the urban scene
in West Bengal. Whatever improvement in terms of the infrastructural facilities has been discernible
during the last decade are almost totally confined to a few large cities like the state capital Kolkata,
Haora, Asansol, Durgapur, Siliguri, Burdwan and Bally (M). These cities have enjoyed a fairly higher
level of infrastructure facilities and civic amenities as well. The relatively smaller Class-I cities report
poorly in this regard with very low composite index values. This can possibly be attributed to the fact
that big cities received greater attention from policy makers and larger investments, thereby enabling
good finance management in urban service delivery mechanisms. Thus, the rest of the small cities get
severely marginalised as they have been pushed to the very low and low level of infrastructure development over the decades, thus cumulating into a colossal inter-city disparity. In terms of their overall
level of infrastructure development, about 48 per cent of the total Class-I cities encountered very lowto-low level of infrastructure facilities in 2011 implying a dismal status of infrastructure in these
smaller sized Class-I cities.
It is further evident that three-fourths of the total cities examined recorded considerable growth in
their infrastructure base during the 2001–11 time frame. The pace of infrastructural facility growth in
larger cities is recorded as sluggish (possibly due to the higher base values) as compared to many medium
Downloaded from joi.sagepub.com at JAWAHARLAL NEHRU UNIVERSITY on July 1, 2016
79
Haque
and small cities, apparently due to their inability to update the existing infrastructure base at the required
level. Comparatively higher inequalities in infrastructure development across Class-I cities were found
within the KUA than outside it in 2001, and they were even higher than that of the aggregate level inequality. However, the Class-I cities falling outside the KUA exhibit notably greater inequality with
respect to their physical, social and over all infrastructure development in 2011.
Cities falling within the KUA highlighted comparatively poor infrastructure development during both
the reference periods as 60 per cent of these Class-I cities still ranked in the low to very low level of
infrastructure development category. The corresponding scenarios for cities situated outside the KUA
seem to be comparatively much better.
The HH level availability of infrastructure in class-I cities during last decade (basic amenities and
assets) shows favourable improvements. It is found that in class-I cities falling under the KUA, much
better urban amenities and essential assets could be availed by the residents as compared to the cities
situated outside the KUA. Still, whatever success is gained in providing the services, is disproportionately distributed across the class-I cities in the state giving rise to marked inter-city disparities.
By and large, it is evident that bigger cities enjoy better infrastructure facilities as compared to smaller
ones and that the majority of the smaller cities have served simply as regional service centres, such as
markets, without having adequate infrastructure base for self-growth and development. They are devoid
of some crucial facilities like hospitals and many other civic amenities despite having a sizable population base. This suggests that the availability of infrastructural facilities in urban West Bengal has not kept
pace with city growth. Presently, a greater understanding of the requirement and necessity for introducing new infrastructures alongside the upgradation of the existing ones had occurred. Since the status of
a city’s infrastructures and its productivity and output are inextricably linked, it is highly of paramount
importance that the management and upgradation of the civic infrastructures be considered seriously. In
doing so, the policy maker should furthermore give top priority to the backward regions as well as to the
smaller and medium sized class-I cities through schemes like Integrated Development of Small and
Medium Towns (IDSMT)/JnNURM)/NUDM, without its loopholes, for strengthening the overall infrastructure and economic base.
The above is urgently required so that these urban areas are able to offer employment at a satisfactory
level of productivity and suitable earnings for the increasing labour force, ensure access to basic amenities for all and finally support an adequate population which would lessen the congestion in the large
cities and reinforce balanced urban growth and infrastructure development.
Downloaded from joi.sagepub.com at JAWAHARLAL NEHRU UNIVERSITY on July 1, 2016
Appendix A
Table A1. Per cent Change of Composite Index Values in Class-I Cities of West Bengal (2001/2011)
OIDI
OIDI
Districts
City Name
2011
2001
%
Change
Rank
2011 Districts
City Name
2011
2001
%
Change
Rank
2011
Class-I Cities Falling under KUA (42)
Downloaded from joi.sagepub.com at JAWAHARLAL NEHRU UNIVERSITY on July 1, 2016
Kolkata
Kolkata
198.9665
382.0924
–47.93
1
N 24-Pargonas
Halisahar
10.5703
2.5578
313.25
48
Haora
Haora
187.9744
49.2500
281.67
3
N 24-Pargonas
Ashok Nagar
10.0878
12.5755
–19.78
49
N 24 Parganas
Bhatapara
76.9919
23.2829
230.68
7
N 24-Pargonas
Rajarhat Gopalpur
9.9704
14.9110
–33.13
50
N 24 Parganas
Panihati
66.8075
44.8079
49.10
8
Nadia
Santipur
9.3472
1.8826
396.50
51
N 24 Parganas
Barasat
48.4717
19.3638
150.32
9
N 24-Pargonas
North Barrackpur
8.7116
4.2506
104.95
52
Haora
Bally (M)
45.8679
37.2015
23.30
13
Hugli
Uttarpara Kotrung
7.3040
8.3831
–12.87
53
N 24 Parganas
Dum Dum
43.1575
15.7471
174.07
14
N 24-Pargonas
North Dum Dum
6.4825
5.7293
13.15
55
N 24 Parganas
Bidhannagar
38.7875
81.6700
–52.51
16
Hugli
Champdani
6.2735
7.2088
–12.97
56
N 24 Parganas
Kanchrapara
35.3553
17.7480
99.21
19
N 24-Pargonas
Titagarh
4.4690
9.7546
–54.19
58
Nadia
Kalyani
33.5023
17.4186
92.34
20
Hugli
Bansberia
3.2454
4.6724
–30.54
59
Nadia
Krishnanagar
24.9510
15.3587
62.46
26
Haora
Bally (CT)
2.9502
2.8956
1.89
60
Hugli
Chandannagar
24.5317
34.2286
–28.33
27
Class-I Cities Falling Under Outside KUA (19)
N 24 Parganas
Kamarhati
23.7344
16.3614
45.06
28
Burdwan
Jamuria
187.9837
61.0677
207.83
2
N 24 Parganas
Habra
21.9488
–8.5020
–358.16
29
Jalpaiguri
Jalpaiguri
159.6297
45.3375
252.09
4
Haora
Uluberia
21.4460
19.2401
11.47
30
Burdwan
Durgapur
101.8980
71.1620
43.19
5
Hugli
Serampore
21.2521
25.3309
–16.10
31
Uttar Dinajpur
Balurghat
96.3618
22.1488
335.07
6
S 24 Parganas
Rajpur-Sonarpur
20.5247
20.6274
–0.50
32
Darjeeling
Siliguri
47.4459
43.3451
9.46
10
N 24 Parganas
South Dum Dum
19.3825
49.2788
–60.67
33
Malda
English Bazar
47.3911
21.3998
121.46
11
Hugli
Hugli-Chinsurah
17.5569
16.4920
6.46
34
West Medinipur
Kharagpur
45.8970
15.1491
202.97
12
N 24 Parganas
Bongaigaon
16.4524
16.6120
–0.96
35
Burdwan
Asansol
39.8370
56.3156
–29.26
15
S 24 Parganas
Maheshtala
15.9507
10.4057
53.29
36
Dakshin Dinajpur
Raiganj
37.0234
28.8766
28.21
17
Hugli
Rishra
15.3479
7.0929
116.38
37
Darjeeling
Darjeeling
35.4324
56.3647
–37.14
18
N 24 Parganas
Khardaha
15.1796
7.8016
94.57
38
Burdwan
Barddhaman
31.6631
55.6733
–43.13
21
N 24 Parganas
Basirhat
14.8222
6.6963
121.35
39
Burdwan
Kulti
28.9510
–1.8565
–1659.46
22
N 24 Parganas
Barrackpore
14.5161
10.0679
44.18
40
Bankura
Bankura
25.8819
20.0621
29.01
23
Downloaded from joi.sagepub.com at JAWAHARLAL NEHRU UNIVERSITY on July 1, 2016
N 24 Parganas
Naihati
12.9478
14.7158
–12.01
41
Murshidabad
Behrampore
25.6970
17.6768
45.37
24
Nadia
Nabadwip
12.6984
11.9417
6.34
42
West Medinipur
Medinipur
25.1636
18.8712
33.34
25
Hugli
Bhadreswar
12.0720
5.4929
119.78
43
Purulia
Purulia
11.3959
24.1789
–52.87
45
N 24 Parganas
Madhyamgram
11.7033
12.7398
–8.14
44
Burdwan
Raniganj
7.0730
31.4577
–77.52
54
N 24 Parganas
Baranagar
11.1941
18.4046
–39.18
46
Purba Medinipur
Haldia
6.1232
23.4035
–73.84
57
Hugli
Baidyabati
10.6565
1.4755
622.24
47
Darjeeling
Dabgram
N.A.
61
Source: Computed from Table 3.
Note: N.A. denotes that data are not available.
–3.8102
N.A.
82
Journal of Infrastructure Development 8(1)
Acknowledgement
The author is thankful to the anonymous reviewers whose precious comments and views helped improve
this article. The assistance of Priyank Pravin Patel, assistant professor of Geography, Presidency
University, Kolkata, India during the revision of this paper is gratefully acknowledged.
Notes
1.
2.
3.
4.
KUA consists of several towns/cities of six adjoining districts such as Nadia, North 24 Parganas, South 24
Parganas, Kolkata, Haora and Hoogly. It is the third most populous (total population in 2011: 14,035,959) urban
agglomeration in India after Mumbai and Delhi.
In West Bengal, industrial stagnancy especially decline of large-scale organised industries had started in the
1960s and it was much rapid in 1980s (Giri 1998; Khasnabis 2008). Overall economic growth in West Bengal
has lagged behind the national average over the last two plan periods. Average growth rate of NSDP (Net State
Domestic Product) share from agriculture and industrial sectors also slowed down during 10th and 11th plan
respectively (Bose and Chowdhury 2013).
Bhalla’s study (2007) is evident that agricultural employment in West Bengal decelerated markedly in the
1990s. Some crucial reasons have been put forth to show how agriculture became unproitable, at least for
the small and marginal farmers, who comprise a huge portion of the farmer in this state. For instances, with
the adoption of Structural Adjustment Policy (SAP) offered by the World Bank and International Monetary
Fund (IMF), subsidies on fertilisers and electricity among others, were declined to such a magnitude that the
cost of irrigation, fertilisers and insecticide hiked by 78.01 per cent between 1991–92 and 1996–97, yielding in
a huge increase in paid-out costs of farming (Guin and Das 2015; Khasnabis 2008). Expansion of land under
boro cultivation was minimal by the scarcity of adequate water and food grain prices also fell due to a lack of
demand within the state (Sarkar 2006). All these issues forced many small and marginal farmers to quit farming
(Khasnabis 2008). Apart from that, many HHs industries (handlooms, handicrafts) got affected adversely after
economic reforms.
There are several methods to standardise or to eliminate the scale bias that characterises each indicator, for
instance, Range Equalisation (RE) method and DM method among others. Here, I used the DM method that
permits the coeficient of variation of different indicators to remain different despite making them scale free
and lets these differences be relected in the composite index and ranking (Kundu 1984, 2004). The DM method
involves:
•
•
5.
Computation of the mean for each indicator. For the jth indicator belonging to the rth category, the mean
X*rj would be_Xrij/Z where Xrij is the value of the ith city for jth indicator in the rth category and i= 1,2,…
Z. Z is the number of cities, which is 61 in the present case for each indicator and each category.
Division of each observation of the indicator (Xrij) by respective mean (X*rj).We thus obtain Xrij/X*rj.
These may be called the scale-free values of the indicators.
However, their pace of infrastructure growth is quite slow in the 2011 Census, even Kolkata and Asansol have
witnessed negative change in their composite OIDI (Table A1).
References
Ali, Osman, Z.M. Isa and M.R.A. Rahaman. 2004. ‘The Effect of Urbanization on the Health of Urban Residents’,
Akademika, 65 (July): 111–24.
Bhagat, R.B. 2002. ‘Challenges of Rural–Urban Classification for Decentralized Governance’, Economic and
Political weekly, 37 (25): 2413–16.
Downloaded from joi.sagepub.com at JAWAHARLAL NEHRU UNIVERSITY on July 1, 2016
83
Haque
Bhagat, R.B. 2011. ‘Urbanization and access to Basic Amenities in India’, Urban India, 31 (1): 1–14.
Bhalla, G.S. 2007. Indian Agriculture since Independence. New Delhi: National Book Trust of India.
Bose, P. and S. Chowdhury. 2013. Looking at the Economy. Retrieved from www.indiaseminar.com/2013/645/645_
prasenjit_bose_other.htm (accessed on 25 January 2016).
Booysen, F., S. van der Berg, R. Burger, M. von Maltitz and G. du Rand. 2005, 29–31 August. ‘Using an Asset Index
to Assess Trends in Poverty in Seven Sub-Saharan African Countries’. In International Poverty Centre of the
United Nations Development Programme (UNDP), Multidimensional Poverty, 1–33. Brasilia, Brazil: UNDP.
Retrieved from http://citeseerx.ist.psu.edu/viewdoc/download?doi=10.1.1.371.3288&rep=rep1&type=pdf
Clegg, E.J. and J.P. Garlick. 1979. ‘The Ecology of Disease in Urban Societies’, Current Anthropology, 20 (4):
798–99.
Das, B. and A. Mistri. 2013. ‘Household Quality of Living in Indian States: Analysis of 2011 Census’, Environment
and Urbanization, 4 (1): 151–71.
Das, B. and D. Nipun. 2012. ‘Urbanscape: Basic Amenities across Size Class of Towns in North Eastern India’,
Urban India, 32 (1): 155–73. Retrieved from http://www.researchgate.net/publication/259442965_Urbanscape_
Access_to_Basic_Amenities_Across_Towns_In_North_Eastern_India (accessed on 10 March 2016).
Planning Commission. 2008. Eleventh Five-Year Plan (Vol. II: Social Sector). New Delhi: Oxford University Press.
Retrieved from http://planningcommission.nic.in/plans/planrel/fiveyr/11th/11_v2/11th_vol2.pdf (accessed on
10 March 2016).
Gammage, S. 2006. A Menu of Options for Inter-household Poverty Assessment. United States Agency for
International Development, United States Government. Retrieved from http://pdf.usaid.gov/pdf_docs/
PNADH568.pdf (accessed on 10 March 2016).
Giri, P. 1998. ‘Urbanization in West Bengal, 1951–1991’, Economic and Political Weekly, 33 (47–48): 3033–38.
Ghosh, B. and P. De. 1998. ‘Role of Infrastructure in Regional Development: A Study over the Plan Period’,
Economic and Political Weekly, 33 (47–48): 3039–48.
Guin, D. 2014. ‘Emergence of New Towns and their Nature: A Multidimensional Study of the New Census Towns of
West Bengal, 2011’. Unpublished MPhil dissertation submitted to Jawaharlal Nehru University, New Delhi.
Guin, D. and D.N. Das. 2015. ‘New Census Towns in West Bengal–Census Activism or Sectoral Diversification?’
Economic and Political Weekly, 40 (14): 68–72.
Khasnabis, R. 2008. ‘The Economy of West Bengal’, Economic and Political Weekly, 43 (52): 103–15.
Kundu, A., S. Bagchi and D. Kundu. 1999. ‘Regional Distribution of Infrastructure and Basic Amenities in
Urban India: Issues concerning Empowerment of Local Bodies’, Economic and Political Weekly, 34 (28):
1893–906.
Kundu, A. 1984. Measurement of Urban Processes: A Study in Regionalization. Mumbai: Popular Prakashan.
———. 2004. ICT and Human Development: Towards Building a Composite Index for Asia: Realising the Millennium
Development Goals, Vi–29. United Nations Development Programme (UNDP). New Delhi: Elsevier.
Ministry of Drinking Water and Sanitation, GOI. 2012. Guidelines Nirmal Bharat Abhyan. Retrieved from www.mdws.
gov.in/sites/upload_files/ddws/files/pdf/Final%20Guidelines%20(English).pdf (accessed on 18 April 2016).
Nam, Y., J. Huang and M. Sherraden. 2008. Assets, Poverty and Public Policy: Challenges in Defining and
Measurement (A report in the series Poor finances: Assets low-income households). Saint Louis, Washington:
Centre for Social Development, Washington University. Retrieved from http://aspe.hhs.gov/hsp/07/poorfinances/definitions/report.pdf (accessed on 10 March 2016).
Prodhan, G. 2013a. ‘Status of Infrastructure Development in Cities and Towns of Odisha–Problems and Constraints’.
In Contemporary Urbanization in India: Issues and Challenges, edited by A. Banerjee, 147–65. New Delhi:
Concept Publication.
Prodhan, K. C. 2013b. ‘Unacknowledged Urbanization—New Census towns of India’, Economic and Political
Weekly, 48 (36): 43–51.
Samanta, G. 2012. In Between Rural and Urban: Challenges for Governance on Non-recognized Urban Territories
in West Bengal. In West Bengal: Geo-spatial Issues, edited by Jana et al., 44–57. Burdwan, West Bengal:
University of Burdwan.
Downloaded from joi.sagepub.com at JAWAHARLAL NEHRU UNIVERSITY on July 1, 2016
84
Journal of Infrastructure Development 8(1)
Sarkar, A. 2006. ‘Political Economy of West Bengal: A Puzzle and a Hypothesis’, Economic and Political Weekly,
49 (28): 341–48.
———. 2011. ‘Urbanization and City Size Distribution of West Bengal, India 1901–2001’, Indian Journal of
Regional Science, 43 (1): 9–16.
Serrat, O. 2008. The Sustainable Livelihood Approach, Knowledge Salutation. Asian Development Bank. Retrieved
from http://www.adb.org/sites/default/files/publication/27638/sustainable-livelihoods-approach.pdf (accessed
on 10 March 2016).
Shaw, A. 2007. Basic Amenities in Urban India: Analysis at State and Town Level. Kolkata: Indian Institute of
Management.
Snow, J. 1854. Mapping the 1854 London Cholera Outbreak. Retrieved from https://www.udel.edu/johnmack/
frec682/cholera/ (accessed on 25 January 2016).
United Nations Development Programme (UNDP). 2005. Sanitation and Cleanliness for a Healthy Environment.
Hesperian Foundation, Berkeley, California. Retrieved from http://www.unwater.org/downloads/EHB_
Sanitation_EN_lowres.pdf (accessed on 25 January 2016).
Downloaded from joi.sagepub.com at JAWAHARLAL NEHRU UNIVERSITY on July 1, 2016
Keep reading this paper — and 50 million others — with a free Academia account
Used by leading Academics

Kaan Ağartan
Framingham State University

Carlos Manuel Faísca
University of Coimbra

Shabib H . Syed
University of the Punjab, Lahore, Pakistan

Tony Waters
Leuphana University