Quaternary Science Reviews 29 (2010) 3399e3414
Contents lists available at ScienceDirect
Quaternary Science Reviews
journal homepage: www.elsevier.com/locate/quascirev
Late Quaternary glaciation history of northernmost Greenland e Evidence
of shelf-based ice
Nicolaj K. Larsen a, b, *, Kurt H. Kjær c, Svend Funder c, Per Möller a, Jaap J.M. van der Meer d,
Anders Schomacker e, f, Henriette Linge g, Dennis A. Darby h
a
Department of Earth and Ecosystem Sciences, Lund University, Sölvegatan 12, S-223 62 Lund, Sweden
Department of Earth Sciences, University of Aarhus, C.F. Møllers Allé 4, DK-8000 Aarhus, Denmark
Centre for Geogenetics, Natural History Museum of Denmark, Øster Voldgade 5-7, DK-1350 Copenhagen, Denmark
d
Department of Geography, Queen Mary University of London, Mile End Road, London E1 4NS, UK
e
University of Iceland, Institute of Earth Sciences, Askja, Sturlugata 7, IS-101 Reykjavík, Iceland
f
Norwegian University of Science and Technology, Department of Geology, Sem Sælands Veg 1, N-7491 Trondheim, Norway
g
Department of Earth Science and Bjerknes Centre for Climate Research, University of Bergen, Allégaten 41, NO-5007 Bergen, Norway
h
Department of Ocean, Earth and Atmospheric Sciences, Old Dominion University, Norfolk, USA
b
c
a r t i c l e i n f o
a b s t r a c t
Article history:
Received 13 December 2009
Received in revised form
16 July 2010
Accepted 30 July 2010
We present the mapping of glacial landforms and sediments from northernmost Greenland bordering
100 km of the Arctic Ocean coast. One of the most important discoveries is that glacial landforms,
sediments, including till fabric measurements, striae and stoss-lee boulders suggest eastward ice-flow
along the coastal plain. Volcanic erratic boulders document ice-transport from 80 to 100 km west of the
study area. We argue that these findings are best explained by local outlet glaciers from the Greenland
Ice Sheet and local ice caps that merged to form a shelf-based ice in the Arctic Ocean and possibly
confirming an extensive ice shelf in the Lincoln Sea between Greenland and Ellesmere Island. It is
speculated that the shelf-based ice was largely affected by the presence of thick multiyear sea ice in the
Arctic Ocean that prevented it from breaking up and forced the outlet glaciers to flow eastwards. During
the initial retreat the coastal area was dammed by the shelf-based ice and kame and glaciolacustrine
sediments were deposited up to 50 m above the marine limit before the final deglaciation and marine
transgression. The timing of the shelf-based ice is constrained on land by dating glaciolacustrine sediments with OSL and marine molluscs with radiocarbon and by re-evaluating IRD events in cores from the
Fram Strait. Results show that the shelf-based ice started to build-up as early as 30 cal ka BP and reached
a maximum during the Last Glacial Maximum (LGM). The shelf-based ice began to retreat ca 16 ka to
10.3 cal ka BP before the final break-up, which took place ca 10.1 cal ka BP probably as a combined result
of increased inflow of warm Atlantic water through the Fram Strait, a shallower halocline and higher
summer temperatures, corresponding to orbital maximum solar insolation at this time. The existence of
extensive shelf-based ice north of Greenland provides an important contribution to the understanding of
the LGM glaciation history of the Arctic Ocean.
Ó 2010 Elsevier Ltd. All rights reserved.
1. Introduction
From the distribution of glacial erratics along the coast, Koch
(1923, 1928) concluded that the Greenland Ice Sheet did not
reach the north coast, which instead was overrun by outlet glaciers
from the “North Cap”, a local ice cap that developed over the coastal
mountains. This view has been supported by later fieldwork, as
* Corresponding author. Department of Earth Sciences, University of Aarhus,
C.F. Møllers Allé 4, DK-8000 Aarhus, Denmark. Tel.: þ45 89422565.
E-mail address: nkl@geo.au.dk (N.K. Larsen).
0277-3791/$ e see front matter Ó 2010 Elsevier Ltd. All rights reserved.
doi:10.1016/j.quascirev.2010.07.027
reviewed by Dawes (1986) and Funder (1989). To the south and
west of the coastal mountains, the North Cap ice merged with the
Greenland Ice Sheet (Bennike, 1987; Landvik et al., 2001). On the
north coast, it was originally envisaged that piedmont glaciers
emanating from the local North Cap terminated either on the
coastal plain (Koch, 1923) or on the inner shelf where some of the
northernmost islands (Kaffeklubben Ø, Oodaaq Ø) were interpreted
as marginal moraines formed by adjacent valley glaciers (Davies,
1963). In contrast, Funder and Larsen (1982) suggested that the
outlet glaciers from the North Cap, were deflected eastward by an
ice stream from the Greenland Ice Sheet. This was based on coastparallel ice directional glacial landforms and on the occurrence of
�3400
N.K. Larsen et al. / Quaternary Science Reviews 29 (2010) 3399e3414
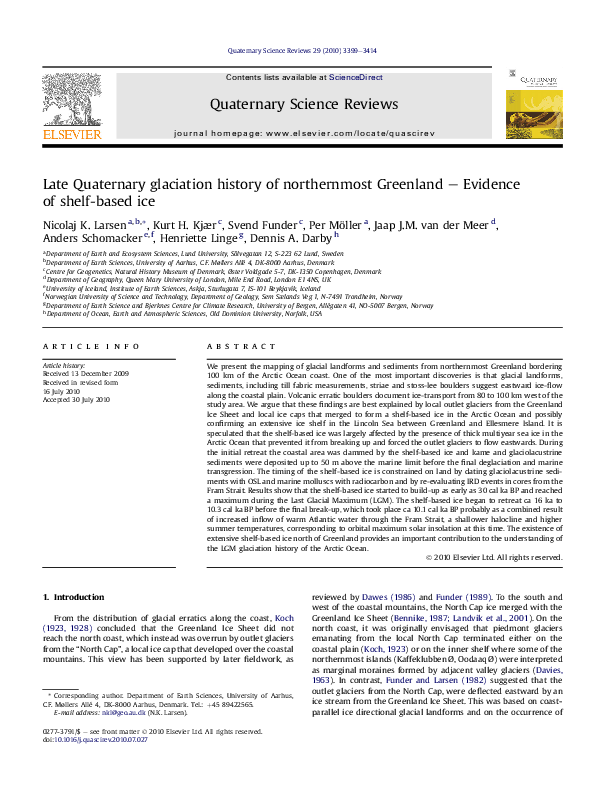
Fig. 1. Overview map of North Greenland with LGM ice reconstructions according to Dawes (1986).
glacial erratics with a likely source at Kap Washington 80e100 km
to the west. Dawes (1986) added new observations on far-travelled
erratics on the north coast, and suggested that the deflection of the
glaciers on the coastal plain was caused by an ice shelf which
extended farther out in the ocean along the northern coasts of both
Ellesmere Island and Greenland (Fig. 1). The erratics indicate that
the eastern part of the ice shelf must have been fed from ice sheet
outlets in fjords to the west, and especially from Nares Strait where
the Innuitian Ice Sheet over the Canadian Arctic Archipelago and
the Greenland Ice Sheet joined. However, fieldwork in this region
first seemed to negate the existence of a large feeder ice stream in
this trough during the LGM, and the idea of the ice shelf was
revoked (Funder and Hansen, 1996). But later results from the
Canadian side of both the southern and northern end of Nares Strait
(Funder, 1989; Blake, 1999; England, 1999) imply that rather thick
ice streams did move both north and south through this trough at
the LGM. This was supported by the high isostatic uplift, and hence
the ice shelf reappeared on the LGM reconstruction of the
Greenland Ice Sheet (Funder et al., 2004).
We spent two summers on the northern Greenland coast, principally to (i) investigate and date raised marine sediments and drift-
wood to reconstruct the Holocene sea ice variability (Funder et al.,
submitted), (ii) map glacial and glaciolacustrine deposits in valleys
and on the coastal plain to determine Holocene valley glaciations
(Möller et al., in this volume) and, (iii) to investigate the last glaciation
and deglaciation history recorded on the coastal plain and the
evidence of a possible extensive ice shelf in the Lincoln Sea between
Ellesmere Island and North Greenland e the specific topic of this paper.
2. The north coast of Greenland
The field area extends from Kap Morris Jesup in the west to Kap
Ole Chiewitz in the east, encompassing the coastal plain (w100 km
long and w5e10 km wide) that separate interior, up to 2000 m
high, ice covered mountains from the Arctic Ocean (Figs. 1 and 2)
The glaciation limit on the coastal fringe facing the Arctic Ocean is
w200 m a.s.l. but rises to 800e1000 m a.s.l. in interior Peary Land,
from which outlet glaciers descend from local ice caps towards the
coastal plain and the ocean (Koch, 1928; Weidick, 2001). The coastal
plain is covered mostly by a mosaic of Quaternary sediments;
however, thicker deposits occupy valley mouths where rivers reach
the Arctic Ocean (Fig. 2). The mean annual temperature at Kap
�N.K. Larsen et al. / Quaternary Science Reviews 29 (2010) 3399e3414
Fig. 2. Geomorphological map of the north coast of Johannes V. Jensen Land with outcrops and sample localities. Numbers 1e34 refer to localities mentioned in the text, figures or tables.
3401
�3402
N.K. Larsen et al. / Quaternary Science Reviews 29 (2010) 3399e3414
Table 1
Radiocarbon dates from North Greenland 0: this study, 1: Möller et al. (in this volume), 2: Funder et al., (submitted).
Site
Kaffeklubben
Kaffeklubben
Kaffeklubben
Kaffeklubben
N lat.
Elv
Elv
Elv
Elv
Constable Bugt
0705
Kap Ole Chiewitz
Kap James Hill
4
1
1
1
W long.
m a.s.l.
83.62248
83.62667
83.62197
83.62205
30.55827
30.51728
30.51458
30.51335
12
8
6
8
83.58128
32.21093
106.8
83.43093
83.65603
25.97575
31.00147
12
23
Sample
No.
Lab.
No.
Sediment
Material
Coventional
age, yr BP
Cal. Age,
yr BP
KKE
KKE
KKE
KKE
LuS7053
LuS7052
LuS7054
LuS7060
Marine
Marine
Marine
Marine
9125
7055
6795
6495
9569.5
7433
7136.5
7398.5
CB 0705:1
LuS7469
Glaciolacustrine
07042
07010
AAR11908
AAR11919
Marine
Marine
shell
Hiatella arctica
Mya truncata
Terrestrial plant
detritus
Terrestrial plant
detritus
Hiatella arctica
Hiatella arctica
4:1
1a
1b
1c
Morris Jesup is c. 18 � C and the coastal plain lies in the zone of
continuous permafrost. Precipitation in Peary Land is only around
50 mm/year (Davies and Krinsley, 1963). Patterned ground,
including tundra polygons, are widespread and the bedrock
composed of quartz-phyllite is heavily frost shattered. Furthermore, deflation surfaces with ventifacts are common, produced by
prevailing winds from the west and northwest.
3. Methods
Stereoscopic mapping of landforms and sediments, Digital
Elevation Model (DEM) extraction and orthophoto generation was
done on a digital photogrammetric workstation using aerial
imagery from 1960e61 (1:50,000) and 1978 (1:150,000). Control of
the imagery was obtained by transferring the absolute reference
through time homologous tie points from the younger (1978),
aerotriangulated imagery with datum GR96 (WGS84). A series of
panoramic scenes were produced where the 1978 ortho-imagery is
draped over a digital elevation model extracted from the aerial
imagery, acquired by the National Cadastre and Survey (KMS). The
DEM has been created using a modification of the original KMS
aero-triangulation of the imagery, with emphasis on calibrating sea
level. A geomorphological map was produced by manual mapping
and classification of the landforms taking advantage of the
92
120
131
106
0
0
0
0
9135 � 120
10300 � 125
1
9593 � 48
9560 � 55
10124 � 162
10087 � 164
2
2
�
�
�
�
50
50
50
50
Reference
�
�
�
�
geometric and radiometric resolution of the aerial photographs.
The resulting map was then tested by ground-thruthing in the field.
Field surveys were conducted from small camps utilizing Twin
Otter fixed-wing aircraft, helicopter and ATV’s. Emphasis was
placed on stratigraphic analysis and dating of the most complete
Quaternary sections. Outcrops were logged using the facies codes of
Krüger and Kjær (1999) commonly at a vertical scale of 1:10. Clast
fabric measurements in diamicts were made by measuring the dip
and dip direction of 25 clasts with long a-axis between 0.5 and
10 cm and an a/b ratio >1.5 in a 20 cm � 30 cm area (Larsen and
Piotrowski, 2003). Fabric data are presented as points and twosigma Kamb contours on an equal-area, lower-hemisphere Schmidt
net. Intact sediment samples were taken in steel mammoth and
Kubiena tins and prepared for thin section analysis as described by
van der Meer (1993). The elevation of sample sites and marine limit
were measured by handheld GPS with build-in altimeter or a digital
altimeter. The accuracy of measurements is �1 m after correcting
for daily atmospheric pressure changes. In addition, elevations
measured in the field were verified using the DEM which has
a vertical RMS of �3 m at 90% confidence level.
Radiocarbon dates mentioned in this paper are listed in Table 1.
Lists of all available 14C-dates from the area are supplied by Funder
et al. (submitted). Samples obtained during our fieldwork were age
dated at the AMS radiocarbon laboratories in Lund (LuS) and Aarhus
Fig. 3. Sedimentary logs documenting the glacial (A), kame and glaciolacustrine deposits (B) from Henson Bugt to Kap Ole Chiewitz. The two units in CB 8 and CB 9 with no
designated number are Holocene glaciolacustrine and glacial deposits identified in Sifs Valley (see Möller et al., in this volume).
�N.K. Larsen et al. / Quaternary Science Reviews 29 (2010) 3399e3414
3403
Fig. 4. (a) Overview of the glacial landscape around Kap James Hill (orthophotograph draped on an elevation model). A till plain (triangles) is present in the central parts above
the marine limit (white stippled line). Two outcrops (JH 0706 and JH 0711) show thick successions of basal till, usually massive (b) but also stratified (c). Below the marine limit are
marine sediments (blue dots), at one locality (JH 0707) overlying glaciolacustrine deposits. The red dots represent glaciofluvial outwash fan sediments with a large dead-ice
depression in the central part (brown). The sedimentary logs from the outcrops are shown in Figs. 3 and 8. (For interpretation of the references to colour in this figure legend, the
reader is referred to the web version of this article).
(AAR). All marine samples were calibrated into calendar years using
the terrestrial and marine calibration curves of Reimer et al., (2004)
and Hughen et al., (2004) after subtracting a reservoir age of 550
years (DR ¼ 150; Funder, 1982; Mörner and Funder, 1990). We note
that the marine reservoir effect estimated from North Greenland is
slightly lower than what has been estimated from Arctic Canada near
carbonate outcrops that add additional dead C to the seawater
(DR ¼ 335; Dyke, 2004a,b).
Sediments for optically stimulated luminescence dating (OSL)
were sampled in plastic tubes in sections a least 30 cm from distinct
sediment boundaries. Age determinations were carried out at the
Nordic Laboratory for Luminescence Dating at Risø (Denmark)
using standard techniques including correction for specific water
saturation and burial depth (Murray et al., 1987; Olley et al., 1996;
Murray and Wintle, 2000). Incomplete bleaching by light is
a potential problem for specific types of depositional environments
such as ice-dammed lakes, where exposure to direct daylight is
often insufficient to reset the OSL signal (Murray and Olley, 2002).
In such cases there will be an age overestimation as the remnant
dose is superposed on the dose acquired after burial. However, by
dating several samples from the same stratigraphic unit, possible
outliers caused by incomplete bleaching can often be identified
(Larsen et al., 2006).
4. Results
The north coast of Peary Land has experienced a complex
history of both regional and local glacial advances as well as
episodes of marine transgression. Based on several proxies
including geomorphology, lithostratigraphy and faunal investigations combined with a firm chronology (14C and OSL dating) four
depositional environments have been identified: A) glacial
deposits, B) glaciolacustrine deposits, C) marine limit and deposits
and D) glaciofluvial deposits. Our studies focus on the coastal plain
and to a lesser degree on the northesouth oriented valleys which
are often occupied by local outlet glaciers and only record evidence
of Holocene valley glaciations. One exception is Sifs Valley where
dislodged glaciolacustrine and marine sediments have been
observed (Möller et al., in this volume).
4.1. Glacial deposits (A)
On the coastal plain, glacial landforms and deposits are indistinct and often overprinted by younger glacial events and periglacial activity. However, in a few places above the marine limit
(w45 m a.s.l.) and outside the large moraines that mark the
maximum extent of local Holocene glacier advances (Möller et al.,
�3404
N.K. Larsen et al. / Quaternary Science Reviews 29 (2010) 3399e3414
in this volume), glacial sediments and landforms have been identified (Figs. 2 and 3). From Kap Morris Jesup to Henson Bugt no
significant traces of pre-Holocene glacial landforms or sediments
were found on the 4e10 km wide coastal plain (Fig. 2). Here beach
ridges, a thin cover of marine sediments or fluvial and deltaic
sediments drape the frost shattered bedrock. On the eastern side of
Henson Bugt towards Constable Bugt, the dominant landscape is
a till plain and at higher elevation dead-ice topography dissected by
meltwater streams. Despite intense slumping and solifluction a few
outcrops reveal successions of grey, clast-rich and compact diamict.
Well exposed outcrops are located around Constable Bugt and Kap
James Hill on the large till plain (Fig. 4a) composed of 2e6 m thick
clast-rich grey diamict (Fig. 4b). Many clasts are stoss/lee-shaped
and heavily striated, and amongst them far-travelled erratics like
reddish granites have been identified. The diamict is mainly
massive and fissile although it may be stratified, consisting of
alternating layers of diamict and sand (Fig. 4c). Six fabric analyses
show strong preferred eastewest orientation except at one site at
the outer coast where the clasts were aligned northwestesoutheast
(Fig. 3). Overlying this diamict we encountered younger glaciolacustrine, marine or glacial sediment, especially near Sifs Valley
(Möller et al., in this volume). Associated with the diamict or lying
directly on local bedrock are volcanic and pink granitic erratic
boulders (Fig. 5a), particularly below the highest shoreline and
mainly near Kaffeklubben Ø. Farther to the east in the Bliss Bugt
area large stoss-lee boulders, often with a long axis of more than
2 m (Figs. 3 and 5b) are scattered on the discontinuous thin cover of
diamict. Considering the low relief, flat terrain and boulder size, it is
assumed that they are still in their original position. Striation
measurements on these large boulders show a strong eastewest
alignment (n ¼ 64), as are their long axes (Fig. 5c). In front and
superimposed by the large end moraine at Moore Glacier in Bliss
Bugt are two, ca 5 km long, single crested ridges that are
ESEeWNW orientated (Fig. 2). On the coast from Bliss Bugt to Kap
Ole Chiewitz a conspicuous set of coast-parallel landforms several
kilometres long and a few metres high were identified on aerial
photographs (Fig. 5d). In the field it was realized that these landforms, especially in Bliss Bugt area, were structural lineaments in
the local bedrock, except at Kap Ole Chiewitz where these landforms are composed of or covered by a thin layer of diamict.
4.2. Glaciolacustrine deposits (B)
Kame and glaciolacustrine sediments have been identified above
the highest marine limit (40e45 m a.s.l.) in a few places along the
coastal plain (Fig. 2). One of them is at Henson Bugt (Fig. 6a) where
glaciolacustrine sediment lies as an erosional remnant at 110 m a.s.l.
at the foot of the mountain (Fig. 6b and c). The glaciolacustrine
succession is dominantly composed of laminated silt with frequent
dropstones, interbedded with gravel and sand stringers and scours
(Figs. 3 and 6d). Convolute bedding is common in the lower part of
the sequence and the entire succession is cut by a number of normal
faults. Glaciolacustrine sediments were also documented in Sifs
Valley farther to the east and at much lower elevations (up to 40 m
a.s.l.). They are glacially overridden and to a large extent incorporated into the Constable Bugt moraine during an early Holocene
valley glacier advance (Möller et al., in this volume).
At Kap James Hill (Fig. 2) there is a large area completely covered
with thick successions of glaciolacustrine sediments (Fig. 7a). The
sequence sits in an onlapping position on the coastal plain but ends
with a steep, up to 10 m high scarp towards the Arctic Ocean. North
of the scarp we have not observed more glaciolacustrine deposits.
The complex has been extensively modified by postglacial fluvial
erosion (Fig. 7b and c), which allows good access to the sediments.
Gullies cutting through the sediments reveal finely laminated,
occasionally graded, silt and fine sand beds (Fig. 7d) with dropstones (Fig. 7e) and iceberg dumps. At one site the glaciolacustrine
sediments are overlain by a thin layer of marine sediments with
Fig. 5. a) Pink granitic erratic boulder. b) Patchy till plain with scattered boulders and frost shattered bedrock in the Bliss Bugt area. c) Eastewest orientated striations on a large
boulder in Bliss Bugt. d) Large lineations in bedrock, overlain by scattered erratic boulders (orange dots). (For interpretation of the references to colour in this figure legend, the
reader is referred to the web version of this article).
�N.K. Larsen et al. / Quaternary Science Reviews 29 (2010) 3399e3414
3405
Fig. 6. Overview of the area from Henson Bugt to Constable Bugt. Between the valleys is a dead-ice landscape (triangles) at higher elevation above the coastal plain. To the west
(right) is a relative thin cover of marine sediment (blue dots) on top of bedrock and near the coast there are up to 10 km long beach ridges (blue dotted lines). The Henson and
Constable Bugt moraines are indicated by red hatched lines. b) Glaciolacustrine sediments 110 m a.s.l. in Henson Bugt. c) Glaciolacustrine sediments at 110 m a.s.l. in Henson Bugt
(site 2 in (a)), clinging to the mountain slope as an erosional remnant. Note man for scale. d) Close-up of fine grained laminated glaciolacustrine sediments with dropstones.
(For interpretation of the references to colour in this figure legend, the reader is referred to the web version of this article).
molluscs (Fig. 8). Thin section analysis of the glaciolacustrine
sediments shows distinct and abrupt boundaries and in places
much finer laminations (Fig. 9a). Grading is present, but nongraded laminae make up the bulk of the sediments. Evidence of
bioturbation is sparse, but can be pervasive in some strata (Fig. 9b
and c), though not noticed macroscopically. No fossils have been
observed and thus the organisms responsible for the bioturbation
are unknown. Most likely, however, they must have been scavengers as the samples regularly contain tiny, but clearly recognizable
slivers of moss-like plant material.
West of Bliss Bugt and at Kap Ole Chiewitz, kames were
observed close to the highest shoreline (51 m a.s.l.), continuing as
small remnants of such up to w100 m a.s.l. No recordable sections
were available. Thus, samples for OSL dating were taken from
shallow pits excavated down to the permafrost table (Table 2).
4.3. The marine limit and marine deposits (C)
The ice retreat on the coastal plain was followed by marine
transgression up to the marine limit. This is recorded in sand- and
gravel-delta terraces at the valley mouths on the inner plain. The
distal delta terrace margin, which reflects sea level at the time of
the delta and marine limit formation, is 40e45 m a.s.l. along the
entire stretch of coastline. Wherever exposed the delta terraces are
�3406
N.K. Larsen et al. / Quaternary Science Reviews 29 (2010) 3399e3414
Fig. 7. a) Overview of Kap James Hill, composed of thick successions of glaciolacustrine sediments. b, c) The sediments are draped by a lag of cobbles and boulders and cut by
numerous fluvial gullies. d) Close-up of the laminated and graded sediments with dropstones, some of which have glacial abrasion marks.
of Gilbert-type and composed of ca 5 m high foresets. 14C dating of
in situ mollusc shells from prodeltaic silt date the end of terrace
construction and e assuming that the terraces were built rapidly e
the time of deglaciation of the coastal plain. Both at Constable Bugt
in the west and at Kap Ole Chiewitz in the east this occurred at c.
10.1 cal ka BP (Table 1). A peculiar landscape on the coastal plain is
the occurrence of extensive, barren areas of marine mud with a thin
deflation armour of pebbles and boulders at the surface. These are
especially conspicuous between Kap James Hill and Bliss Bugt,
where raised beaches and signs of wave action are absent. Funder
et al. (submitted) suggest that the coast in these areas has been
permanently beleaguered by sea ice since deglaciation. Only in
embayments with a large inflow of meltwater did sizeable leads
arise, allowing wave action and beach formation. In outcrops the
marine sediments are uniformly fine grained with only few and
diffuse traces of lamination, while the top is reworked by frost
action (Fig. 10). In thin sections the marine sediments show diffuse,
usually disrupted lamination with very rare grading (Fig. 9d). As in
the glaciolacustrine sediments the thin sections of marine deposits
show tiny slivers of organic material similar to moss (Fig. 9e). Only
one of the samples showed bioturbation similar to, but much less
dense, than that sporadically found in the lacustrine deposits
(Fig. 9f).
4.4. Glaciofluvial deposits (D)
A sandur on both sides of Kaffeklubben River covers a w2 km2
large area (Figs. 2 and 11a) with a flat main plain at an altitude of
w54 m a.s.l. (i.e. above the marine limit). The deposits drape
underlying bedrock and/or till with a thickness of 5e25 m, as
shown in sections along the present river bed of the Kaffeklubben
River (Fig. 11b). The sandur sediments consist of a stacked sequence
of clast-supported cobble gravel as the main constituent, interbedded with thin beds of massive to planar parallel-laminated sand
and thinner beds of clast-supported open work gravels (Fig. 11d).
The fluvial feeder system for the constructional part of the sandur is
a series of presently dry channels, cut down into till and bedrock
and having hanging entrances along the current river valley. Some
channels widen in their distal end and merge with the main
braidplain, whereas other channels widen and emerge on
�N.K. Larsen et al. / Quaternary Science Reviews 29 (2010) 3399e3414
Fig. 8. Sedimentary logs of glaciolacustrine (B) and marine sediments (C) at Kap James Hill, Kaffeklubben River (KKR) and Bliss Bugt west.
3407
�3408
N.K. Larsen et al. / Quaternary Science Reviews 29 (2010) 3399e3414
Fig. 9. Thin section of glaciolacustrine (aec) and marine (def) sediments. a) The lamination and grading is very distinct in the lacustrine sediments and contain abundant evidence
of bioturbation (b, c). d) The marine sediments are massive or diffusively laminated and contain organic (moss) detritus (e). f) Some intervals have been bioturbated but not as
intensely as the glaciolacustrine sediments. All images taken in plain light; horizontal field of view is 13.2 mm except for d (9.4 mm) and e (2.6 mm).
a hanging terrace w2 m above the main braidplain (Fig. 11a). In
distal direction (towards the north), the flat upper surface becomes
undulating, forming hummocks and short ridges, intercalated with
open and closed, 2e5 m deep depressions (Fig. 11c).
4.5. Chronology
The age of the glacial phase has mainly been constrained by
dating the glaciolacustrine and marine sediments with OSL and by
radiocarbon dating of mollusc shells from the marine sediments. A
lower age estimate of the glacial phase is very poorly determined as
we have been unable to find any sediment below the till. Old-finite
14
C ages (i.e. ages between 20,000 and 40,000 years) have been
shown to be mixtures of non-finite and Holocene, or probably due
to contamination (Funder, 1982; Funder et al., submitted), and are
therefore omitted from this paper. However, they do show that
older marine sediments have been widespread in the area.
The glaciolacustrine sediments have been dated with OSL and
reveal ages with a large spread between 135e12.4 ka, with a cluster
around 20 ka (Fig. 12). In addition, there is one radiocarbon date
from Sifs Valley giving an age of 10.3 cal ka BP (Möller et al., in this
volume). Some retrieved OSL ages are significantly older than
others within the same stratigraphic unit and age reversals are
common (Fig. 3). We expect that the “old” population of dates are
erroneous because of incomplete bleaching in the turbid muddy
water, a dating problem often encountered in ice-proximal sediments (Fuchs and Owen, 2008; Alexanderson and Murray, in press).
We only regard the younger ages as reliable and propose that the
glaciolacustrine sediments were deposited between ca 16 ka to
10.3 cal ka BP. The deglacial age of the coastal plain is also indicated
from two exposure ages of boulders (12 and 16.5 ka) above the
marine limit on the coastal plain outside Sifs Valley (Möller et al., in
this volume). The termination of the glacial and glaciolacustrine
phases is furthermore constrained by radiocarbon dates of molluscs
from marine sediments and of drift-wood. The oldest radiocarbon
age of a marine mollusc is 10.1 cal ka BP providing a minimum age
of the marine transgression as there is a time lag for a fauna to
establish (Fig. 12). Marine sediments have also been dated with OSL
and they are all a few to several thousand years older than what is
expected based on the radiocarbon chronology (e.g. KKR 5, Fig. 8).
Apparently also the marine sediments have not been sufficiently
bleached before final deposition and the group of “old” ages is
probably recording a previous bleaching event. The most likely
source of the marine deposits is the fine grained sediment in Sifs
Valley deposited during the retreat phase. The OSL ages of these
source sediments fall within the same interval as the OSL ages of
the marine sediments. It is, therefore, likely that the OSL signal from
the marine sediments actually records the time of deposition of
glaciolacustrine sediments in Sifs Valley. Associated with the
marine transgression is the formation of the large sandur around
Kaffeklubben River, terminating close to the marine limit. These
sediments gave OSL ages ranging from 24.8 to 5.1 ka with intermediate ages of 12.1 and 13.5 ka (Fig. 12). The 5.1 ka age is most
likely too young and this might be related to the sampling location
close to a lithological boundary. The intermediate OSL ages are
slightly older than expected from radiocarbon dates of marine
molluscs (10.1 cal ka BP) and are probably related to incomplete
bleaching.
In summary, the chronological data from this study suggest that
there was a glacial phase during LGM along the north coast of
Greenland that was followed by or contemporaneous with the
deposition of glaciolacustrine sediments from ca 16 ka to 10.3 cal ka
BP, before the coastal plain was inundated around 10.1 cal ka BP.
5. Interpretation and discussion
5.1. The glacial phase
The massive diamict on the coastal plain with abraded and
striated clasts, fissile structure and high fabric strength is interpreted as a basal till deposited beneath a warm-based glacier with
strong interaction between the ice and substratum (Larsen et al.,
2004; Evans et al., 2006). Directional elements such as till fabric,
striae, the shape of boulders and their axial orientation, together
with volcanic erratics originating from Kap Washington,
80e100 km west of the study area, all indicate an eastward ice-flow
direction. Eastward ice-flow is also supported by the geographic
distribution of glacial deposits and landforms outside and to the
�Table 2
OSL dates from North Greenland. 0: this study, 1: Möller et al. (in this volume).
Map No.
N lat.
Bliss Bugt W
Bliss Bugt W 0702
Bliss Bugt W 0704
Kaffeklubben River
Kaffeklubben River
Kaffeklubben River
Kaffeklubben River
Kaffeklubben River
Kaffeklubben River
Kaffeklubben River
Kaffeklubben River
Kaffeklubben River
Bliss Bugt W
Constable Bugt
Constable Bugt
Constable Bugt
Constable Bugt
Constable Bugt
Constable Bugt
Constable Bugt
Henson Bugt
James Hill
James Hill
James Hill 0707
James Hill 0707
Kap Ole Chiewitz
Kap Ole Chiewitz
Kap Ole Chiewitz
8
6
7
18
19
15
16
10
10
10
17
17
5
33
32
31
30
27
28
26
34
24
25
20
20
3
1
2
83.56457
83.55472
83.55750
83.61950
83.62156
83.62082
83.62011
83.61116
83.61116
83.61116
83.61024
83.61024
83.54607
83.58128
83.58128
83.55883
83.56742
83.57818
83.69077
83.58848
83.60843
83.64306
83.63834
83.64250
83.64194
83.41817
83.40182
83.41517
2
3
5
5
5
8
8
W long.
29.97395
29.88028
29.89917
30.80018
30.79866
30.58512
30.60233
30.56297
30.56297
30.56297
30.70187
30.70187
29.76568
32.21093
32.21093
32.00837
32.02294
31.92252
31.94940
31.99593
32.75962
31.40361
31.46299
31.02639
30.95528
25.81592
25.67002
25.77934
Sample No.
Lab No.
Sediment
m a.s.l.
n
w.c.
Equivalent dose (Gy)
Dose Rate (Gy/ka)
OSL age (ka)
Reference
07e038
070801e03
070730e01
06809
06810
06805
06806
06807
06808
06819
06811
06812
07e004
CB 0705:2
CB 0705:3
CB 2:1
CB 3:1
CB 6:1
CB 7:1
CB 9:1
Hensonbugt 2:1
070806e07
070808e11
070805e05
070805e06
07e050
07e051
070813e13
080212
080217
080215
070217
070218
070213
070214
070215
070216
070221
070219
070220
080211
080203
080204
070205
070206
070222
070223
070212
080222
081056
081057
081054
081055
080213
080214
080219
Marine
Marine
Marine
Marine
Marine
Marine
Marine
Marine
Marine
Marine
Glaciofluvial
Glaciofluvial
Kame
Glaciolacustrine
Glaciolacustrine
Glaciolacustrine
Glaciolacustrine
Glaciolacustrine
Glaciolacustrine
Glaciolacustrine
Glaciolacustrine
Glaciolacustrine
Glaciolacustrine
Glaciolacustrine
Glaciolacustrine
Kame
Kame
Kame
43
17
19
40
40
16
15
32
38
30
40
36
37
106.9
108.9
14
14
1.9
22.9
18
108.4
17
20
21
23.8
51
36
33
17
29
18
24
24
20
23
29
39
44
20
52
22
13
20
21
23
25
27
26
17
15
15
15
32
41
49
32
37
52
34
22
27
18
24
30
16
45
36
41
48
46
31
28
37
21
24
33
4.15 �
4.11 �
4.17 �
2.03 �
2.64 �
4.00 �
4.53 �
4.07 �
3.77 �
4.39 �
3.66 �
2.22 �
1.67 �
3.63 �
4.01 �
3.04 �
3.96 �
4.11 �
3.85 �
4.25 �
5.07 �
3.52 �
3.05 �
3.71 �
15.2
21.3
15.6
13.5
12.1
15.8
10.8
15.2
13.6
9.4
5.1
24.8
31
29
45
19.4
39.8
14.2
12.4
50
20
23.4
33.5
26.7
17
16
24
17
14
28
63.0 � 1.8
88 � 4
65 � 2
27 � 3
32 � 2
63 � 3
49 � 2
62 � 2
51 � 3
41 � 2
18.5 � 1.2
55 � 2
52 � 3
106 � 17
181 � 16
60 � 1
159 � 17
59 � 3
48 � 1
212 � 16
103 � 12
82.61 � 3.04
102.21 � 3.40
99.26 � 3.56
no signal
278 � 15
39 � 3
60 � 4
0
0
0
0
0
0
0
0
0
0
0
0
0
1
1
1
1
1
1
1
0
0
0
0
0
0
0
0
0.15
0.14
0.13
0.07
0.09
0.13
0.16
0.15
0.14
0.17
0.14
0.09
0.07
0.12
0.14
0.11
0.13
0.13
0.14
0.16
0.21
0.17
0.14
0.16
2.06 � 0.08
1.85 � 0.08
3.07 � 0.12
� 0.8
� 1.3
� 0.7
� 1.6
� 0.9
� 0.9
� 0.7
� 0.9
� 1.1
� 0.6
� 0.4
� 1.4
�2
�5
�4
� 0.8
� 4.6
� 0.8
� 0.6
�4
�2
� 1.5
�2
� 1.6
135 � 9
21 � 2
19.6 � 1.4
N.K. Larsen et al. / Quaternary Science Reviews 29 (2010) 3399e3414
Site
3409
�3410
N.K. Larsen et al. / Quaternary Science Reviews 29 (2010) 3399e3414
Fig. 10. Sedimentary logs from the outcrops along Kaffeklubben River, showing marine sediments (C) above glaciofluvial sediments (B) from the thinning phase.
east of valley mouths on the coastal plain such as the ESEeWNW
orientated ridges in front of Moore Glacier, which are interpreted as
eskers (Fig. 2). In theory these landforms and sediments could be
attributed to local outlet glaciers, forming piedmont lobes on the
coastal plain (cf. Davies, 1963). However, this would require that
the local outlet glaciers were deflected eastward; possibly by the
presence of thick multiyear sea ice, which has been inferred to have
existed during the LGM and during the early part of deglaciation
(Bradley and England, 2008). It would also require that the erratic
boulders were transported by sea ice to the study area and
reworked by local glaciers; as suggested by Funder and Larsen
(1982). However, the eastewest orientated till fabric and striae
just outside valley mouths are difficult to reconcile with local outlet
glaciers, but are better explained by a more regional ice-flow
pattern parallel to the coastal plain. Another fundamental problem
is the glaciolacustrine sediments (up to 100 m a.s.l.) that occasionally occur above the marine limit (45 m a.s.l.) on the coastal
plain and in the local valleys. Obviously these sediments are not
marine and require the presence of ice on or outside the coastal
plain to form a dam against the mountains when the local valleys
were partly deglaciated (see below). Accordingly, we argue that the
observations are best explained by the existence of shelf-based ice,
nourished by outlet glaciers from North Greenland that locally
would provide the dynamics needed to produce glacial landforms
and deposits on the coastal plain farther to the east.
Dawes (1986) suggested that this ice shelf occupied the entire
Lincoln Sea between Ellesmere Island and North Greenland and
was fed by glaciers all along the north coast of Greenland and
possibly by some of the major outlet glaciers draining the
Innuitian Ice Sheet on Ellesmere Island (Fig. 1). We find that idea
compelling and it also seems to comply with an ice stream
operating in the northern part of the Nares Strait during LGM as
suggested by England et al. (2006). However, more data from
especially Northwest Greenland is needed to confirm such an
extensive ice shelf in the Lincoln Sea. From North Greenland, we
find evidence of shelf-based ice on the coastal plain nourished by
outlet glaciers that might have formed an ice shelf on the outer
shelf, but this has yet to be resolved. Offshore multibeam
mapping and a sediment core on the Morris Jesup Rise a ca
200 km north of our study area (Jakobsson et al., in this volume)
show that ice was not grounded here during the LGM. Iceberg
scours have been identified on as much as 1045 m water depth
but are dated to MIS 6. However, these observations do not
exclude the existence of an ice shelf north of Greenland and in
the Lincoln Sea during the LGM, but simply show that the ice
shelf was too thin to become grounded on the deeper parts of
Morris Jesup Rise. It should also be noted that only a restricted
part of the Morris Jesup Rise was mapped and the landward and
shallower areas are unexplored and may contain evidence of ice
grounding.
�N.K. Larsen et al. / Quaternary Science Reviews 29 (2010) 3399e3414
3411
Fig. 11. a) Aerial photograph of the Kaffeklubben River sandur. Open yellow ovals: collapsed, hummocky distal part of the sandur plain. Red line demarcates the boundary between
sandur sediments and till/bedrock areas. Two till “islands” are protruding through sandur sediments distal to one of the feeder channels (yellow). b) The flat proximal part has an
elevation of w54 m a.s.l. In the foreground Kaffeklubben River cuts the 5e20 m thick sandur deposits and underlying bedrock. c) The collapsed, distal part of the sandur plain. d)
Sedimentary log from the sandur (KKR 8). (For interpretation of the references to colour in this figure legend, the reader is referred to the web version of this article).
5.2. Ice retreat and marine transgression
Both kame and glaciolacustrine sediments have been observed
above the marine limit along the coastal plain. The coarse-grained
kame sediments are often located just outside and eastward of
valley mouths and border the coastal mountains. The non-fossiliforous glaciolacustrine sediments located both above and below
the marine level at several places along the coastal plain and in Sifs
Valley suggest deposition primarily from suspension, while the
scattered dropstones record episodes of ice-rafting. Coarser
Fig. 12. OSL and radiocarbon ages. a) Glaciolacustrine and kame deposits. Grey bar ¼ inferred age. b) Marine and glaciofluvial sediments. Grey bar ¼ inferred age of marine
transgression.
�3412
N.K. Larsen et al. / Quaternary Science Reviews 29 (2010) 3399e3414
interbeds of sand and gravel are likely to reflect underflows or
sediment gravity flows from adjacent valley slope. It is possible to
distinguish the glaciolacustrine sediments, occurring below the
marine limit, from the marine sediments on the basis of differences
in the frequency of lamination, grain size, nature of boundaries (Ó
Cofaigh and Dowdeswell, 2001), and fossil content. Furthermore
the glaciolacustrine sediments are restricted in their extent,
whereas the marine deposits are much more widespread over the
coastal plain. We thus conclude that the glaciolacustrine sediments
most likely reflect temporary and disconnected embayments
between the coastal mountains, their outlet glaciers and the shelfbased ice occupying the inner shelf.
The marine sediment consists of diffusively laminated to
massive and often shell-bearing silt and clay and reflects sedimentation from suspension in a shallow glaciomarine environment. Dropstones in the marine sediments, many of which are
striated, indicate that icebergs were frequent in this area (Funder
et al., submitted). The coarsening upward succession of marine
sediments at Kaffeklubben River (Fig. 10) is interpreted to reflect
a forced regression caused by the isostatic uplift of the land, ending
in foreshore/beach face sands and gravels. Associated with the
marine limit is a sandur at Kaffeklubben River (Fig. 11) that was
deposited from a glaciofluvial feeder system emanating from the
valley emerging from the mountain range (ca 13 km) south-westward from the present river mouth.
We interpret the succession of kame, glaciolacustrine, glaciofluvial and marine deposits as a continuum in plaeoenvironmental
change, related to the deglaciation of shelf-based ice nourished by
outlet glaciers. The kames were deposited at an early stage when ice
on the coastal plain had downwasted and retreated sufficiently to
allow lateral ice-dammed lakes to form between the ice and the
coastal mountains. Later, as ice retreat continued, glaciolacustrine
sediments was deposited in larger ice-marginal lakes on the coastal
plain and in the south-trending valleys, e.g. as in Sifs Valley, implying
that the local outlet glaciers had abandoned the outer parts of the
valleys when ice was still present on the coastal plain. In a last stage,
when ice totally disappeared from the coastal plain there was
a marine transgression and deltas and shallow marine sediments
were deposited up to the marine limit at ca 45 m a.s.l. The transition
from late-stage glaciolacustrine to marine conditions was gradual as
suggested from similar lake- and sea-level altitude. The large sandur
around Kaffeklubben River seems to be associated with the marine
limit and the pitted appearance in its distal part suggests melt-out of
buried dead-ice. This dead-ice could possibly be remnants of the
outlet glaciers feeding the shelf-based ice into which the sandur
prograded during its build-up, filling out the depositional spaces
between the ice blocks and covering them. Due to the insulating
effect of the sediments, the melt-out process was slow and it probably continued long after the depositional phase of this system.
A somewhat similar scenario has been described from Arctic
Canada where a large ice stream impinged over a 400 km stretch up
against the coastal mountains (e.g. England et al., 2009). Here proglacial lakes initially were formed, later transformed into epishelf
lakes when the ice stream had thinned and was replaced by an ice
shelf. However, in North Greenland the damming was initially
caused by eastward flowing outlet glaciers, forming shelf-based ice
deflected eastwards by sea ice in the Arctic Ocean. The initiation
area of this ice must have been in the west; the glaciolacustrine
sediments found in for instance Sifs Valley, demonstrate that local
outlet glaciers did not feed the ice on the shelf after LGM but rather
outlets farther to the west, thus also testifying the regional character of the shelf-based ice.
Fig. 13. a) Temporal evolution of the shelf-based ice: main phase (light grey), retreat phase (dark grey) and marine transgression (darkest grey). Arrow indicates inflow of warm
Atlantic water (Bradley and England, 2008). b) OSL and radiocarbon dates of kame and glaciolacustrine sediments (black) and marine and glaciofluvial sediments (red). c) Detrital Fe
grains from PS1230 (Darby et al., 2002; Darby and Zimmerman, 2008) in the Fram Strait matched to North Greenland (black), Laurentide Ice Sheet (green) and Innuitian Ice Sheet
(red). Dashed line represents the minimum percentage of Fe grains for a statistically significant match to the North Greenland area. Percents are weighted as in earlier papers (e.g.
Darby, 2003) so as to avoid misleading percentages where low numbers of grains occur. The weighted percent is the percent of Fe grains matched to a source multiplied by the
number of these grains divided by 10, which is a conservative estimate of the number of Fe grains required for a definitive match. (For interpretation of the references to colour in
this figure legend, the reader is referred to the web version of this article).
�N.K. Larsen et al. / Quaternary Science Reviews 29 (2010) 3399e3414
5.3. Regional implications
Ice shelves in the western part of the Arctic Ocean are to a large
degree controlled by the presence of thick multiyear sea ice that
prevented them from calving into the ocean (Dawes, 1986; Lemmen
et al., 1988; Funder et al., 2004; Engels et al., 2008; Jakobsson et al.,
in this volume). Such close interaction suggests that the stability of
ice shelves is intimately linked to the presence of sea ice, which in
turn is controlled by a complex of factors, including the variable
inflow of warm Atlantic water to the Arctic Ocean (e.g. Bradley and
England, 2008). It has also been discussed by Jakobsson et al. (in
this volume) how Atlantic water inflow may have been altered
during past glacial periods, and they suggest that while Atlantic
water still entered the Arctic through the Fram Strait, its reduced
volume and a deeper halocline resulting from reduced glacial stage
input of freshwater to the Arctic, may have prevented basal melting
of shelf-based ice and sea ice. As sea level recovered during
deglaciation, the volume of Atlantic water into the Arctic Ocean
would increase and the halocline become shallower and this may
have led to a rapid reduction of sea ice and subsequent disintegration of ice shelves including the shelf-based ice occupying the
Arctic Ocean north of Greenland.
Based on the terrestrial chronology it is proposed that the
shelf-based ice began to build-up prior to the LGM around 30 ka,
after which it started to degrade between ca 16 ka to 10.3 cal ka
BP, finally giving way to a marine transgression at ca 10.1 cal ka
BP (Fig. 13). Additional information about the timing has been
obtained by identifying ice-rafted Fe oxide grains from the North
Greenland study area in the well-dated core PS1230 from the
Fram Strait (Darby et al., 2002; Darby and Zimmerman, 2008).
These sand-sized Fe grains (45e250 mm but mostly about 100 mm)
can be precisely matched to samples from the entire circum-Arctic, including the study area, by their unique chemical
composition as measured by electron probe microanalysis of 12
elements in each Fe grain and matched to all compositions of the
same mineral in the circum-Arctic database, which consists of
more than 16,000 grain analyses that were clustered and tested
for compositional uniqueness for each of nine Fe oxide mineral
types (Darby, 2003). The North Greenland Fe grains begin to
increase above background levels at w30 cal ka BP with larger
peaks that are coincident with peaks in Fe grains and IRD from
the Laurentide and Innuitian Ice Sheets (Darby et al., 2002; Darby
and Zimmerman, 2008). The Fe grains from North Greenland
rapidly decrease at 22 cal ka BP, dropping to below significant
levels for valid matches to North Greenland by 12e11 cal ka BP
(Fig. 13c). These data show that outlet glaciers from the Greenland
Ice Sheet and local ice caps in North Greenland delivered icebergs
to the Arctic Ocean and the Fram Strait outflow area of core
PS1230 by w30 ka and we suggest that the shelf-based ice started
to grow at this time. The early build-up towards a full sized shelfbased ice around 20 ka compares well with geophysical modelling
of postglacial rebound that infer a fully established Innuitian Ice
Sheet at w19.5 ka (Tarasov and Peltier, 2004). The reduction in
North Greenland Fe grains from 22 to 16 cal ka BP probably
reflects that local outlet glaciers initially were replaced and
blocked by ice coming from farther to the west. From 16 cal ka BP
until the final break-up of the shelf-based ice at 10.1 cal ka BP
local outlet glaciers began to retreat from the coastal areas and
ice-dammed lakes were formed between the shelf-based ice and
the coastal mountains. Final disintegration of the shelf-based ice
began ca 10.1 cal ka BP, which is also well documented by the
timing of the marine transgression and from the termination of
ice-rafted Fe grain from North Greenland (Fig. 13c). The lack of
renewed influx of North Greenland Fe grains once the shelf-based
ice broke-up seems to supports our interpretation that local
3413
outlet glaciers already had retreated at this time. The marine
transgression coincided with increased inflow of warm Atlantic
water which occurred from 13e11 ka (Bradley and England,
2008), a shallower halocline (Jakobsson et al., in this volume)
and this along with the recorded summer insolation maximum
(Berger and Loutre, 1991), leading to the Holocene Thermal
Maximum, served as primary triggers for the disintegration of the
shelf-based ice (Fig. 13).
6. Conclusions
On the northernmost land stretch in Greenland facing the Arctic
Ocean we found evidence of a shelf-based glaciation during the
LGM. Glacial landforms and ice-flow indicators such as clast fabric
and striations on boulders and the presence of erratic boulders
from Kap Washington, 80e100 km away, all points toward eastward ice-flow along the coastal plain. This ice was nourished by
outlet glaciers coming from further west along the coast. It is
speculated that the ice shelf dynamics was to a large degree
controlled by the presence of thick multiyear sea ice in the Arctic
Ocean, preventing it from breaking up and forcing it to flow along
the northern coast of North Greenland. The shelf-based ice probably started to build-up as early as 30 ka and it reached a maximum
during the LGM. It started to retreat at ca 16 ka to 10.3 cal ka BP but
calved large amounts of icebergs at around 22 ka. During this
period kames and glaciolacustrine sediments were deposited
between the ice shelf and the coastal mountains to the south. The
final break-up of shelf-based ice and the consecutive marine
transgression took place ca 10.1 cal ka BP, probably as a combined
result of increased inflow of warm Atlantic water through the Fram
Strait, a shallower halocline and higher summer temperatures,
corresponding to orbital maximum solar insolation at this time.
Acknowledgements
The LongTerm project, with field seasons on northernmost
Greenland in 2006 and 2007, was conducted under the umbrella of
the International Polar Year (IPY) endorsed APEX (Arctic Palaeoenvironments and its Extremes) project. A substantial part of the
logistic effort was funded by the Danish Research Council (FNU)
and the Commission for Scientific Research in Greenland (KVUG).
Logistic planning and support came from the Danish Polar Centre.
The Swedish participation was funded by the Swedish Research
Council (VR) with additional funding from the Crafoord Foundation,
Ymer-80, Kungliga Fysiografiska Sälskapet and Stiftelsen Lars
Hiertas Minne. Additional logistic support was also provided by the
Swedish Polar Research Secretariat. Jaap van der Meer acknowledges a leave of absence granted by Queen Mary University while
Head of Department. We thank Prof. John H. England and an
anonymous reviewer for valuable comments that significantly
improved the paper.
References
Alexanderson, H., Murray, A.S. Problems and potential of OSL dating Weichselian
and Holocene sediments in Sweden. Quaternary Science Reviews, in press.
Bennike, O., 1987. Quaternary geology and biology of the Jørgen Brønlund Fjord
area, north Greenland. Meddelelser Om Grønland Geosciences 18, 1e23.
Berger, A., Loutre, M.F., 1991. Insolation values for the climate of the last 10 million
years. Quaternary Science Reviews 10, 297e317.
Blake, W., 1999. Glaciated landscapes along Smith Sound, Ellesmere island, Canada
and Greenland. Annals of Glaciology 28, 40e46.
Bradley, R.S., England, J.H., 2008. The Younger Dryas and the sea of ancient ice.
Quaternary Research 70, 1e10.
Darby, D.A., 2003. Sources of sediment found in sea ice from the western Arctic
Ocean, new insights into processes of entrainment and drift patterns. Journal of
Geophysical Research 108 (C8), 3257. doi:10.1029/2002JC001350. 13-1 to 13-10.
�3414
N.K. Larsen et al. / Quaternary Science Reviews 29 (2010) 3399e3414
Darby, D.A., Bischof, J.F., Spielhagen, R.F., Marshall, S.A., Herman, S.W., 2002. Arctic
ice export events and their potential impact on global climate during the late
Pleistocene. Paleoceanography 17. doi:10.1029/2001pa000639.
Darby, D.A., Zimmerman, P., 2008. Ice-Rafted detritus events in the Arctic during the
last glacial interval and the timing of the Innuitian and Laurentide ice sheet
calving events. Polar Research 27, 114e127.
Davies, W.E., 1963. Glacial geology of northern Greenland. Polarforschung 5,
94e103.
Davies, W.E., Krinsley, D.B., 1963. The Recent Regimen of the Ice Cap Margin in
North Greenland, vol. 58. International Association of Scientific Hydrology,
Publication. 119e130.
Dawes, P.R., 1986. Glacial erratics on the Artic Ocean margin of North Greenland:
implications for an extensive ice-shelf. Bulletin of the Geological Society of
Denmark 35, 59e69.
Dyke, A.S., 2004a. An outline of North American Deglaciation with emphasis on
central and northern Canada. In: Ehlers, J., Gibbard, P.L. (Eds.), Quaternary
Glaciations-Extent and Chronology. Part II. North America. Developments in
Quaternary Science, vol. 2b. Elsevier, Amsterdam.
Dyke, A.S., 2004b. An Outline of North American Deglaciation with Emphasis on
Central and Northern Canada.
Engels, J.L., Edwards, M.H., Polyak, L., Johnson, P.D., 2008. Seafloor evidence for ice
shelf flow across the Alaska-Beaufort margin of the Arctic Ocean. Earth Surface
Processes and Landforms 33, 1047e1063.
England, J., 1999. Coalescent Greenland and Innuitian ice during the last glacial
maximum: revising the Quaternary of the Canadian high Arctic. Quaternary
Science Reviews 18, 421e456.
England, J., Atkinson, N., Bednarski, J., Dyke, A.S., Hodgson, D.A., Cofaigh, C.O., 2006.
The Innuitian Ice Sheet: configuration, dynamics and chronology. Quaternary
Science Reviews 25, 689e703.
England, J.H., Furze, M.F.A., Doupé, J.P., 2009. Revision of the NW Laurentide ice
sheet: implications for paleoclimate, the northeast extremity of Beringia, and
Arctic Ocean sedimentation. Quaternary Science Reviews 28, 1573e1596.
Evans, D.J.A., Phillips, E.R., Hiemstra, J.F., Auton, C.A., 2006. Subglacial till: formation,
sedimentary characteristics and classification. Earth Science Reviews 78,
115e176.
Fuchs, M., Owen, L.A., 2008. Luminescence dating of glacial and associated sediments: review, recommendations and future directions. Boreas 37, 636e659.
Funder, S., 1982. C-14 dating of samples collected during the 1979 expedition to
North Greenland. Grønlands Geologiske Undersøgelse Rapport 110, 9e14.
Funder, S., 1989. Quaternary geology of the ice-free areas and adjacent shelves of
Greenland. In: Fulton, R.J. (Ed.), Quaternary Geology of Canada and Greenland.
Geological Survey of Canada, Geology of Canada, pp. 743e792.
Funder, S., Hansen, L., 1996. The Greenland ice sheeteea model for its culmination
and decay during and after the last glacial maximum. Bulletin of the Geological
Society of Denmark 42, 137e152.
Funder, S., Jennings, A.E., Kelly, M., 2004. Middle and late Quaternary glacial limits
in Greenland. In: Ehlers, J., Gibbard, P.L. (Eds.), Quaternary Glaciations-Extent
and Chronology. Part II. North America. Developments in Quaternary Science,
vol. 2b. Elsevier, Amsterdam.
Funder, S., Kjær, K.H., Korsgaard, N.J., Larsen, N.K., Linderson, H., Lyså, A., Möller, P.,
Olsen J. A Holocene sea ice record from Northern Greenland based on raised
marine shorelines and driftwood. (submitted).
Funder, S., Larsen, O., 1982. Implications of volcanic erratics in Quaternary deposits
of North Greenland. Bulletin of the Geological Society of Denmark 31, 57e61.
Hughen, K.A., Baillie, M.G.L., Bard, E., Beck, J.W., Bertrand, C.J.H., Blackwell, P.G.,
Buck, C.E., Burr, G.S., Cutler, K.B., Damon, P.E., Edwards, R.L., Fairbanks, R.G.,
Friedrich, M., Guilderson, T.P., Kromer, B., McCormac, G., Manning, S.,
Ramsey, C.B., Reimer, P.J., Reimer, R.W., Remmele, S., Southon, J.R., Stuiver, M.,
Talamo, S., Taylor, F.W., van der Plicht, J., Weyhenmeyer, C.E., 2004. Marine04
marine radiocarbon age calibration, 0-26 cal kyr BP. Radiocarbon 46,
1059e1086.
Jakobsson, M., Nilsson, J., O’Regan, M.A., Backman, J., Löwemark, L., Dowdeswell,
J.A., Colleoni, F., Marcussen, C., Anderson, L., Björck, G., Darby, D.A., Eriksson, B.,
Hanslik, D., Hell, B., Mayer, L., Polyak, L., Sellén, E., Wallin, �
A. An Arctic Ocean ice
shelf during MIS 6 constrained by new geophysical and geological data.
Quaternary Science Reviews, in this volume.
Koch, L., 1923. Preliminary report upon the geology of Peary land, Arctic Greenland.
American Journal of Science 5, 190e199.
Koch, L., 1928. Contributions to the glaciology of north Greenland. Meddelelser Om
Grønland 65, 181e464.
Krüger, J., Kjær, K.H., 1999. A data chart for field description and genetic interpretation of glacial diamicts and associated sediments e with examples from
Greenland, Iceland and Denmark. Boreas 28, 386e402.
Landvik, J.Y., Weidick, A., Hansen, A., 2001. The glacial history of the Hans Tausen
Iskappe and the last glaciation of Peary land, north Greenland. Meddelelser Om
Grønland Geoscience 39, 27e44.
Larsen, E., Kjær, K.H., Demidov, I.N., Funder, S., Grøsfjeld, K., Houmark-Nielsen, M.,
Jensen, M., Linge, H., Lyså, A., 2006. Late Pleistocene glacial and lake history of
northwestern Russia. Boreas 35, 394e424.
Larsen, N.K., Piotrowski, J.A., 2003. Fabric pattern in a basal till succession and its
significance for reconstructing subglacial processes. Journal of Sedimentary
Research 73, 725e734.
Larsen, N.K., Piotrowski, J.A., Kronborg, C., 2004. A multiproxy study of a basal till:
a time-transgressive accretion and deformation hypothesis. Journal of Quaternary Science 19, 9e21.
Lemmen, D.S., Evans, D.J.A., England, J., 1988. Canadian landform example 10: ice
shelves of northern Ellesmere Island, NWT. Canadian Geographer 32, 363e367.
Murray, A.S., Marten, R., Johnston, A., Martin, P., 1987. Analysis for naturally-occurring
radionuclides at environmental concentrations by gamma spectrometry. Journal
of Radioanalytical and Nuclear Chemistry-Articles 115, 263e288.
Murray, A.S., Olley, J.M., 2002. Precision and accuracy in the optically stimulated
luminescence dating of sedimentary quartz: a status review. Geochronometria
21, 1e16.
Murray, A.S., Wintle, A.G., 2000. Luminescence dating of quartz using an improved
single-aliquot regenerative-dose protocol. Radiation Measurements 32, 57e73.
Möller, P., Larsen, N.K., Kjær, K.H., Funder, S., Schomacker, A., Linge, H., Fabel, D.
Early to middle Holocene valley glaciations on northernmost Greenland.
Quaternary Science Reviews, in this volume.
Mörner, N.-A., Funder, S., 1990. C-14 dating of samples collected during the NORQUA 86 expedition, and notes on the marine reservoir effect. In: Funder, S. (Ed.),
Late Quaternary Stratigraphy and Glaciology in the Thule Area. Geoscience,
Northwest Greenland, Meddelelser om Grønland, pp. 57e59.
Ó Cofaigh, C., Dowdeswell, J.A., 2001. Laminated sediments in glacimarine environments: diagnostic criteria for their interpretation. Quaternary Science
Reviews 20, 1411e1436.
Olley, J.M., Murray, A., Roberts, R.G., 1996. The effects of disequilibria in the uranium
and thorium decay chains on burial dose rates in fluvial sediments. Quaternary
Science Reviews 15, 751e760.
Reimer, P.J., Baillie, M.G.L., Bard, E., Bayliss, A., Beck, J.W., Bertrand, C.J.H.,
Blackwell, P.G., Buck, C.E., Burr, G.S., Cutler, K.B., Damon, P.E., Edwards, R.L.,
Fairbanks, R.G., Friedrich, M., Guilderson, T.P., Hogg, A.G., Hughen, K.A.,
Kromer, B., McCormac, G., Manning, S., Ramsey, C.B., Reimer, R.W., Remmele, S.,
Southon, J.R., Stuiver, M., Talamo, S., Taylor, F.W., van der Plicht, J.,
Weyhenmeyer, C.E., 2004. IntCal04 terrestrial radiocarbon age calibration, 0-26
cal kyr BP. Radiocarbon 46, 1029e1058.
Tarasov, L., Peltier, W.R., 2004. A geophysically constrained large ensemble analysis
of the deglacial history of the North American ice-sheet complex. Quaternary
Science Reviews 23, 359e388.
van der Meer, J.J.M., 1993. Microscopic evidence of subglacial deformation.
Quaternary Science Reviews 12, 553e587.
Weidick, A., 2001. Neoglacial glaciations around Hans Tausen Iskappe, Peary land,
north Greenland. Meddelelser Om Grønland Geosciences 39, 5e26.
�
 Dennis Darby