4th International Conference on Jets, Wakes and Separated Flows, ICJWSF2013
September 17-21, 2013, Nagoya, JAPAN
FLOW STRUCTURE GENERATION BY MULTIPLE JETS
IN SUPERSONIC CROSS-FLOW
∗1
Bernhard Semlitsch,
∗1
∗1
Mihai Mihaescu,
∗2
Ephraim J. Gutmark, and
∗1
Laszlo Fuchs
Linné Flow Center, KTH Mechanics, Royal Institute of Technology
Osquars Backe 18, Stockholm 10044, Sweden
bernhard@mech.kth.se
∗2
Department of Aerospace Engineering, University of Cincinnati
799 Rhodes Hall, Cincinnati, OH 45221-0070, United States of America
ABSTRACT
The flow structure generation by multiple jets impinging a supersonic crossflow in the divergent section of
a Convergent-Divergent (C-D) duct is investigated using
compressible Large Eddy Simulations (LES). The supersonic flow-field in the C-D duct is mainly characterized
by the evolving shock-structure. The effect of increasing
the compressible jet to crossflow velocity ratio R to the
generation of flow structures and the ability to modify
the shock-pattern in the duct was studied. Traversing
R, the shock-pattern can be significantly altered. This
paper demonstrates that for close located jets in crossflow the vortical structures generated by the jets can
interact and give rise to vortical structures in the interspace plane between the jets. The spectra for different
probes are shown illustrating the characteristic flow frequencies. For all simulated cases the spectra show peaks
for a defined Strouhal-number of 0.5. The jets choke in
the crossflow above an R of about 0.65, which results
in a faster disruption of the coherent flow structures induced by the jets. The flow field is analyzed using Proper
Orthogonal Decomposition (POD).
1.
INTRODUCTION
Jet in crossflow is employed in a vast verity of engineering applications, as e.g. thrust vectoring, fuel injection, mixing processes, and film cooling. Due to the
broad field of application, jet in crossflow has been analyzed by many researchers, experimentally and numerically. The focus of research was dedicated to the evolvement, stability and the generation mechanisms of the coherent structures [1, 2], the resulted mixing process [3],
and the heat transport [4] associated with jet in crossflow.
The governing quantities describing the essential flow
phenomena of jet in crossflow are the jet velocity Uj , jet
density ρj , crossflow velocity Ucf , crossflow density ρcf ,
the crossflow dynamic viscosity µcf , the jet dynamic viscosity µj , the jet diameter Dj , the boundary-layer thickness or the separation bubble hight δ0⋆ in front of the jet.
Various dimensionless numbers can be constructed using
these variables. However, an important dimensionless
parameter that can be defined is the momentum ratio
of the jet momentum to the crossflow momentum. For
convenience, the quadratic compressible jet to crossflow
velocity ratio can be defined as,
)
(
ρj Uj2
2
.
(1)
R =
2
ρcf Ucf
This definition is commonly used to characterize the flow
regime of the jet in crossflow. For incompressible flow,
R reduces to the velocity ratio of the jet velocity to the
crossflow velocity ratio. When the jet media and crossflow media are the same ideal gas and the pressure at the
jet orifice is equal the ambient pressure, R simplifies to
a Mach-number ratio of the two streams. Other relevant
dimensionless numbers are the Reynolds-number Re describing the turbulent flow regime, which can be based
on the crossflow quantities Ucf , ρcf , and µcf or on the jet
quantities Uj , ρj , Dj , and µj . However, in compressible
flow also compressibility can play an important role on
the evolution of turbulence in the flow.
The dominant characteristic flow structures generated with jet in crossflow are the counter rotating vortex
pair, the horse shoe vortex, the jet shear layer, the upright vortices, and the hanging vortices. The counter
rotating vortex pair is the most prominent flow structure that spreads with the jet trajectory into the far-field
and preserves several jet diameters downstream. The
horse shoe vortex is generated at the jet orifice where
the crossflow hits the jet. As a smaller flow structure
the horse shoe vortex manifests in front of the jet and
wraps around the jet. The shear-layer vortices have a
ring-like shape and are continuously generated above the
horse shoe vortex. These flow structures travel with the
flow downstream. Hanging vortices, on the edges of the
jet, are caused by a Kelvin-Helmholz instability. These
vortical structures are transporting intense velocity fluctuations generated at the jet orifice far along the jet [2].
In sum, there have been performed many studies analyzing a single jet in crossflow. Only a few studies focus on the effect of many jets in crossflow [5] or twin
jets in crossflow [6, 7]. This study investigates the flow-
�4th International Conference on Jets, Wakes and Separated Flows, ICJWSF2013
September 17-21, 2013, Nagoya, JAPAN
structures evolving due to multiple jets in a supersonic
crossflow using compressible LES. The basic geometry
used in the simulations is a circular convergent-divergent
(C-D) duct. Circumferential disposed jets are used to
manipulate the flow pattern, where the aim is to weaken
the existing shock-pattern to decrease the losses. Several
analyzing methods are used to visualize and identify the
flow structures.
2.
CASE DESCRIPTION
The behavior of jets exposed to a crossflow in the divergent section of a circular (C-D) confined duct is studied. The jets originate from cylindrical tubes disposed
equidistant on the circumference of the duct. Twelve
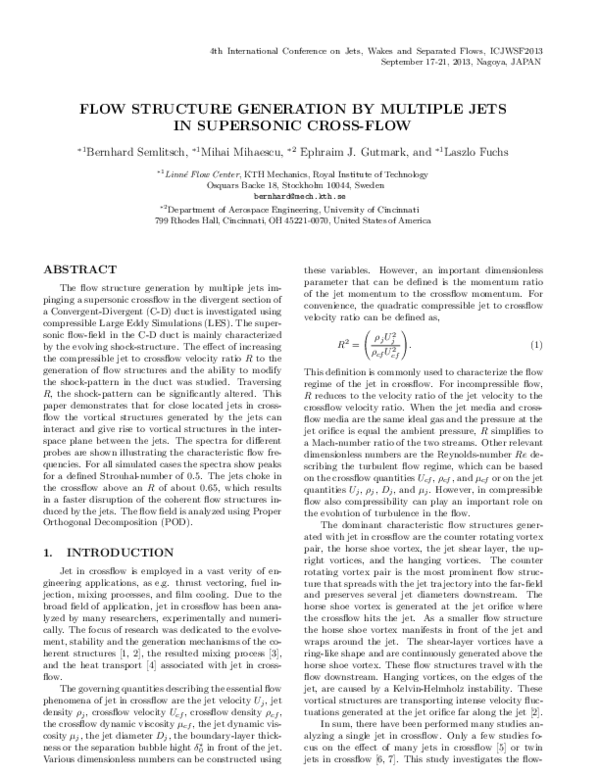
tubes with diameter Dj are inclined 60◦ to the duct midaxis and orientated into the duct flow direction. The orifice of the jets is located −0.857 duct exit diameters (De )
upstream from the duct exit. A visualization of the C-D
duct geometry is illustrated in Fig. 1 and the geometric
relevant parameters are shown in Tab. 1.
Crossflow inlet T0, p0,noz
12 Jets T∞, p0,mic
Convergent-Divergent Duct
Fig. 1 Showing the geometry of the C-D duct crossflow
with the twelve cylindrical tubes disposed in the divergent section.
At the end of the duct, the stream expands into ambient conditions, which are specified in Tab. 1. The operating media is air, obeying the ideal gas law. The isentropic exponent was set to 1.4 and Sutherland’s formula
was used to account for the temperature dependence of
the viscosity, where the standard coefficients where used.
At the inlet of the duct, a total pressures source, four
times higher than the ambient pressure p∞ outside of the
duct, is applied. The total temperature T0,n at the inlet
is 367◦ K.
The jets are fed by a compressed air stream originating from ambient conditions without being additionally
heated. Thus, the total temperature implied at the jet
inlets T0,i is the ambient temperature T∞ . The jet flow
direction is imposed normal to the jet inlet plane and a
total pressure is imposed as driving source.
3.
NUMERICAL METHOD
A finite volume code, solving the three-dimensional
compressible Navier-Stokes equations, was used for the
numerical simulations. Explicit time-stepping using a
low-storage four-stage Runge-Kutta scheme was employed for time integration, where the constant time-step
∆t was 2.5 · 10−8 s. A second order central difference
scheme was used for spatial discretization. A blend of
second and fourth order differences acts as artificial dissipation to suppress numerical solution oscillations near
flow discontinuities, as e.g shocks.
A LES approach was used, where the numerical mesh
resolves a substantial range of turbulent energy decay.
The small-grid scales terms were not modeled in explicit
form. However, the dissipation of the numerical scheme
was used to account for the turbulent dissipation.
The entire computational domain includes an inlet
section, an investigation section, and a buffer region
downstream of the duct section. This buffer region downstream consists of an expansion zone into ambient stagnant conditions, which extends from the duct exit fifteen
duct exit diameters downstream, three duct exit diameters upstream, and five duct exit diameters to the side.
A grid stretching is employed towards the domain
boundaries in the inlet section and the buffer region
downstream to damp reflections at flow inlets and outlets, where characteristic non-reflective boundary conditions were employed. The growth factors are lower than
1.06 in the entire domain.
A fine equidistant cell-spaced section was favored in
the investigation section. Adiabatic no-slip boundary
conditions were assigned at the nozzle walls. Thus, in
the duct region, including injectors, a boundary-layer refined mesh towards the duct walls was utilized. Since,
the flow interaction with walls is consequential for the
flow structures evolution, modeling the wall boundary
with wall functions was abstained.
4.
RESULTS
In this section the results of the numerical LES simulations are presented, where the focus of the work is held
on the flow-structure development provoked by multiple
jets in supersonic crossflow.
Table 1 Reference values and boundary conditions.
parameter
duct exit diameter
injectors diameter
area ratio
duct design Mach-number
ambient pressure
ambient temperature
symbol
De
Dj
Ae /A⋆
Me
p∞
T∞
value
57.5
2.67
1.23
1.56
101,325
288.15
unit
mm
mm
(-)
(-)
Pa
K
4.1
General Flow Observations
Firstly, the general flow-field of the supersonic crossflow shall be described briefly in this section. The baseline is defined as the case without jets streaming into the
crossflow, hence R2 = 0. Thus, the pressure in the jet
tubes is set to ambient conditions at the jet inlet for this
case, which is shown in Fig. 2.
�4th International Conference on Jets, Wakes and Separated Flows, ICJWSF2013
September 17-21, 2013, Nagoya, JAPAN
(a) Mach-number
(b) Density gradient
(a) R2 = 0.11
(d) R2 = 1.18
(b) R2 = 0.44
(e) R2 = 1.45
(c) R2 = 0.57
(f) R2 = 1.58
Fig. 2 The baseline case, R2 = 0, is presented by instantaneous illustrations of the Mach-number and the
density-gradient.
Investigating the flow-field in flow-direction from the
left to right, an expansion fan manifests at the narrowest
cross-section in the duct, which causes the flow to separate from the duct wall. The formation of a separation
bubble and its hight is essential for the later observed
flow features. At the highest point of the separation bubble a shock-root establishes. The flow reattaches to the
nozzle wall at the downstream edge of the injection tube,
where a second shock-root forms. The two shock-roots
build a lambda shock and merge to an oblique shock.
The shock structure amalgamates in the middle of the
nozzle to a Mach-disk. At the Mach-disk, a slip-line establishes and the shock is reflected.
The flow, driven by a total pressure source acting at
the left inlet, exhibits a laminar flow response. Despite
the rather high Reynolds-number of 2.16 · 106 , based on
the quantities in the narrows cross-section of the duct,
the boundary-layer in the nozzle establishes laminar over
the entire investigated duct length. However, where the
separation bubble hits the injection tube unsteady flow
structures are generated.
For low values of R2 < 0.15, the jet crepes on the
walls, as it is desired for film cooling of the duct walls.
However, the shock-structure can be significantly influenced, compared to baseline. The Mach-disk disappeared and the shock-structure is visibly weakened. For
an R2 of 0.11, the initial formation of a second shockstructure, slightly downstream of the first, which can be
seen in Fig. 3(a). Amplifying R2 to 0.44 the downstream
shock-pattern becomes more prominent (see Fig. 3(b)),
while the upstream shock-pattern angles become steeper.
Furthermore, it can be seen that the jet penetrates into
the crossflow and detaches from the duct walls. The
downstream shock-pattern becomes the stronger and the
structures generated by injection increase significantly
for an augmented R2 to 0.57 (see Fig. 3(c)). When R2
is intensified in a range of 1.18 to 1.58, a steepening of
the upstream shock-pattern has been observed, until the
shock-pattern reduces to a bow-shock in front of the jet
(see Fig. 3(d)-(f)).
The development of the turbulent kinetic energy distribution as a function of R2 is shown in Fig. 4 for a
close up section around one the jet pipe. At baseline, the
shear-layer induced by the flow separation at the narrows
Fig. 3 Evolution of compressible jet to crossflow velocity
ratios visualized by the Mach-number contours. (The
scale is kept equal for all plots.)
cross-section hits the downstream intersection of the duct
walls and the jet-pipe. There, a strong peak of turbulent
kinetic energy can be seen, as shown in Fig. 4(a). This
peak immediately disappears with a jet flow exhausting
the pipe, as shown for the case of R2 = 0.11 in Fig. 4(b).
Raising R2 further to 0.57, the jet detaches from the
duct walls and the turbulent kinetic energy distribution
shows high levels in the wake of the jet, especially at
(a) baseline
(c) R2 = 0.57
(b) R2 = 0.11
(d) R2 = 1.18
Fig. 4 Evolution of turbulent kinetic energy as a function of R for a zoomed in section. (The scale is kept
equal for all plots.)
�4th International Conference on Jets, Wakes and Separated Flows, ICJWSF2013
September 17-21, 2013, Nagoya, JAPAN
the duct walls, as shown in Fig. 4(c) and (d). Interesting to observe is that the shear-layer, caused by the
separation bubble, which incidents the jet shear-layer results a high peak of turbulent kinetic energy levels at this
point. The separation bubble increases in size with increased R2 , as one can observe comparing Fig. 4(c) to
(d). The peak value of turbulent kinetic energy appears
where the shear-layer interacts with the jet for a R2 of
0.57, whereas for R2 above 1.18 the peak value of turbulent kinetic energy emerges at the duct walls in the wake
of the jet.
Fig. 5 Illustrating the Görtler-like vortical structures by
the λ2 criteria. Looking from the inlet towards the duct
contraction.
The duct geometry exhibits slight rounded transition sections between the straight tube, the convergent
section, and the divergent section. Thus, Görtler-like
vortices spontaneously arise from the transition of the
straight pipe to the convergent section and convect towards the divergent section, as visualized in Fig. 5. The
strength of the Görtler-like vortical structures is weaker
than the vortical structures in the separation bubble.
However, in a spatial small extend the separation bubble is occasionally disrupted by the Görtler-like vortical structures, but not enough to significantly affect the
flow-field or the governing flow frequencies downstream.
Figure 5 shows an example of a flow-realization in which
Görtler-like vortical structures bend over the separation
bubble and affect the formation of the vertical structures
induced by the injectors. It can also be observed that
only a relative small sector of the duct is influenced by
a single Görtler-like vortical structure.
Fig. 6 The damping character of the flow illustrated by
a time-instant showing the Mach-number.
4.1.2 Point Spectral Analysis In several probes
the time history of the velocity and pressure signal have
been recorded. The power spectra density for the velocity are shown in Fig. 7 for R2 = 0.57 and R2 = 1.18.
Three chosen probes are shown, one in the separation
bubble close to the narrowest cross-section (orange), another one in the separation bubble close to the jet orifice
(red), and one in the shear-layer behind the jet (black),
where the locations are indicated in Fig. 2b. The observed frequencies have been made dimensionless, defining a Strouhal-number St using the jet exit diameter dj
and the mean jet velocity Uj .
A dominant peak frequency in the power spectra
density was observed for all investigated R2 in the shearlayer. Normalized in form of the defined Strouhalnumber, a peak in the spectra at an St of 0.5 can be
observed for all investigated R2 . Also the probes located
in the separation bubble and in the wake of the jet exhibit this dominant peak. The harmonic of this peak
frequency is visible as a hump in the spectra.
For a 90◦ inclined jet in crossflow, incompressible
flow assumption and an R2 of 0.456 a dominant peak at
St of 0.353 was found in [1], which was associated with
the hair-pin vortical structures. However, a peak at this
St can also be found in the spectra shown in Fig. 7.
The power spectra density of the probes in the separation bubble show further spectral peaks. For an R2
of 1.18 (shown in Fig. 7), the low frequency oscillating
motion of the upstream shock-pattern correlates with the
probe in the separation bubble close to the narrows crosssection of the duct.
Although the spectra of all the monitored signals (in
0
0
10
10
−1
−1
10
PSD
10
PSD
4.1.1 Damping Character of the Flow An important flow feature that shall be illustrated, is the damping
nature of the compressible flow to the evolution of flow
stability in the duct. A case for R2 = 1.45 has been simulated using the inviscid Euler equations, which is shown
in Fig.6. Thus, at the duct walls a slip boundary condition was applied. The flow exhibits laminar flow structure in the investigated section and no unsteady flow
motion is visible. Even an perturbed initial flow-field
converges quickly to a laminarized flow-field. Thus, the
unsteadiness of the flow in the viscous case is caused by
the vorticity transport, which is generated at the walls.
−2
10
−3
10
−5/3
−2
10
−3
10
−4
−5/3
−4
10
10
−1
0
10
10
St
−1
0
10
10
St
(a) R2 = 0.57
(b) R2 = 1.18
Fig. 7 Power spectra density of the velocity signals observed in the probes (location is indicated with color
coded crosses in Fig. 2b).
�4th International Conference on Jets, Wakes and Separated Flows, ICJWSF2013
September 17-21, 2013, Nagoya, JAPAN
the separation bubble and the jet wake) exhibit matching
spectral peaks, the cross-correlation between the pressure signals in these monitoring points is lower than 0.4.
The probes monitoring the Görtler-like vortical structures shows a very low correlation with the other monitoring points in the scope of the jet. The characteristic
frequency associated with the Görtler-like vortical structures is more than three orders of magnitude lower than
the frequencies associated to the hairpin vortical structures.
(a) R2 = 0.57
(b) R2 = 1.18
Fig. 9 The vortical structures visualized by the λ2 criteria before the jet chokes (a) and when the jet chokes
(b).
4.3
The counter rotating vortex pair is the most characteristic flow feature of jets in crossflow and preserves
far downstream over the duct length, as one can also observe in Fig. 8. The figure illustrates the formation of
the counter rotating vortex pair by (representative positive and negative) iso-surface of axial vorticity component. Clustering of equal spaced segments for each jet
can be observed. This devision into spatial segments acts
Fig. 8 The counter rotating vortex pair is visualized by
iso-contours of the axial vorticity, cyan negative and blue
positive.
like a symmetry boundary condition. With the separation bubble, prior to the jet streaming into the crossflow,
vortical structures generated by the induced shear-layer
and shade downstream. However, near in front of the
jets, a vortical structure, covering the horse shoe vortex,
develops. These structures stretch laterally towards the
vortical structures from the other neighboring segment.
With the interaction of these vortical structures and the
vortical structures shading from the separation bubble,
a weaker small counter rotating vortex pair in the interspace plane of the jets is generated. This structure
formation can be also clearly seen in Fig. 5.
The vortical hairpin structures have been reported
to be very organized for low R [8]. However, at an R2
higher than 0.65, the jet chokes in this case setup and
the formation of a barrel shock at the outlet of the jet
leads to a higher frequent vortex shading, as on can see
comparing Fig. 9a and Fig. 9b.
Proper Orthogonal Decomposition
Flow decomposition methods are commonly used to
investigate and extract flow features. An overview for the
proper orthogonal decomposition method can be found
in [9]. Using this method the most energetic flow modes
can be visualized. Furthermore, POD has been applied
to jet in crossflow, using experimental acquired data [10].
A snapshot approach, using instantaneous velocity
data, has been used to compute the modes. 1170 snapshots sampled at a frequency of 266 kHz have been used
to compute the modes. The characteristic flow frequencies spread over many orders of magnitudes. Thus, it is
hardly possible to capture all occurring frequencies by
this approach.
Figure 4 indicates that only a small proportion of the
investigated domain in the nozzle exhibits unsteady flow
behavior. For the case of R2 = 1.18, the zeroth mode
(mean flow) of the POD decomposition carries about
99.5% of the flow energy. Thus, the higher modes representing the unsteady flow motion contain a very low part
of the flow energy. The unsteady flow energy distribution for the leading modes of the POD decomposition is
shown in Fig. 10a, where fair energy decay over the POD
modes can be observed. In Fig. 10b the spectral portray
of the all computed POD modes is shown, where mainly
two peaks can be seen.
For the illustrative chose case of R2 = 1.18, Fig. 11
shows four representative chosen topo modes obtained
through the POD decomposition. The leading modes can
be associated with the shading of the jet, where the conx 10
−3
3
mode 12
mode 3
mode 2
mode 1
8
2.5
7
6
2
PSD
Vortical Structures
Flactuation energy (%)
4.2
1.5
5
4
3
1
2
0.5
1
0
1 2 3 4 5 6 7 8 9 10 11 12 13 14 15 16 17 18 19 20
POD mode
0
0.2
0.4
0.6
0.8
1
St
(a)
(b)
Fig. 10 The distribution of the unsteady flow energy is
shown to the left. To the right, the spectra of the chrono
modes are plotted, where the modes shown in Fig. 11 are
highlighted.
�4th International Conference on Jets, Wakes and Separated Flows, ICJWSF2013
September 17-21, 2013, Nagoya, JAPAN
(a) POD mode 1
(c) POD mode 3
structures have been analyzed. 99.5% of the flow energy
is comprised by the zeroth mode, since only a small part
of the domain exhibits unsteady motion. The dominant
peak frequency seen in the probes was confirmed by the
POD analysis and the according flow structure has been
shown. Also the low frequency flow structures have been
identified using the POD decomposition.
ACKNOWLEDGEMENT
(b) POD mode 2
(d) POD mode 12
Fig. 11 The topo modes of the POD decomposition are
shown.
This work was supported by the Swedish National Infrastructure for Computing (SNIC 002-12-11) via PDC.
REFERENCES
tours are slightly shifted against each other. However,
the peak values occur at different locations. The first
two modes are shown in Fig. 11a-b. The corresponding
(overlapping) frequencies of the chrono modes are shown
in Fig. 10b, where it can be observed that the peak frequencies for the associated chrono modes are around a
St of 0.5.
The 3th mode contains the most flow energy with a
chrono mode at a low frequency, where the topo mode is
shown in Fig. 11c. The shape of the topo mode exhibits
a high amplitude at the duct wall in the wake of the jets,
which could also be seen in the turbulent kinetic energy
levels show in Fig. 4d.
The Görtler-like vortical structures are indicated in
the shape of the 12th topo mode, which is shown in
Fig. 11d. Furthermore, the shock-structure is visible for
this mode. The corresponding chrono mode reveals a frequency at the lower bound of the spectra (see Fig. 10b).
However, only a few topo modes contain high magnitudes in the convergent section, where all of them are
related to low frequency chrono modes.
[1] Ilak. M, Schlatter P., Bagheri S. and Henningson S.
D., Bifurcation and stability analysis of a jet in crossflow: onset of global instability at a low velocity ratio,
J. Fluid Mech., 696, pp. 94-121 (2012).
5.
[6] Gutmark J. E., Ibrahim M. I., Murugappan S. Dynamics of single and twin circular jets in cross flow,
Experiments in Fluids, 50 (3), pp. 653-663 (2011)
CONCLUSIONS AND DISCUSSION
Multiple jets disposed at the circumference of a circular C-D duct in a supersonic crossflow have been investigated using compressible LES simulations. Several
jet to compressible crossflow velocity ratios have been
investigated and the ability to modify the shock-pattern
has been shown.
Using inviscid calculations, it could be show that the
vorticity is transported from the walls. The influence of
the Görtler-like vortical structures generated upstream
of the jets on the jet flow-field has been shown to be
minor and occurring at a low frequency. The formation
of the counter rotation vortex pair and the generation
of a secondary counter rotation vortex pair due to the
formation of the sections has been shown.
The governing frequencies have been monitored in
several probes in the duct. For a defined Strouhalnumber, a dominant peak has been observed for all investigated R in the separation bubble in front of the jets
and in the downstream section of the jets.
A POD study has been performed and the flowView publication stats
[2] Yuan L. L., Street L. R., and Ferzinger H. J., Largeeddy simulations of a round jet in crossflow, J. Fluid
Mech., 379, pp. 71-104 (1999).
[3] Kawai S., and Lele K. S., Large-Eddy Simulation of
Jet Mixing in Supersonic Crossflows, AIAA Journal.,
48-9, pp. 2063-2083 (2010).
[4] Dano P.E.B., Liburdy A. J., and Kanokjaruvijit K. ,
Flow characteristics and heat transfer performances
of a semi-confined impinging array of jets: effect of
nozzle geometry, International Journal of Heat and
Mass Transfer , 48, pp. 691-701 (2005).
[5] Schlüter, J.U. and Schönfeld, T, LES of Jets in Cross
Flow and Its Application to a Gas Turbine Burner,
International Journal of Heat and Mass Transfer , 65
2, pp. 177-203 (2000).
[7] Naik-Nimbalkar V.S., Suryawanshi A.D., Patwardhan A.W., Banerjee I., Padmakumar G. and
Vaidyanathan G., Twin jets in cross-flow, Chemical
Engineering Science, 66 12, pp. 2616-2626 (2011).
[8] Rowley W. C., Mezic I., Bagheri S, Schlatter P. and
Henningson D., Spectral analysis of nonlinear flows,
J. Fluid Mech., 641, pp. 115 - 127 (2009).
[9] Berkooz G., Holmes P., and Lumley J. L., The Proper
Orthogonal Decomposition in the Analysis of Turbulent Flows, Annual Review of Fluid Mechanics, 25,
pp. 539-575 (1993).
[10] Meyer E. K., Pedersen M. J. and Özcan O., Turbulent jet in crossflow analyzed with Proper Orthogonal Decomposition, J. Fluid Mech., 583, pp. 199-227
(2007).
�
 Laszlo Fuchs