orIgInal research arTIcle
Training volume and injury incidence in a professional
rugby union team
Wayne Viljoen (PhD, cscs)1
colleen J saunders (Bsc (Med) hons (exercise science))2
greg D hechter (Ba hons (Biokinetics))3
Kerith D aginsky (PhD)2
helen B Millson (MPhil (sports Physiotherapy))3
1
2
3
SA Rugby (Pty) Ltd, Cape Town
UCT/MRC Research Unit for Exercise Science and Sport Medicine, Department of Human Biology, University of Cape Town
Western Province Rugby (Pty) Ltd, Cape Town
abstract
objective. To describe the incidence of injuries in a professional
rugby team, and to identify any associations between injury rates
and training volume.
Methods. This retrospective, descriptive study included all injuries diagnosed as grade 1 and above in a South African Super 12
rugby team. Injury incidence and injury rates were calculated and
compared with training volume and hours of match play.
results. Thirty-eight male rugby players were injured during the
study period. The total number of annual injuries decreased from
2
50 (2002) to 38 (2004) (χ =0.84, p=0.36). The number of new in2
juries showed a similar trend (χ =2.81, p=0.09), while the number
of recurring injuries increased over the 3-year period. There was
a tendency for total in-season injury rates to decrease over the
2
3 years (χ =2.89, p=0.09). The pre-season injury rate increased
2
significantly over the 3 years (χ =12.7, p<0.01), coupled with a
reduction in training exposure over the pre-season phase.
conclusions. One has to be cognisant of the balance between
performance improvement and injury risk when designing training programmes for elite rugby players. Although the reduction
in training volume was associated with a slight reduction in the
number of acute injuries and in-season injury rates over the three
seasons, the performance of the team changed from 3rd to 7th
(2002 and 2004, respectively). Further studies are required to determine the optimal training necessary to improve rugby performance while reducing injury rates.
Introduction
Rugby union is a team sport involving contact and collision of play1
2
ers running at fast speeds, and consequently has a high injury rate.
3-5
Since the advent of professionalism in rugby union in October 1995
professional players have become full-time athletes, with a greater
6
emphasis on training for strength, speed and stamina, increase
5,7
4,5
3
in size,
speed and power,
and improvement in rugby skills.
Professional rugby players sustain considerably more injuries than
3,6,8
amateur players,
probably as a result of the greater size of the
players, the faster pace at which the game is played, and the greater
3,9,10
impact forces associated with these changes.
The Super 14 (previously the Super 12) is a popular professional
rugby tournament between regional sides from South Africa, New
Zealand and Australia. Since the inception of this tournament,
professional rugby union players have played significantly more
rugby matches each year. Many elite South African players, who also
play in national provincial tournament and international matches,
may participate in as many as 35 matches in one season.
The multiplicity of factors that contribute to injury in rugby union
9
makes it difficult to identify causality. However, to adequately
condition players, reduce their risk of injury, and treat and
rehabilitate rugby injuries appropriately, it is important to gain a
better understanding of the nature and causes of rugby injuries, in
2
particular their association with training. Therefore, the purpose of
this study was to describe the incidence of injuries in a professional
South African Super 12 rugby team over 3 years (2002 - 2004), and
to identify any associations between injury rates and the mode and
volume of training.
Methods
Participants
corresPonDence:
Dr Wayne Viljoen
Manager
BokSmart National Rugby Safety Programme, SA Rugby (Pty) Ltd
PO Box 99
Newlands 7725
Tel: +2721-659 6732
E-mail: waynev@sarugby.co.za
saJsM Vol 21 no. 3 2009
During the off-season 40 contracted players were selected to form
part of the Super 12 rugby union training squad. Twenty-two of the
initial 40 players were forwards, and 18 were backline players. In
February, the number of contracted players was reduced to 28 (15
forwards and 13 backline players). The injured players in this study
(N=38) were all male (26±2 years of age). In accordance with simi11
lar research, and due to the nature of the professional game, the
individuals who comprised the squad varied over the 3 years. Ten
97
�The off-season training cycle extended from mid-November to midDecember every year. Players then had an active rest period until
the first week in January, when pre-season training began. The preseason training period entailed formalised strength and conditioning
sessions, rugby training, training camps, unofficial ‘friendly’ matches
(N=3, 2002; N=3, 2003; N=2, 2004), and specific individualised preparation.
The Super 12 tournament consisted of 5, 3 and 4 regional teams
from New Zealand, Australia and South Africa, respectively, began in
mid-February, and continued until mid-May. The number of matches
varied depending on how well the team fared in the tournament
(N=12, 2002; N=11, 2003; N=11, 2004). Players had approximately
2 weeks off at the end of the tournament and then participated in the
national provincial tournament and/or in international test matches.
Off-season musculoskeletal evaluations and medical screening
assessments by the physiotherapist and the team sports physician
precluded any previously diagnosed injuries and injuries sustained
during other tournaments from being carried over to the analysis of
the current study.
Data collection
Data were collected under the guidance of the same team physiotherapist and strength and conditioning trainer for the duration of
12,13
the study. All injuries requiring medical attention,
diagnosed as
grade 1 or above, were documented either directly after or within 5
days of the injury occurring, regardless of whether or not the injury
11
resulted in the player missing training or not playing in a match. A
grade 1 injury was defined as one in which there was pain, with mini14
mal loss of muscle function or strength. We are cognisant of the
12
consensus document on injury definitions published in 2007. However, as our study was conducted before the consensus paper was
published, the definition of injuries in our study was slightly different.
An examination of the consensus definition suggests that the definition used in this study may slightly over-estimate the occurrence of
an injury compared with the consensus definition.
Injury rates
Injury rates were determined using previously described methods
and expressed as the number of injuries sustained per 1 000 hours
2,11-13,15-17
at risk.
Match injury rates were calculated on the premise
18
that there were only 15 player positions on the field, regardless of
any substitutions made during the game. Match injury rates were
computed under the assumption that rugby union matches last on
9,11,18,19
average 80 minutes (1.33 hours) per game.
Training injury
13
rates were reported as a function of total training exposure time.
Number of
injuries
Preparation for the super 12 tournament
60
50
40
15
250
200
TIE = hours of supervised training x no. of contracted players
(either 40 or 28).
98
In-season
match injury rates
150
100
50
(C)
0
200
Overall match injury
rates
150
100
50
0
4
Training injury rates
(D)
3
2
0
• Training injury exposure (TIE) was determined in a similar way:
(B)
0
MIE = hours of play (1.33) x no. of players on the field (15) x no.
of matches played.
Match injury rates = (no. of injuries during matches/MIE) x
1 000.
Total injury rates
5
1
Match injury rates were then calculated:
(A)
10
• Match injury exposure (MIE) was determined by the number of
games played during the specified seasonal cycle:
•
Total injury
30
Injuries per 1000 player hours
of these players were also part of the South African national squad.
Informed consent was obtained by the union, and the Ethics Committee of the University of Cape Town approved this study.
2002 2003 2004
(E)
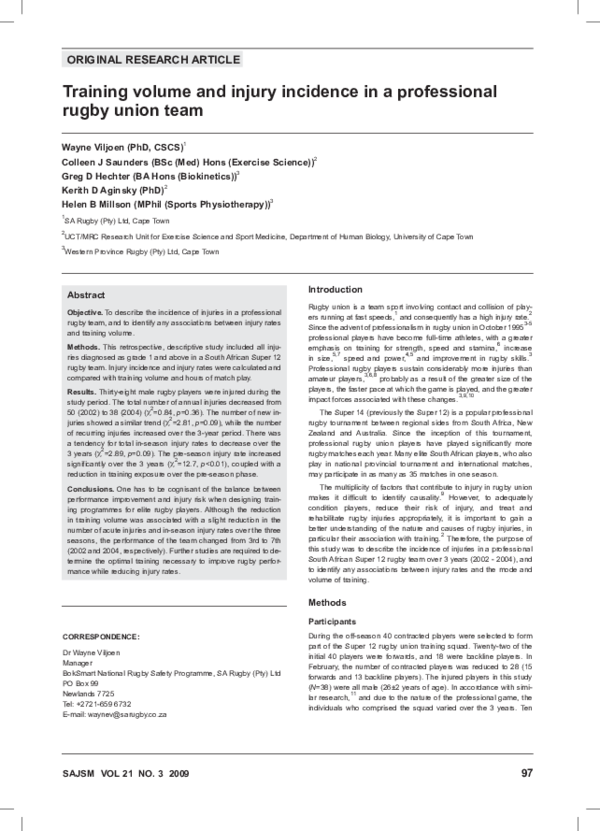
Figure
1 total number of injuries and injury rates incurred
Fig.
1. The
over a 3-year time period in a Super 12 Rugby Union team. (A)
Total number of injuries incurred over the 3 years; (B) total injury rates over the 3 years, combining match and training injury
rates; (C) in-season match injury rates; (D) overall match injury
rates combining pre- and in-season rates; (E) training injury
rates over the 3 years.
saJsM Vol 21 no. 3 2009
�TaBle I. number of injuries sustained and overall
time spent on training (hours) from 2002 to 2004
2002
2003
2004
Number of injured players
19
22
21
Recurrent injuries
12
10
18
New injuries
38
30
20
Total injuries
50
40
38
Off-season training (h)
32.7
28.1
30.7
Pre-season training (h)
56.2
63.8
40.5
Combined off- and pre
88.8
91.8
71.2
In-season training (h)
107.7
78.6
79.9
Overall training time (h)
196.5
170.4
151.1
results
Injury incidence
Table I and Fig. 1A show that the total number of injuries incurred
per year decreased gradually, but not significantly, from 50 (2002)
2
to 38 (2004) χ =0.84, p=0.36). The number of new injuries showed
2
a similar trend, decreasing from 38 (2002) to 20 (2004) (χ =2.81,
p=0.09). When these values were normalised to the number of injured players, a similar pattern was found: 2.60 (2002), 1.82 (2003),
and 1.80 (2004) injuries per injured player. The number of recurring injuries increased over the 3-year period from 12 (2002) and
10 (2003) to 18 (2004). Although this increase was not statistically
2
significant (χ =0.63, p=0.43), it is clinically relevant as it is known
that recurrent injuries are frequently under-reported within a season
13
by nature of their definition.
-season training (h)
TaBle II. Training injury exposure and injury rates within a super 12 rugby team over a 3-year period
Match injuries
Seasonal cycle
2002
Pre
MIE (h)
No. of injuries
60
38
2003
240
35
Pre
60
3
27
In
2004
Pre
50
(10.4 - 139.2)
220
24
40
7
175
(73.4 - 327.8)
220
23
126.7
145.8
(91.2 - 169.7)
(103.7 - 196.9)
109.1
(71.2 - 158)
30
In
Match IR (95% CI)
50
(10.4 - 139.2)
3
In
Hours of training
1 04.5
(67.4 - 152.7)
96.4
TIE (h)
per match
(95% CI)
29.5
0.8
(0.2 - 2.4)
3 015
9.0
14.4
(10.6 - 19.2)
3 671
30.6
2.4
(1.1 - 4.6)
2 200
7.1
12.8
(8.7 - 18.1)
2 847
35.6
4.2
(2.1 - 7.3)
7.3
10.6
(6.9 - 15.5)
3 540
(64.5 - 137.2)
115.4
Total IR
(79.2 - 160.6)
2 238
7.3
(5.4 - 9.6)
6.5
(4.7 - 8.8)
7.1
(5.0 - 9.8)
MIE = match injury exposure; TIE = training injury exposure.
All injury rates (IR) are represented as the number of injuries incurred per 1 000 hours of player exposure, and the 95% confidence intervals (CIs) are represented in parentheses. For this
table, the pre-season represents both the off- and pre-season time periods.
• Training injury rates were then calculated:
Training injury rates = (no. of injuries during training/TIE) x
1 000.
• Subsequently total injury rate was determined as the number of
injuries sustained in a seasonal cycle:
Total injury rates = (no. of injuries sustained/(MIE+TIE)) x 1 000.
These were determined for both pre-season and in-season
periods.
statistical analysis
Basic descriptive statistics were used to explain the accumulated injury and training data over the 3 years. The 95% confidence intervals
(CIs) for the injury incidence data were calculated using an exact
binomial distribution. Differences in the incidence of injuries between
categories for the three seasons were assessed using a chi-square
2
analysis for trend (χ ). Additionally, year-by-year comparisons between data were done using a 2 x 2 contingency table chi-square
analysis applying Yates’ continuity correction. Statistical significance
was accepted when p<0.05.
saJsM Vol 21 no. 3 2009
Table II and Figs 1 and 2 specify the overall training exposure and
injury rates within the Super 12 team over the 3 years. Table II shows
that the number of match injuries sustained during the Super 12
season decreased from 38 (2002) to 27 (2003) and 30 (2004). While
there was a tendency for a reduction in in-season match injury rates
2
(χ =3.44, p=0.06), the overall match injury rates remained relatively
2
unchanged over the 3 years (χ =0.31, p=0.58). In the pre-season
phase, Table II shows an increase in the number of hours trained per
match over the 3 years. However, this may be misleading because
in 2004 the team played one less pre-season ‘friendly’ match. If they
had played the same number of pre-season ‘friendly’ matches in
2004, the training hours per match would have been 23.7 instead of
35.6. Table II also shows a meaningful reduction in training per match
during the competition season in 2003 (9.0 v. 7.1 v. 7.3 hours per
match – 2002, 2003, 2004, respectively), coupled with a tendency for
2
the total in-season injury rates to decrease over the 3 years (χ =2.89,
p=0.09). The pre-season injury rate, however, increased significantly
2
over the 3 years (χ =12.7, p<0.01), and was coupled with a reduction
in TIE over the pre-season phase – 3 540 (2002), 3 671 (2003) and 2
847 (2004) player exposure hours. The total injury rates, as with the
abovementioned overall match injury rates over the entire training
99
�Training time (hours)
Total
220
210
200
190
180
170
160
150
140
130
120
(A)
In season
120
110
100
90
80
(B)
70
Pre season
70
60
50
Discussion
40
30
Injury incidence
20
10
0
(C)
2002
2003
2004
Fig. 2. Training volumes over the 3-year period studied. (A) Total training volumes over the 3-year period expressed in hours,
combining off-, pre- and in-season training; (B) total in-season
training volumes; (C) total pre-season training volumes.
season (off-, pre- and in-season), remained similar over the 3 years
2
(χ =0.01, p=0.90).
Training analysis over the 3 years
Seventy-four per cent of all injuries sustained over the 3 years occurred in a rugby match while 21% were related to rugby practice.
Very few injuries were related to gym, rugby fitness conditioning or
other causes. It is however prudent for the development of appropriate injury prevention strategies in rugby union to analyse the training
patterns utilised in this study, as much more time is spent training for
15
rugby than playing rugby.
Table I shows the breakdown of time spent within the various
training cycles over the 3 years. Off-season training time remained
similar. However, it is evident that pre-season training volume
increased slightly in 2003 (56.2 - 63.8 hours), and then decreased
by 37% in 2004 to 40.5 hours (Fig. 2C). Although not significant
2
(χ =2.14, p=0.14), this reduction has practical importance and is
reflected in the combined preparatory training cycle (91.8 - 71.2
2
hours) (χ =1.12, p=0.29). A noticeable 27% decrease in in-season
2
training volume (χ =1.97, p=0.16) was observed between 2002 and
2003 (Fig. 2B) and this reduction was maintained in 2004. If one
compares the overall time spent on training, it is clear (Fig. 2A) that
there was a noticeable trend towards a reduction in training volume
2
over the 3 years (χ =3.06, p=0.08).
100
Table III shows the breakdown of the training data collected over the
3-year study period. Rugby conditioning or fitness training contributed to 8% of the total training time over the 3 years and formed 23%,
12% and 2% of the off-, pre- and in-season phases, respectively.
Conditioning was defined as any form of rugby fitness training such
as anaerobic intervals, aerobic training, fuel mix conditioning, and
15,16
speed and agility training,
and played a larger role in the off- and
pre-season than during the in-season. Gym training formed 23% of
the total training time, and contributed to 35%, 19% and 21% of the
off-, pre- and in-season phases, respectively. The time spent on gym
training in the pre-season phase was reduced over the 3 years (2002:
26%; 2003: 16%; 2004: 14%). Rugby training sessions were defined
as including structured game phase plays, skills training, kicking sessions, split sessions, defensive sessions, line outs, scrummaging,
15,16
rucks, mauls and match training,
and formed 53% of the total
training time contributing to 36%, 49%, and 62% of the off-, pre- and
in-season training phases, respectively. The amount of time spent
on rugby training during the in-season was also reduced over the
3 years (2002: 67%; 2003: 61%; 2004: 59%). The Eco-challenge,
a 24-hour endurance event during a training camp, was included in
this analysis as it contributed to a large amount of TIE during 2003.
Training injury rates (Fig. 1E) accounted for 1.9 injuries/1 000 player
training hours over the 3 years studied (2002: 1.8 (95% CI: 0.9 - 3.2);
2003: 2.2 (95% CI: 1.2 - 3.8); 2004: 1.6 (95% CI: 0.7 - 3.1)).
The first finding from this study was that the number of total injuries
(Fig. 1A) and number of new injuries (Table I), albeit not significant,
gradually decreased over the 3 years. However, when comparing the
total (Fig. 1B) and match injury rates (Fig. 1D) this downward trend
was not evident (Table II). Match injury rates tended to decrease
between 2002 and 2003, but increased again in 2004. As match injuries contributed to most injuries sustained during the season, the
same pattern reflected in the overall injury rates (Table II). The lower
injury rate in 2003 coincided with a sizeable reduction in in-season
training volume. The medical and coaching staff then reduced the
pre-season training volume in 2004, which corresponded to match
and total injury rates over the season, returning to levels similar to
those of 2002. It would appear that training reductions had a tendency to lower the in-season match (p=0.06) and in-season total
(p=0.09) injury rates over the 3 years, albeit not significantly, with
the most prominent reduction between 2002 and 2003. Total preseason injury rates and the number of recurrent injuries show the
opposite trend, for which there were two possible reasons. Firstly,
newly contracted players from other unions may have been brought
into the squad with pre-existing or unrehabilitated injuries. Secondly,
the rest period between the previous tournament and the start of the
new season did not always allow sufficient time to rest, recover and
completely rehabilitate with regard to injuries. The only major change
in training between 2003 and 2004 was the reduction in pre-season
training volume (Table I).
It has previously been suggested that training volume may
11,20
significantly affect injury rates over a competitive season.
The
overall number of hours spent training during the pre-season is
15
significantly higher than that during the in-season, and pre-season
17
training contributes to approximately 38% of all training injuries. A
previous study showed that the likelihood of injuries in rugby league
20
increased with increasing pre-season training loads. However,
when the authors examined the early and late competition phases
in the same team, increases in training load showed no further
saJsM Vol 21 no. 3 2009
�20
increases in injury incidence. Another study using rugby league
players showed a 10 - 16% reduction in pre-season training to be
effective in reducing injury rates by 40 - 50%, without compromising
21
fitness.
However, reductions in pre-season training may not
8
necessarily reduce the risk of ensuing injury. Other research has
shown that strenuous physical activity of 5 - 39 hours per week has
a protective effect against injury but pre-season exposure of greater
9
than 39 hours a week was associated with a greater risk of injury.
training and total injury rates and the performance of the Super 12
rugby team as defined by their position on the log, which tended to
decline. One has to be cognisant of the fine balance between performance improvement and the risk of injury when designing training
15
programmes for elite rugby players. Further studies are required to
determine how much training is optimal to maintain or increase rugby
20,21
performance while effectively reducing injury rates.
During the pre-season, there are both higher training loads and a
greater emphasis on tackling and defensive drills, thereby increasing
contact exposure. It is therefore inevitable that injuries will result
20
from the pre-season training. Although there is evidence to support
21
reducing the pre-season training load in rugby league, the data
from the current rugby union study question the effectiveness of
reducing the pre-season training load too much. Appropriate preseason conditioning is necessary to prepare collision sport athletes
20
for the physiological and musculoskeletal demands of competition.
Based on the current data, it appears as if the reduction in in-season
training volume alone may be more effective in lowering injury rates
over a competitive season. Although not significant, the noticeable
reduction in in-season match injury rates (2002 - 2003) and in-season
total injury rates (2002 - 2004) provides moderate support for this
conclusion. Nonetheless, with the reduction in overall training load
over the 3 years, there was no statistically significant improvement in
either the number of injuries or the overall injury rates. In addition, it
should be noted that the team studied here ended 3rd, 9th, and 7th in
the Super 12 tournament during 2002, 2003 and 2004, respectively.
This raises questions around the effect it may have on the overall
performance of the team. The team had most injuries when they
ended 3rd and least injuries when they ended 9th in the tournament.
It is currently a challenge for strength and conditioning specialists to
establish the optimum balance between training volume and intensity
to effectively reduce injuries without compromising the necessary
20,21
improvements in physical fitness and performance.
references
Training effects
Although the incidence of injury during training is far less than during
matches, one cannot negate the possible effect of rugby training as
15
a cause of injury. Unlike during the match situation, one can to a
17
large extent control what happens during training. Because of the
physical nature of rugby, training sessions require adequate intensity
to optimally develop the fitness parameters required to compete ef21
fectively. The effects of so-called ‘match fitness’ drills that encompass rugby-specific training, such as physical impact drills, have not
been sufficiently researched. Game-specific drills incorporating elements of contact such as rucks and mauls have the highest risk of
15
injury. Further study is required to ascertain the level and progression of match fitness conditioning necessary to adequately prepare
9
players for rugby matches and reduce the risk of injury.
1. Duthie G, Pyne D, Hooper S. Applied physiology and game analysis of
rugby union. Sports Med 2003;33(13):973-991.
2. Brooks JH, Fuller CW, Kemp SP, Reddin DB. Epidemiology of injuries in
English professional rugby union: part 1 match injuries. Br J Sports Med
2005;39(10):757-766.
3. Bathgate A, Best JP, Craig G, Jamieson M. A prospective study of injuries
to elite Australian rugby union players. Br J Sports Med 2002;36(4):265269.
4. Silver JR. The impact of the 21st century on ruby injuries. Spinal Cord
2002;40:552-559.
5. Williams JP. Rugby union. Spinal Cord 2002;40(12):669.
6. Garraway WM, Lee AJ, Hutton SJ, Russell EB, Macleod DA. Impact of professionalism on injuries in rugby union. Br J Sports Med 2000;34(5):348351.
7. Olds T. The evolution of physique in male rugby union players in the
twentieth century. J Sports Sci 2001;19(4):253.
8. Lee AJ, Garraway WM, Arneil DW. Influence of preseason training, fitness, and existing injury on subsequent rugby injury. Br J Sports Med
2001; 5(6):412-417.
9. Quarrie KL, Alsop JC, Waller AE, Bird YN, Marshall SW, Chalmers DJ.
The New Zealand rugby injury and performance project. VI. A prospective
cohort study of risk factors for injury in rugby union football. Br J Sports
Med 2001; 5(3):157-166.
10. Silver JR. Professionalism and injuries in rugby union. Br J Sports Med
2001;35(2):138.
11. Millson HB, Hechter GD, Aginsky KD, Bolger C, Saunders CJ. The nature
and incidence of injuries in a Currie Cup rugby team from 2001 to 2003.
S Afr J Sports Med 2005;17(2):13-17.
12. Fuller CW, Molloy MG, Bagate C, et al. Consensus statement on injury
definitions and data collection procedures for studies of injuries in rugby
union. Clin J Sports Med 2007;17:177-181.
13. Brooks JH, Fuller CW. The influence of methodological issues on the
results and conclusions from epidemiological studies of sports injuries.
Illustrative examples. Sports Med 2006;36(6):459-472.
14. Brukner P, Khan K. Clinical Sports Medicine. Sydney: McGraw-Hill,
1994.
15. Brooks JH, Fuller CW, Kemp SP, Reddin DB. Epidemiology of injuries
in English professional rugby union: part 2. Training injuries. Br J Sports
Med 2005;39(10):767-775.
16. Brooks JH, Fuller CW, Kemp SP, Reddin DB. A prospective study of injuries and training amongst the England 2003 Rugby World Cup squad. Br
J Sports Med 2005;39(5):288-293.
17. Holtzhausen LJ, Schwellnus MP, Jakoet I, Pretorius AL. The incidence
and nature of injuries in South African rugby players in the rugby Super
12 competition. S Afr Med J 2006;96(12):1260-1265.
18. Best JP, McIntosh AS, Savage TN. Rugby World Cup 2003 injury surveillance project. Br J Sports Med 2005;39(11):812-817.
conclusion
This study showed that a reduction in in-season and overall training volume was associated with a slight reduction in the number of
acute injuries and in-season injury rates over the three seasons. The
prevention strategies, however, had minimal effect on overall match,
saJsM Vol 21 no. 3 2009
19. Garraway WM, Macleod DAD. Epidemiology of rugby football injuries.
Lancet 1995;345(1485):1487.
20. Gabbett TJ, Domrow N. Relationships between training load, injury, and
fitness in sub-elite collision sport athletes. J Sports Sci 2007;25(13):15071519.
21. Gabbett TJ. Reductions in pre-season training loads reduce training injury
rates in rugby league players. Br J Sports Med 2004;38(6):743-749.
101
�
 Helen Millson