Chapter 1
Adaptive traffic modelling for network anomaly
detection
Vassilios C. Moussas
Abstract With the rapid expansion of computer networks, security has become a
crucial issue, either for small home networks or large corporate intranets. A standard way to detect illegitimate use of a network is through traffic monitoring. Consistent modelling of typical network activity can help separate the normal use of the
network from an intruder activity or an unusual user activity. In this work an adaptive traffic modelling and estimation method for detecting network unusual activity,
network anomaly or intrusion is presented. The proposed method uses simple and
widely collected sets of traffic data, such as, bandwidth utilization. The advantage
of the method is that it builds the traffic patterns using data found easily by polling a
network node MIB. The method was tested using real traffic data from various network segments in our university campus. The method performed equally well either
off-line or in real-time, running at a fraction of the smallest sampling interval set
by the network monitoring programs. The implemented adaptive multi-model partitioning algorithm was able to identify successfully all typical or unusual activities
contained in the test datasets.
Key words: Traffic modelling, Fault detection, Anomaly detection, Network Simulation, Adaptive estimation, Forecasting, SARIMA models, Nonlinear time series,
State-Space models, Kalman filter, Multi-Model.
1.1 Introduction
In order to separate the normal use of a network from an intruder activity or an
unusual user activity, consistent models of typical network activity or abuse are
Vassilios C. Moussas
Laboratory of Applied Informatics, Department of Civil, Survey and Geoinformatics Engineering,
Athens Univ. of Applied Sciences (T.E.I. of Athens), GR-12210 Egaleo-Athens, Greece, e-mail:
vmouss@teiath.gr
1
�2
Vassilios C. Moussas
required. Traffic monitoring and modelling is also essential in order to determine
the network’s current state (normal or faulty) and also to predict its future trends
[9].
Intrusion Detection Systems (IDS) are being designed to protect such critical
networked systems. There are two major approaches in intrusion detection: anomaly
detection and misuse detection. Misuse detection is first recording and modeling
specific patterns of intrusions, and then, monitoring and reporting if any matches are
found. Anomaly detection, on the other hand, first records and models the normal
behavior of the network, and then, detects any variations from the normal model in
the observed data. The main advantage with anomaly intrusion is that it can detect
new forms of attacks or network misuse, as they will probably deviate from any
other normal behavior [5].
Anomaly detection systems apply various methods to model the normal behavior
of the network. Some systems utilize artificial neural networks (ANN) [4]and selforganizing maps (SOM) [26]. The NN is fed initially by normal traffic to learn
the normal conditions and then by the observed traffic to detect anomalies. Other
systems collect statistics from certain system parameters into a profile, and they
construct a distance vector for the observed traffic and the specified profile [25].
Most methods of intrusion detection are based on hand-coded rule sets or predicting commands on-line, they are laborious to build, and, they require a very large
amount of special traffic data (detailed static logs, protocols, ports, connections,
etc.) provided by hubs, routers, firewalls, hosts, and network sniffers. In addition,
most of these algorithms require that the data used for training is purely normal and
does not contain any attacks. The process of manually cleaning the data is quite
time consuming and a large set of clean data can be very expensive, although some
algorithms may tolerate mixed data [6].
1.1.1 Network monitoring
Traffic monitoring, traffic prediction and anomaly detection are crucial for today’s
networks and they all play a significant role when designing a network or network
upgrades [7, 11, 30].
When planning or designing a network, good forecasts of the network traffic
workload are required. Early detection of a traffic anomaly is also crucial when
controlling or managing LAN, MAN and WAN networks. Both, forecasts and detections can be calculated using various models of the network behaviour in combination with a corresponding simulation or identification technique [17, 21, 27].
Traditionally, network fault management emphasizes the detection and the processing of network and element failures in the form of alarms. Regarding network
fault detection, the past years have witnessed much progress in anomaly detection
in Ethernet segments [14], anomaly and performance change detection in small networks, and, proactive anomaly detection of network and service faults [8]. In the last
case, proactive anomaly detection can infer the presence of non-monitored failures
�1 Adaptive traffic modelling for network anomaly detection
3
(i.e., no MIB nor trap information access) from the monitored performance data of
the networks. In addition to the on-line anomaly detection, the same models can also
be applied either for network simulation or prediction.
1.1.2 Traffic modelling detail levels
Network model selection depends mainly on the applied technique and the available
network data. There are several types of data available to collect, when studying
a network. Almost any traffic characteristic may be measured and logged i.e., bit
or packet rate, packet size, protocols, ports, connections, addresses, server load,
applications, etc. Routers, firewalls, servers or managers (servers with agents) can
all be used for this task.
Each modelling method represents the behaviour of the network at a different
level of detail. More abstract models, based only on the overall line utilization, are
less precise, but they are also very fast and less demanding. On the other hand, more
detailed models, represent the exact packet exchange procedure in a network, but
they are very slow and resource demanding. Measuring and archiving all traffic data
at full detail for potential future use is not a regular procedure. Based on the level of
traffic detail observed, the traffic models may be divided in two main groups:
More Abstract Traffic Models: Usually most networks log only the load of their
lines and the utilization of some critical resources, while, a more detailed monitoring
is used only when a resource requires specific attention. On almost any network,
traffic rate and utilization are the only data collections that are always available
and with long history records. These data are easily taken from the router MIB or
from a server logs and they can be used to create global or aggregate traffic models
[15, 16, 31].
More Detailed Traffic Models: When more detailed models of the network behaviour are needed, special traffic data provided by agents, switches, routers, firewalls, hosts, or network sniffers must be used. Moreover, when modelling user behaviour, other types of data such as transaction duration, user habits, skills or position, may be required [13, 22].
1.2 Traffic modelling categories and uses
In [18] an effort to classify the traffic models by their detailed or abstract view of
the inherent network mechanism, resulted to three (3) major model categories:
1. Overall Utilization modelling category (OU): The most abstract models that observe only the overall utilization of network lines or components.
OU models describe the network load of each segment or component in packets
per time unit (pps) or bytes per time unit. They may also use any other character-
�4
Vassilios C. Moussas
istic (e.g. processor load) found in the MIB of a network component and captured
by a monitoring application.
The required data are easily collected from the router interface and stored in a
dedicated machine. This is done on-line without delays and it does not require
any special HW or SW capabilities. In addition, OU models have a large database
of past records waiting to be used for model training. This happens just because
most networks use these sets of data for every day monitoring and they keep them
for reference or for their network load history.
OU models take also into account the periodic nature of the network utilization,
its stochastic properties, and any known anomalies observed in the past. These
abstract models require much less processing time and can be applied on-line
on any machine, either for simulation and prediction or for anomaly detection.
Due to their abstract nature, these models offer an on-line first warning for any
network anomaly, even if they cannot be more precise about the type or cause of
the problem.
2. Packet Pattern modelling category (PP): The most detailed models that describe
the network traffic at packet level in full detail.
PP models attempt to describe the network traffic at packet or signalling level.
Each action is analysed in full detail and the exact packet type, size and exchange
procedure is defined. PP models may detect suspicious packets or other port pattern anomalies from e.g., their TCP flag combinations, timing, or matching to a
certain pattern library. Typical examples in this category are the packet spoofing attacks, such as, SYN-flood, Smurf, TCP spoofing, Bounce Scan, Zombie
control, etc. Most IDS or anomaly detection systems in this category belong in
the ’signature analysis’ class where, detailed descriptions of known attacks or
anomalies are encoded e.g., in the form of rules and stored for comparison and
reference.
Data at this level are usually collected by a packet capturing tool. Packet capturing is a very intensive and hardware demanding task. The network adapter is
usually working in promiscuous mode capturing all network traffic and storing
it in long files for further analysis. Packet analysis and statistics is then done
off-line by other programs. Statistics and/or patterns for typical packets are often
stored in a pattern library and subsequently used to detect anomalies in the same
type of traffic.
Network traffic analysis or simulation using very detailed models can be slow and
resource demanding. The processed or simulated time is often a small fraction of
the physical time and therefore it is difficult to apply the models on-line for long
periods.
PP models can identify an anomaly with high accuracy. They are able to distinguish between different types of network misuse or attacks and trigger the correct
reaction. Due to their complexity, they are usually activated for detailed detection
after a global anomaly detection by another less detailed model (TP or OU).
3. Task Pattern modelling category (TP): Less detailed models that distinguish the
various categories of network traffic e.g., by application, protocol or user behaviour.
�1 Adaptive traffic modelling for network anomaly detection
5
TP models attempt to describe the network traffic per service, protocol, or user
task. Each type of traffic is characterised mainly by the protocol used, the originating service, the network path between client and server and the task objective
or duration. Most IDS or anomaly detection systems in this category belong in
the ’statistical systems’ class that intend to ’learn’ normal behaviour from the
data, and then issue alerts for suspected anomalies.
Data for this category of models are provided by the various application logs,
the network component MIBs, the firewall logs, or by specialized applications
running on a host or server, possibly with agents on other machines. The network
traffic data collected report, usually, the total number of packets or bytes per time
unit, the average size, or statistics on the size, the frequency, headers, origin and
other characteristics of the observed messages.
In order to detect network anomalies, a library of normal or expected behaviour
is created and all newer arrivals are compared to the stored patterns and classified
accordingly. This is repeated for any application under consideration and for any
type of service or protocol.
Although it is possible to observe and analyse on line at this level of network
traffic, it is still impossible to store long records in such detail due to space and
time limitations. Therefore, it is difficult to find sufficient past records in order
to create adequate models for any type of traffic, unless there has been a specific
preparation for such methods.
4. Combined PP and TP models: It it not a model category itself but it is mentioned
here as, many applications used for network simulation combine both PP and TP
models.
Applications used for network simulation may combine PP and TP models. The
network load is modelled as a set of tasks (TC) producing packets that travel
across lines and nodes according to the network protocols used (PP). Such applications require a model for each node of the network and a model for each
application served by the network. They superimpose all generated traffic (user
tasks, applications, etc.) on the underlying network model (lines, nodes, servers,
etc.), and take into account the network type properties and limitations (congestion, retransmissions, etc.) thus producing a simulated network response. The
accuracy of these simulations depends on the accuracy of the network component
models and application models introduces by the user.
Combined PP-TP models have higher computational requirements, both in processing power and storage and they are running much slower than the real world
events. The simulated time is only a fraction of the real time passed and often a
computer cluster is required just to keep real time below 1000x the simulation
physical time. Consequently, these combined models, although they are a good
technique for simulation and prediction, they are not always suitable for on-line
detection of network anomalies.
Each of the above model categories (OU, PP and TP) represents the network
behaviour from a different point of view, and requires different types of network
data. The selection of a model category should be based on the available resources,
�6
Vassilios C. Moussas
the available data sets and the desired results of the modelling procedure i.e., the use
case where it is applied.
In this work we distinguish two major uses where the above models can be applied: Simulation and Prediction, or, Fault and Anomaly Detection. In both cases,
the models need some training from past data and known cases. The final model selection depends on the desired outcome, the available infrastructure, the knowledge
base of past records, and the desired level of detail. Each of the three categories
(OU, PP and TP) may offer different pros and cons per use case:
• Using the traffic models for simulation and prediction: For simulation and prediction purposes all three model categories can be applied, provided that enough
past data are available for training. More precisely:
– OU models require only the default data stored in component MIBs. These
data are available on almost any network. If there is no other monitoring tool
applied on a network, the OU model is the only option. The almost certain existence of past utilization data, guaranties that the training of the model will be
mostly accurate. An OU model should also be used when general utilization
forecasts are required, using periodic models that incorporate current trends
and future uncertainties.
– PP models require detailed records from packet capturing applications and
precise knowledge of the packet exchange procedures of the network. In addition, there must be plenty of real time available in order to run the simulations
for a sufficient simulated time. If real time is of essence, a faster and less
detailed model should be considered.
– TP models require data from different sources such as server application logs,
manager-agent monitoring tools and component MIBs. Statistical analysis of
the past data provides the TP models with probabilistic information and distributions that will used during data regeneration and prediction. The availability
of these data will eventually define the exact form and the applicability of the
model.
• Using the traffic models for fault or anomaly detection: For fault or anomaly
detection purposes all three model categories can also be applied, provided that
the required past and present data are available. More precisely:
– OU models can be applied easily on any network and they are reporting the
presence of a fault or anomaly rather than its nature or source. They are abstract but also much faster and less demanding. Their main advantage is that
there is always a past utilization record available to train them, and, in combination with a good identification technique they perform quit satisfactorily.
OU models combined with Seasonal ARMA or Multi-model techniques can
detect successfully known (trained) situations and also isolate any other detected faults or anomalies.
– PP models are not quite suitable for 24/7 all purpose anomaly detection. They
should be used at a second stage for finer more detailed identification of an
�1 Adaptive traffic modelling for network anomaly detection
7
attack or a fault cause. These models are usually applied off line to postprocess and analyse the collected data. PP models can be used on-line only
when they focus to a narrow subset of the overall traffic and usually for a
limited time period.
– TP models can be more suitable than PP models for anomaly or fault detection. When past data are available, TP models with the necessary statistical
information for the various applications or transactions may be calculated and
stored. Libraries or knowledge bases with such models are then used by the
detection application as a reference for the classification of the incoming traffic. This category includes a wide range of models including, rule models,
statistical models, lookup tables, neural networks, stochastic and multiplemodels, etc. TP detection models may vary from more detailed (closer to PP)
to less detailed (closer to OU). When detail is increased, speed and ease of
implementation is decreased, and vice-versa.
1.3 Network traffic model identification
In this section, the components of the adaptive traffic modelling and estimation
method, for network unusual activity and intrusion detection, are presented. The
first aim of the proposed method is to use very common, simple and widely found
traffic datasets, such as overall bandwidth utilization data (OU). Bandwidth use is
the most common set of network traffic data; almost all network administrators monitor periodically and store the bandwidth utilization for their servers, routers, LAN
users, or network connections. The second aim of the proposed method is to take
advantage of the time-series techniques [3] that have been applied already successfully in almost any research field, such as: economy, signal processing, computer
networks [15, 32], wireless communication [27], BW management [24], or even,
structural safety [29], and, today it is a well established tool. It is also clear that the
time-series models perform satisfactorily under conditions or circumstances similar
to those of the training data set. In our case this leads to the creation of many different models, each one fitting best a different pattern of traffic flow [28]. Normal
traffic, congestion, weekdays, weekends, works or accidents, they all require different modeling schemes. As a result, there are many models available to describe the
various status of traffic flow, and we could have better forecasting results if we are
able to combine them optimally under one global method.
The proposed method is using past traffic data to learn and model (by ARMA,
State-Space, or other models) the normal or typical periodic behaviour of a network
connection. In addition, any known faulty, abuse or anomaly state can be modelled
and stored in this continuously updated model base.
An adaptive identification mechanism based on a powerful Multi-Model Partitioning Algorithm, (MMPA), proposed by Lainiotis [12] known for its stability and
well established in identification and modelling, is then applying the collected OU
data to the candidate traffic models. If the traffic pattern does not match an expected
�8
Vassilios C. Moussas
behaviour of the network connection, an anomaly is detected and furthermore, if the
traffic pattern matches a known anomaly case, the type of anomaly can be identified.
In the following sections, we first present some ARMA and State-Space models
of network traffic that can be used by MMPA, then we present the multi-model partitioning algorithm (MMPA), and finally, we present detection results from MMPA,
using real datasets collected at the campus network of the Tech. Educ. Inst. (TEI) of
Athens.
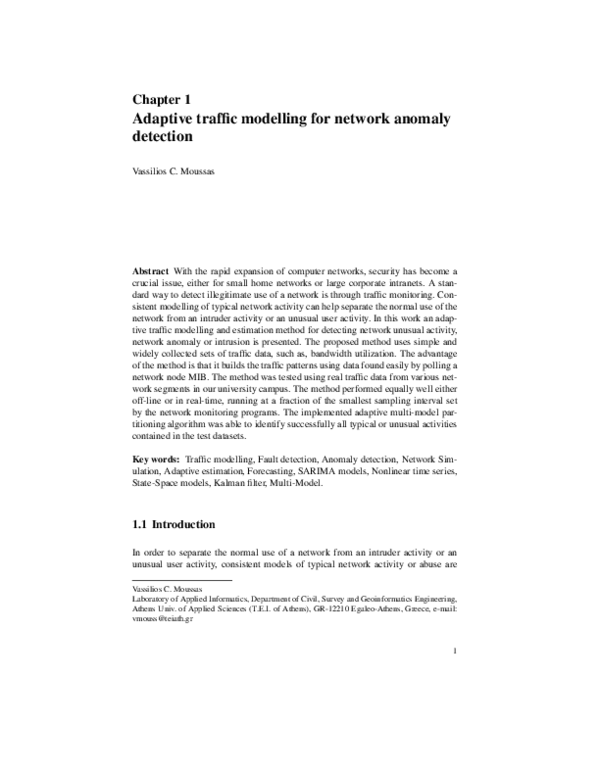
Fig. 1.1 Average utilization data from the TEI of Athens campus network (weekly data): a) the
campus Internet connection, b) a educational premisses backbone. c) an administration offices
VLAN. d) the remote users connections.
1.3.1 S-ARIMA traffic modelling
As shown in figure 1.1, the recorded OU network traffic and bandwidth utilization
demonstrate a remarkable periodicity, daily, weekly and also yearly. One method
to model such ”seasonal” behavior is to use a set of Seasonal ARIMA (SARIMA)
time-series models. In an earlier work [16], the network bandwidth utilization of
the TEI of Athens campus network was successfully modelled using such SARIMA
models. In the this contribution the same method is applied in order to model the
periodic behaviour observed in the daily and weekly repeated OU patterns.
The principle underlying this methodology is that traffic data occur in a form of
a time series where observations are dependent. This dependency is not necessarily
limited to one step (Markov assumption) but it can extend to many steps in the past
of the series. Thus in general the current value Xt (= network traffic at time t) of
�1 Adaptive traffic modelling for network anomaly detection
9
the process X can be expressed as a finite linear aggregate of previous values of the
process and the present and previous values of a random input u, i.e. [3]:
Xt = φ1 Xt−1 + φ2 Xt−2 + · · · + φ p Xt−p + ut − θ1 ut−1 − θ2 ut−2 − · · · − θq ut−q (1.1)
In equation 1.1, Xt and ut represent respectively the traffic volume and the random input at equally spaced time intervals (t, t − 1, t − 2, . . . ). The random input
u constitutes a white noise stochastic process, whose distribution is assumed to be
Gaussian with zero mean and standard deviation σu .
Equation 1.1 can be economically rewritten as 1.4 by defining the autoregressive (AR) operator of order p and the moving-average (MA) operator of order q by
equation 1.2 and equation 1.3 respectively:
ϕ p (B) = 1 − φ1 B − φ2 B2 − · · · − φ p B p
(1.2)
ϑq (B) = 1 − θ1 B − θ2 B2 − · · · − θq Bq
(1.3)
ϕ p (B)Xt = ϑq (B)ut
(1.4)
where, B stands for the backward shift operator defined as Bs Xt = Xt−s . Another
closely related operator is the backward difference operator ∇ defined as ∇Xt =
s D
Xt − Xt−1 and thus, ∇ = 1 − B , ∇d = (1 − B)d and ∇D
s = (1 − B ) .
The Auto-Regressive Moving-Average model (ARMA) as formulated above is
limited to modelling phenomena exhibiting stationarity. Clearly this is not the case
for the network traffic data of figure 1.1. It is possible though that the processes
still possess homogeneity of some kind. It is usually the case that the d th difference
of the original time series exhibits stationary characteristics. The previous ARMA
model could then be applied to the new stationary process ∇X and equation 1.4 will
correspondingly read
ϕ p (B)∇d Xt = ϑq (B)ut
(1.5)
This equation represents the general model used in this work. Clearly, it can
describe stationary (d = 0) or non-stationary (d 6= 0), purely autoregressive (q = 0)
or purely moving-average (p = 0) processes. It is called Auto-Regressive Integrated
Moving-Average (ARIMA) process of order (p, d, q). It employs p + q + 1 unknown
parameters φ1 , . . . , φ p ; θ1 , . . . , θ p ; u, which will have to be estimated from the data.
Starting from ARIMA model of equation 1.5 it can be deducted [3] that a seasonal series can be mathematically represented by the general multiplicative model
often called Seasonal ARIMA or SARIMA of order (p, d, q)x(P, D, Q)s :
s
ϕ p (B)ΦP (Bs )∇d ∇D
s Xt = ϑq (B)ΘQ (B )ut
(1.6)
The general scheme for determining these traffic models includes three phases,
which are:
�10
Vassilios C. Moussas
1. Model identification, where the values of the model order parameters p, d, q,
P, D, Q and s are defined.
2. Parameter estimation, where all φ and θ coefficients in ϕ p , ΦP , ϑq ,ΘQ are determined in some optimal way, and,
3. Diagnostic checking for verifying the model’s performance over the collected
data.
As is stated however in [3], there is no uniqueness in the ARIMA models for
a particular physical problem. In the selection procedure, among potentially good
candidates one is aided by certain criteria. Although more advanced methods for
model selection have been proposed [10, 23], the most common and classic criteria
remain the Akaikes Information Criterion (AIC) and the Schwartzs Bayesian Information Criterion (SBC or BIC) [1, 3]. Proper choice of the parameters at phase 1
calls for a minimization of the AIC and SBC.
Fig. 1.2 TEI campus internet connection OU: Four months of traffic data, the single and seasonal
differences and their ACFs, demonstrating the 24h and 168h periodicity.
By analysing our campus OU traffic data from different subnets and VLANs,
recorded hourly for several months, we verified the periodicity of the data. As shown
in figure 1.2 by taking the autocorrelation function (ACF), two major seasonal components were identified, a daily and a weekly one, every 24 hours and 168 hours
respectively. In this weekly repeated pattern of OU, the observed daily network behavior is then classified in two categories: a) the OU traffic during normal working
days, and b) the OU traffic during weekends and holidays.
After several tests on datasets collected at various time intervals (5-30min), a
common S-ARIMA model was identified that can satisfy both categories. Provided
that its past period data belong to the same category with the forecasting period, the
Seasonal ARIMA (1,1,1)x(0,1,1)48 model predicts satisfactorily the future network
traffic, as shown in figure 1.3.
�1 Adaptive traffic modelling for network anomaly detection
11
Fig. 1.3 Daily traffic prediction using the Seasonal ARIMA (1,1,1)x(0,1,1)48 model: (Left) working day traffic, (Right) weekend or holiday traffic. Prediction starts at step 145. The previous period
(steps 97 to 144) is replaced by the average of all past periods (days) of the same type (weekends
or working days).
Equation 1.7 represents the above SARIMA model mathematically. The autoregressive (AR) and moving-average (MA) parameters of the model are: φ1 =
0.413027, θ1 = 0.942437, Θ1 = 0.959323.
�
(1.7)
φ (B)∇1 ∇148 Xk = θ (B)Θ B48 uk
�
where, φ (B) = 1 − φ1 B, θ (B) = 1 − θ1 B, Θ B48 = 1 −Θ1 B48 , and the analytic
expression for model equation 1.7 will be:
�
�
(1 − φ1 B)(1 − B) 1 − B48 Xk = (1 − θ1 B) 1 −Θ1 B48 uk ⇒
Xk − (1 + φ1 )Xk−1 + φ1 Xk−2 − Xk−48 + (1 + φ1 )Xk−49 − φ1 Xk−50 =
= uk − θ1 uk−1 −Θ1 uk−48 + θ1Θ1 uk−49
(1.8)
1.3.2 State-Space traffic modelling
The State-Space models are required in order to be compatible with the Multi-Model
Partitioning Algorithm (MMPA) and its sub-filters, such as, the Kalman or Extended
Kalman algorithms. Many physical processes can be described using a state space
model. In addition, ARMA processes can be rewritten as State-Space process. A
typical linear State-Space model is described by the following set of equations:
xk+1 = F · xk + G · wk ,
zk = H · xk + vk
(1.9)
�12
Vassilios C. Moussas
In the more general case of a non-linear model with parametric uncertainty the
state equations become:
xk+1 = f [k, xk ; n] + g[k, xk ] · wk ,
zk = h[k, xk ; n] + vk
(1.10)
In order to make the time-series traffic models compatible to the notation of the
MMPA and Kalman algorithms [2], model 1.8 must be rewritten in a State-Space
format. Based on the innovations representation of an ARMA process, any ARMA
model of the type: zk + a1 zk−1 + · · · + an zk−n = b0 uk + · · · + bm uk−m , can be written
in the following linear State-Space form [2]:
b1 − a1 b0
−a1 I · · · 0 0
b2 − a2 b0
.
. .
−a2 .. . . . .. ..
..
.
xk +
..
xk+1 =
uk ,
...
.
.
.
.
I
0
.
.
(1.11)
.
−an−1 0 . . . 0 I
..
−an 0 . . . 0 0
.
�
zk = I
0
...
�
0 0 xk + b0 uk
By substituting the model coefficients of equation 1.8 to the State-Space representation 1.11 the SARIMA model can be directly implemented by a typical StateSpace algorithm such as the Kalman filter. The corresponding (non-zero) coefficients are:
a0 = 1, a1 = −(1 + φ1 ), a2 = φ1 ,
a48 = −1, a49 = (1 + φ1 ), a50 = −φ1
b0 = 1, b1 = −θ1 , b48 = −Θ1 , b49 = θ1Θ1
(1.12)
In addition, State-Space models can also be used to describe any non-periodic
OU traffic patterns. There are numerous traffic conditions, such as line failures or
network misuse, that can not be modelled by an ARMA process. These events are
not periodic, they occur at random instances and therefore, the above seasonal models are not very helpful.
Typical cases can be: a sudden rise (peak) in traffic (due of an attack or misuse), a zero traffic rate (due to a failure), a very constant (usually high) traffic (due
to congestion or a DoS attack), etc. Bellow we present the State-Space equations
corresponding to each of these unusual cases:
Traffic Rise x10 : zk = xk + vk , xk+1 = 10 · xk
Line Failure :
zk = xk + vk , xk+1 = xk , (x0 = 0)
Line Saturation : zk = xk + vk , xk+1 = xk , (x0 = maxBW )
(1.13)
The traffic models described above (ARIMA or State-Space) are the adaptive
method’s candidates that will be matched, each one to a Kalman filter, and subse-
�1 Adaptive traffic modelling for network anomaly detection
13
quently, introduced to the MMPA algorithm in order to detect adaptively the correct
model of network utilization. A sample containing four various modelled traffic sequences is shown in figure 1.4.
Fig. 1.4 Four samples of traffic sequences representing different traffic conditions and modelled
using equations 1.11 and 1.13.
1.3.3 The multi-model partitioning algorithm (MMPA)
The adaptive method applied here is based on the Multi-Model Partitioning Algorithm originally presented by D. G. Lainiotis [2, 12]. MMPA consists of a parallel
bank of N sub-filters (i.e., Kalman, Extended Kalman, etc.), operating concurrently
on the measurements (figure 1.5).
Each sub-filter is tuned to a State-Space modelling a different traffic behavior
and described by equations 1.11 and 1.13. At time step k, first, each filter processes
the measurement zk and produces a state estimate x(k/k; n) of of the state xk , conditioned on the hypothesis that the corresponding model is the correct one, and then,
the MMPA uses the output of all elemental filters to select the most likely model as
the one that maximizes the a-posteriori probability density p(n/k). This density can
be calculated recursively by equation 1.14 [12]:
p(n/k) =
L(k/k; n)
p(n/k − 1)
N
(1.14)
∑ L(k/k; i)p(i/k − 1)
i=1
where:
1
1
2 P−1 (k/k−1;n)
z̃
L(k/k; n) = |Pz̃ (k/k − 1; n)|− 2 e− 2 kz̃(k/k−1;n)k
(1.15)
�14
Vassilios C. Moussas
Fig. 1.5 Structure of the Multi-Model Partitioning Algorithm for Network Anomaly Detection.
and where z̃(k/k − 1; n) and Pz̃ (k/k − 1; n) are the conditional innovations and
corresponding covariance matrices produced by the Kalman filter corresponding to
model n. The overall MMPA state estimation is then calculated by:
N
x̂(k/k) = ∑ x̂(k/k; n)p(n/k)
(1.16)
i=1
and
i
N h
P(k/k) = ∑ P(k/k; n) + kx̂(k/k) − x̂(k/k; n)k2 p(n/k)
(1.17)
i=1
At each iteration, the MMPA algorithm identifies the model that corresponds
to the maximum a posteriori probability as the correct one. This probability tends
(asymptotically) to one, while the remaining probabilities tend to zero. If the model
changes, the algorithm senses the variation and increases the corresponding a posteriori probability, while decreasing the remaining ones. Thus the algorithm is adaptive in the sense of being able to track model changes in real time. This procedure
incorporates the algorithm’s intelligence.
The above presented multi-model partitioning algorithm (MMPA) possess several interesting properties:
• Its structure is a natural parallel distributed processing architecture and hence it
is more suitable to current computers clusters.
• By breaking a large and/or non-linear model to smaller sub-cases the algorithm
has a much smaller dimensionality and hence much less architectural complexity.
• Although computationally intensive, it works faster due to parallelism and hence
it is much more appropriate for real-time applications.
• It is more robust than any single filter as it is capable to isolate any diverging
sub-filter. Numerous applications and simulations in the literature also show this.
• The algorithm is well structured and modular and it is easy to implement and
modify on any standard programming environment (e.g. MATLAB).
�1 Adaptive traffic modelling for network anomaly detection
15
1.4 Detection results using real traffic data
In order to test the efficiency of the MMPA method, we use real data from the TEI of
Athens campus network. The test dataset was created from real cases and, as shown
in figure 1.6, the dataset represents a week of traffic i.e. five working days and a
weekend.
Our test traffic data were collected from our router’s standard MIB and/or the
server’s typical logs. In order to avoid any device or system specific problem the data
were taken via a monitoring tool. The earlier Multi Router Traffic Grapher (MRTG)
tool [19] and its current version Round Robin Database Tool (RRDtool) [20] have
been applied for over a decade in our campus network for continuous monitoring
and utilization data collection. These tools are computationally efficient, widely applied, and easy to implement software packages for collecting and/or monitoring
utilization data from any router or server MIB. They produce standard log files with
current and past data that can be downloaded and saved by any browser or simple GET commands. Our adaptive method first reads these standard log files and
then performs the model identification steps. This is done repeatedly every 5 min
which is the default MIB sampling period or even faster, provided that the network
responses arrive in time.
Fig. 1.6 Test dataset (upper) for one week (S-M-T-W-T-F-S) of data containing peaks and failures,
and, (lower) the MMPA’s successful detection of the pattern changes and traffic anomalies in the
test dataset.
In order to test the MMPA performance, we introduced in our dataset link failures
and sudden high traffic peaks. The MMPA was equipped with four (4) Kalman sub-
�16
Vassilios C. Moussas
filters that were tuned to the four types of traffic we are investigating as already
shown in figure 1.4.
The aim of MMPA is to select the correct model n among the N various ”candidates”. By identifying the correct model, MMPA detects the current type of traffic and, consequently, if this matches the normal behaviour or a potential traffic
anomaly. In the our example the elemental filters are based on the family of models
described by equations 1.11-1.13.
The a posteriori probability density p(n/k) of each model is used to identify the
type of the observed traffic. The model that maximizes this quantity is selected. If
the selected model is also the correct day pattern of the current day, then we have
normal traffic conditions; otherwise, an anomaly is detected.
As shown in figure 1.6, the proposed method detects successfully both, the
changes from weekend to working days and vice-versa. On Saturday at 8:00 offices
remain closed and the traffic pattern changes and matches the weekend pattern. The
MMPA detects the difference and the probability of the weekend model (dashed
line) is increased versus 1, while the probability of the working day model (dotted
line) falls versus 0. After the weekend, on Monday at 8:00 employees start using the
network and the usage pattern changes back and matches the working day model.
The method detects equally well, traffic peaks (misuse) and traffic zeros (i.e. link
failures).
In addition to the successful detection, the adaptive algorithm also completes the
detection in a matter of seconds, thus, permitting us to increase the sampling rate
of the data collection and the on-line response of the system. The default sampling
rate to collect measurements from the routers’ MIB is usually set to 5 minutes. The
proposed method is so fast that does not pose any restrictions on the sampling rate.
On the contrary it is the network nodes that may not be able to reply in time if an
increased sampling rate is used.
Further work that is currently in progress, based on the above results, investigates: monitoring and modelling of other MIB quantities related to network faults
or misuse, further increase of the sampling rate to obtain faster reaction times, modelling of end-user behaviour, and, enriching the MMPA model bank with of more
patterns of unusual activities or network problems.
Note that, although in the presented work the elemental Kalman filters were tuned
to the State-Space models describing the various traffic patterns, as required by the
Kalman filter structure, this is not obligatory for the MMPA. MMPA can use any
type of sub-filter and its corresponding model (e.g. Artificial Neural Network), provided that it is accompanied by the corresponding estimator/predictor component,
that will interface the algorithm and handle the sub-filter inputs and results.
1.5 Conclusions
In this paper an adaptive multi-model method is presented for modelling network
traffic flow and detecting any network unusual activity or misuse. The method is
�1 Adaptive traffic modelling for network anomaly detection
17
based on standard bandwidth utilization data found in the MIB and does not require specialised data collection tools. The proposed method uses the past traffic
data to model all normal periodic behaviours of a network connection. ARMA and
State-Space models are mainly used for traffic pattern modelling without excluding
other models such as neural nets. An adaptive Multi-Model Partitioning Algorithm
processes the collected traffic data through a set of filters, each matching a traffic
pattern. The method was tested using real datasets from the campus network and
it detected correctly all pattern changes, failures or unusual activities contained in
the test datasets. The method is also very fast and it can perform equally well in
real-time even in a fraction of the default 5 min sampling interval that was used to
poll the devices and the campus network segments.
References
1. Akaike, H.: Fitting Autoregressive models for Prediction. Ann. Inst. Sat. Math., 21, 243–247
(1969)
2. Anderson, B.D.O., Moore, J.B.: Optimal Filtering. Prentice Hall, New Jersey (1979)
3. Box, G., Jenkins, G.M., Reinsel, G.: Time Series Analysis: Forecasting and Control. 3rd ed.
Prentice Hall (1994)
4. Debar, H., Becker, M., Siboni, D:. A Neural Network Component for an Intrusion Detection
System. In: IEEE Computer Society Symposium on Research in Security and Privacy, Oakland, CA (1992)
5. Denning, D.E.: An Intrusion-Detection Model. IEEE Trans Software Engng, 13, 222-232
(1987)
6. Eskin, E.: Anomaly detection over noisy data using learned probability distributions. In: ICML
2000, Menlo Park, CA, AAAI Press (2000)
7. Halsall, F.: Data Communications, Computer Networks and Open Systems. Addison-Wesley
(1996)
8. Hood, C., Ji, C.: Proactive network fault detection. IEEE Trans. Reliability, vol. 46, p. 333
(1997)
9. Katris, C., Daskalaki S.: Comparing Forecasting Approaches for Internet Traffic. Expert Systems with Applications 42(21), 8172–8183 (2015)
10. Katsikas, S.K., Likothanassis, S.D., Lainiotis, D.G.: AR model identification with unknown
process order. IEEE Trans. Acoust. Speech and Signal Proc., 38(5), 872–876 (1990)
11. Keshav, S.: An Engineering Approach to Computer Networking: ATM, Internet and Telephone
Network. Addison-Wesley (1997)
12. Lainiotis, D.G.: Partitioning: A Unifying Framework for Adaptive Systems, I: Estimation.
Proc. IEEE, 64, 1126–1142 (1976).
13. Lawrence, L.H., Cavuto, D.J., Papavassiliou, S., Zawadzki, A.G.: Adaptive and Automated
Detection of Service Anomalies in Transaction-Oriented WAN’s: Network Analysis, Algorithms, Implementation, and Deployment. IEEE J Sel. Areas in Comm., 18(5), 744–757 (2000)
14. Maxion, R., Feather, F.E.: A case study of Ethernet anomalies in a distributed computing
environment. IEEE Trans. Reliability, vol. 39, Oct. 1990.
15. Moussas, V.C., Daglis, M., Kolega, E.: Network Traffic Modeling and Prediction using Multiplicative Seasonal ARIMA Models. In: 1st Intl. Conf. EPSMSO, D.T. Tsahalis (ed), Athens,
6-9 July 2005
16. Moussas, V.C., Pappas, Sp.St.: Adaptive Network Anomaly Detection Using Bandwidth Utilization Data. In: 1st Intl. Conf. EPSMSO, D.T. Tsahalis (ed), Athens, Patras Univ. Press
(2005)
�18
Vassilios C. Moussas
17. Moussas, V.C.: Network Traffic Flow Prediction using Multi-Model Partitioning Algorithms.
In: 2nd Intl. Conf. SCCE, D.T. Tsahalis (ed), Athens, Patras Univ. Press (2006)
18. Moussas, V.C.: Traffic and user behaviour model classification for network simulation and
anomaly detection. In: 2nd Intl. Conf. EPSMSO, D.T. Tsahalis (ed), Athens, Patras Univ.
Press (2007)
19. Oetiker, T.: Multi Router Traffic Grapher (MRTG) tool - Software Package and Manuals. At:
oss.oetiker.ch/mrtg (2005)
20. Oetikerr, T.: Round Robin Database tool (RRDtool) - Software Package and Manuals. At:
oss.oetiker.ch/rrdtool (2016)
21. Papagiannaki, K., Taft, N., Zhang, Z., Diot, C.: Long-Term Forecasting of Internet Backbone
Traffic: Observations and Initial Models. In: IEEE Infocom (2003).
22. Papazoglou, P.M., Karras, D.A., Papademetriou, R.C.: High Performance Novel Hybrid DCA
algorithms for efficient Channel Allocation in Cellular Communications modelled and evaluated through a Java Simulation System. WSEAS Trans. Comm., 5(11), 2078–2085 (2006)
23. Pappas, S.SP., Katsikas, S.K., Moussas, V.C.: MV-ARMA Order Estimation via Multi-Model
Partition Theory. In: 2nd Intl Conf. EPSMSO, D.T. Tsahalis (ed), Athens, Vol.II, pp. 688–698,
Patras Univ. Press (2007)
24. Permanasari, A.E., Hidayah, I., Bustoni, I.A.: Forecasting Model for Hotspot Bandwidth Management at Department of Electrical Engineering and Information Technology UGM. Int. J
Applied Mathematics and Statistics 53(4), 227 (2015)
25. Porras, P., Neumann, P.: Emerald: Event monitoring enabling responses to anomalous live disturbances. Proc 20th National Information Systems Security Conference, Baltimore, Maryland
(1997)
26. Rhodes, B., Mahafey, J., Cannady, J.: Multiple Self-Organizing Maps for Intrusion Detection.
In: Proc NISSC 2000 Conference (2000)
27. Shu, Y., Yu, M., Liu, J., Yang, O.W.W.: Wireless Traffic Modeling and Prediction Using Seasonal ARIMA Models. In: IEEE Intl. Conf. Communication May 2003, ICC03 vol.3 (2003)
28. Smith, L.B.: Comparison of parametric and nonparametric models for traffic flow forecasting.
Transportation Research Part C, 10 2002.
29. Solomos, G.P., Moussas, V.C.: A Time Series Approach to Fatigue Crack Propagation. Structural Safety, 9, 211–226 (1991)
30. Tanenbaum, A.S.: Computer Networks. Prentice-Hall (1996)
31. Thottan, M., Ji, C.: Anomaly Detection in IP Networks. IEEE Trans. Signal Proc., 51(8),
2191–2204 (2003)
32. You, C., Chandra, K.: Time Series Models for Internet Data Traffic. In: 24th Conf. on Local
Computer Networks, LCN-99 (1999)
�
 Vassilios Moussas