J Soils Sediments (2011) 11:679–689
DOI 10.1007/s11368-011-0345-4
SEDIMENTS, SEC 2 • PHYSICAL AND BIOGEOCHEMICAL PROCESSES • RESEARCH ARTICLE
Erosion characteristics and floc strength of Athabasca River
cohesive sediments: towards managing sediment-related issues
Juan Garcia-Aragon & Ian G. Droppo &
B. G. Krishnappan & Brian Trapp & Christina Jaskot
Received: 15 September 2010 / Accepted: 25 February 2011 / Published online: 23 March 2011
# Her Majesty the Queen in Right of Canada 2011
Abstract
Purpose This research aims to investigate: (1) the evolutional sequence of erosion of cohesive sediments entering
the Athabasca River, (2) the influence of consolidation/
biostabilization time on bed sediment stability, and (3) the
implication of these results on contaminant transport within
the Athabasca River.
Materials and methods A 5-m annular flume was used to
generate bed shear to assess cohesive sediment dynamics
for eroded beds with consolidation/biostabilization periods
(CBs) of 1, 3, and 7 days. Additional laser particle sizing,
image analysis, densitometry, and microbial analysis were
employed to further the analysis with respect to bed erosion
and eroded floc characteristics.
Results and discussion The critical bed shear stress for
erosion increased from 0.16 (1-day CB) to 0.26 Pa (7-day
CB) with an inverse relationship observed for both
suspended sediment concentration and erosion rate with
respect to CBs. The 7-day CB yielded the largest eroded
flocs that initially have high organic content but were
quickly broken up with increasing shear. The strongest
eroded floc population occurred for the 3-day CB. Eroded
flocs were found to be of an open matrix with high water
content and low density. Flocs contained a mixture of clay
and silt particles, microbes, algae, diatoms, and secreted
extracellular polymeric substances (EPS). Counts of bacteResponsible editor: Sabine Ulrike Gerbersdorf
J. Garcia-Aragon
Centro Interamericano de Recursos del Agua, FI-UAEM,
Toluca, Mexico
I. G. Droppo (*) : B. G. Krishnappan : B. Trapp : C. Jaskot
Environment Canada, CCIW-Burlington,
Burlington, ON L7R 4A6, Canada
e-mail: ian.droppo@ec.gc.ca
ria were observed to decrease with CBs while an increase in
the algal community is suggested with time.
Conclusions Consolidation was believed to have limited
effect on erosion while biostabilization was the main
controlling factor. Increasing biostabilization with time
resulted in a more stable surficial layer with a reduced
erosion rate relative to less biostabilized beds. The highly
biostabilized bed (7-day CB), however, yielded the largest
flocs which broke up easily compared to those eroded from
1- and 3-day CBs. It is believed that the EPS produced by
the sediment biological community is the main component
of the bed and flocs that is responsible for the observed
stability results.
Keywords Athabasca River . Cohesive sediments . EPS .
Erosion . Floc strength . Microbes . Rotating annular flume .
SFGL
1 Introduction
Cohesive sediments can play an important physical,
chemical, and biological role in regulating river ecosystem
quality. As many pollutants, including polycyclic aromatic
hydrocarbons (PAHs), can be highly associated with the
cohesive sediment fraction (<63 μm) (Ghosh et al. 2000;
Maruya et al. 1996), the sediment dynamics (erosion,
transport, and deposition) within the Athabasca River,
Canada will strongly influence the river’s contaminant
dynamics (Stone et al. 2008). Of particular relevance to the
Athabasca River, are concerns about the anthropogenic and
natural PAHs (Headley et al. 2001) derived from tar sands
exploitation or natural sources within the basin. Often,
PAHs bound to cohesive sediments can be highly bioavailable (Ghosh et al. 2000), necessitating the need to gain a
680
better understanding of the system’s sediment dynamics for
risk and impact assessment.
Typical of many river systems is a structurally unique
surficial layer of sediment called the surface fine-grained
lamina (SFGL) or surface floc layer (Droppo et al. 2001;
Droppo and Stone 1994; Lambert and Walling 1988). This
layer is often transient and of a low density and high water
content which blankets over the existing bed between
erosion events. Much of the SFGL is formed by the
deposition of particles in the flocculated state (Droppo and
Amos 2001) which are highly biological in composition
(Gerbersdorf et al. 2007). The SFGL and any associated
contaminants, depending on the time between erosion
events, may be incorporated into the underlying sediment
through self-weighted consolidation (Teisson et al. 1993)
and biostabilization (Gerbersdorf et al. 2009).
It is this structural difference within bed sediments that
will have a strong influence on how they erode and, as
such, on the amount of sediments and contaminants
mobilized and transported down the river. Typically, the
SFGL will erode at a bed shear stress substantially lower
than the underlying sediment (Droppo 2009). The initial
erosion of the SFGL has been termed Type Ia erosion,
while the higher shear required to initiate the erosion of
deeper more consolidated sediment is referred to as Type Ib
erosion. Type Ia has been called surface erosion and is
associated with the release of flocs, while Type Ib has been
referred to as mass or bulk erosion and is characterized by
the release of aggregates (Amos et al. 2003, 2004). Both
types of erosion have been shown to be highly influenced
by the degree of biofilm development (biostabilization)
with substantially more energy required to erode microbial
mediated sediment than purely mineral sediment (Gerbersdorf
et al. 2008; Krumbein et al. 1994). Regardless of the type of
erosion, PAH-loaded sediments may be moved in a transient
fashion of successive erosion and deposition episodes in
association with storm events. The fate of the eroded
sediment and contaminants will be dictated by their
downward flux which will be controlled by both fluid shear
and floc structure/architecture (Liss et al. 1996). Therefore,
the structure and composition of eroded flocs and their
interaction with fluid shear during transport is an important
issue to understand, and this is often overlooked in many
studies of sediment erosion, transport, and fate (Droppo
2004). The transient movement of sediments may have
detrimental effects on both the river ecosystem and, more
specifically for the Athabasca River, on the downstream
receiving Lake Athabasca delta.
In this study, a laboratory 5-m annular flume was used to
assess the stability of recently deposited cohesive sediment
collected from the Muskeg River at the confluence with the
Athabasca River near Fort McMurray, Alberta, Canada.
Three experimental runs were performed on the sediment
J Soils Sediments (2011) 11:679–689
with increasing consolidation/biostabilization periods (1, 3,
and 7 days). The objectives of these experiments were to:
(1) assess the evolutional sequence of erosion of cohesive
sediments entering the Athabasca River, (2) to evaluate the
influence of consolidation/biostabilization time on bed
sediment stability and eroded floc structure, and (3) to
discuss the implication of these results on contaminant
transport within the Athabasca River.
2 Materials and methods
2.1 Sediment sample collection and preparation
Bed sediment samples were collected on the Muskeg River
at the confluence of the Athabasca River on October 6–7,
2009 near Fort McMurray, Alberta. The Muskeg River was
chosen for sampling as it is: (1) small in size (10 m wide,
0.5 m deep at point of sampling), thus providing easier
access for SFGL sampling, and (2) the Muskeg River basin
possesses extensive deposits of presently surface mined
bitumen and is therefore also a potential significant source
of PAHs to the Athabasca River.
Recently deposited SFGL over a coble bed substrate was
collected using an inverted cone sampler (Krishnappan
2007). This sampler consists of a conical chamber fitted
with a propeller to induce sediment erosion and a
submerged pump to pump the resuspended sediment and
water to 100 L polyethylene containers. While wading, the
sampler was manually lowered to the bed and gently moved
several times during the collection process. In all, 800 L of
water and sediment was collected. A further five 20-L
polyethylene containers were filled with deposited mud
collected from the margins of the river. All containers were
shipped from Fort McMurray to Environment Canada,
Burlington, Ontario in a refrigerated truck (4°C) where they
were kept refrigerated (4°C) prior to the start of flume
experiments.
2.2 Erosion experiments
The annular flume used to assess erosional characteristics
consisted of a circular channel, 5.0 m in diameter, 0.30 m in
width, and 0.30 m in depth. Flow was generate in the flume
through the counter rotation of the circular channel
(clockwise) containing the experimental sediment bed and
overlying water, relative to a top lid (counter clockwise)
that just touched the surface of the water within the flume.
This counter rotation helped to generate a two-dimensional
turbulent shear flow with nearly constant bed shear stress
across the width of the channel (Petersen and Krishnappan
1994). A full description of the flume can be found in
Krishnappan (1993).
J Soils Sediments (2011) 11:679–689
The flume was interfaced with a CILASTM 930 laser
particle size analyzer (S.P.E. Ltd., North York, ON,
Canada) to generate real-time particle size distributions
during flume operation (a distribution was measured every
7 min over the duration of an experimental run). The
instrument operates on the principle of laser diffraction and
was operated in a continuous flow through mode and
generates distributions ranging from 0.2 to 500 μm in
range. To minimize floc breakage in the system, samples
were drawn through the system (i.e., flocs did not pass
through a pump prior to analysis). While some floc
breakage cannot be discounted, the degree of breakage will
be highly dependent on the structure/composition of the
flocs. It is believed that for the sediment analyzed, minimal
breakage occurred given the observed increasing size with
shear at the start of the experiment.
The sediment/water samples were allowed to equilibrate
to room temperature at which point they were hydraulically
sieved through a 200-μm mesh. The resulting sediment
(that which passed through the mesh) was placed in the
circular channel forming a uniform 2-cm bed. (Particles
larger than 200 μm were removed to assess the true effects
of the finer sediments as a large mix of sediment sizes were
within the bed up to and including cobles. In addition, finer
particles are also more relevant to contaminant transport).
The flume was then filled with Muskeg River water to a
depth of 12 cm and operated at a high rate of speed
equivalent to a bed shear of 0.461 Pa for 20 min. The speed
of the flume was then reduced gradually to a stop at which
point the sediment was allowed to settle and consolidate/
biostabilize for 1-, 3-, and 7-day periods (individual
consecutive experiments). The same sediment and water
mixture was used for all experimental runs as: (1) while
some bio-physicochemical changes were likely to occurred
within the flume over the duration of the experiments (1, 3,
and 7 days), it was felt that by maintaining a consistent core
sediment for all experiments, extraneous variables and
unknown variations in sediment and water characteristics
were minimized, than if new material was added for each
experiment, and (2) this was a logistical necessity, as the
volumes required for the flume are large (approx. 100 kg
sediment and 800 L water), thus making sampling and
long-range shipping problematic and costly.
Erosion experiments were initiated from quiescent
conditions in incremental steps of shear ranging from
20 min (initial steps) to 40 min. The shear stresses and
times used were: 0.058 Pa (20 min), 0.088 Pa (20 Min),
0.121 Pa (40 min), 0.165 Pa (40 min), 0.21 Pa (40 min),
0.265 Pa (40 min), and 0.325 Pa (40 min). Fifty-milliliter
samples of water and eroded floc were collected from the
flume through a sampling port located at the mid-depth at
5-min intervals until the completion of the test. These
samples were analyzed for suspended solid (SS) concen-
681
tration by a gravimetric method, which consisted of
filtering (0.45 μm) the sample, and drying and weighing
the residue.
Erosion rate, E (kilograms per square meter per second),
was calculated following the method of Ravens and
Gschwend (1999) (Eq. 1):
E ¼ M ðt
t cÞ
ð1Þ
where τc is the critical shear stress for erosion and τ is the
applied shear stress. M is the erosional constant rate
(kilograms per square meter per second per pascal). M was
calculated for each shear stress as the average of the
resuspension sediment rate over the applied shear stress
range used in the experiments. The experimental values of M
are as follows: 1-day—0.135, 3-day—0.065, and 7-day—
0.037.
2.3 Bulk density
Bulk density analysis was performed on all three consolidation/biostabilization periods. Samples were settled for 1,
3, and 7 days within 12 cm of water in three glass beakers
forming a similar bed thickness to the flume. Bulk density
profiles were measured at 1-mm increments using an Ultra
High Concentration (UHC) meter manufactured by Delft
Hydraulics, The Netherlands (Berkhout 1994). This analysis was limited to the region starting 5 mm below the
surface of the sediment (the ultrasound generator and
receptor were 10 mm in diameter and must be fully
submerged for proper measurement).
2.4 Image analysis of floc properties and settling velocity
Additional water samples were collected in plankton
chambers from the sampling port following the methods
of Droppo et al. (1997) at the end of each experimental run
to evaluate changes in geometric properties of suspended
solids using multiple microscopes and techniques [Conventional Optical Microscopy (COM), Environmental Scanning Electron Microscopy (ESEM), and Transmission
Electron Microscopy (TEM)]. Eroded floc settling velocity,
porosity, and density were determined using the settling
column method described by Droppo et al. (1997).
2.5 Bacteria counts
Triplicate 500-ml samples were collected in autoclaved
sample bottles for the determination of total bacterial counts
in suspension at the University of Guelph, Ontario, Canada,
using standard heterotrophic plate counting procedures
(standard method 9215: Eaton et al. 2005). Biostabilization
of the sediment deposits were further visually assessed by
682
direct observation through the windows in the walls of the
annular flume prior and during each experiment.
J Soils Sediments (2011) 11:679–689
Table 1 Type Ia and Ib erosion shears for each consolidation/
biostabilization period
CBs
Erosion type Ia τc (Pa)
Erosion type Ib (Pa)
0.16
0.21
0.26
0.21
0.26
0.32
2.6 POC and DOC
Triplicate 100 ml samples were collected from the flume
sampling port into glass containers. All particulate organic
carbon (POC) and dissolved organic carbon (DOC) analysis
was done by the National Laboratory for Environmental
Testing in Burlington, Ontario, Canada following the
standard method of Environment Canada (1994).
3 Results
3.1 Critical bed shear stress for erosion
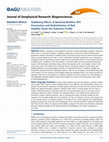
Figure 1 provides the calibrated time-series plots generated
from the 5-m annular flume for all three consolidation/
biostabilization periods (hereafter referred to as CBs) and
illustrates the change in SS concentration with increasing
bed shear stress over time. The plot demonstrates an inverse
relationship between CBs and SS concentrations (less
sediment is eroded as CBs increase). Figure 1 and Table 1
also illustrate the classic erosion sequence of types Ia and Ib
and further illustrate the influence of CBs on erosion.
During type Ia erosion, SS concentrations increase slowly
(due to the limited material available); however, the rate of
erosion increases significantly once type Ib erosion is
reached. To assess and model from the onset of SFGL
erosion, type Ia erosion was considered to be the critical
bed shear stress for erosion (τc), even though more
sediment will be mobilized during type Ib erosion.
3.2 Erosion rate and density gradients
Similar to the change in eroded SS concentration with CBs,
Fig. 2 shows that the erosion rate also has an inverse
Fig. 1 Change in SS concentration with increasing shear stress for all
consolidation/biostabilization periods. Type Ia and Ib erosion thresholds are indicated
1 day
3 days
7 days
relationship to CBs. For example, at a shear stress of
0.325 Pa (240 min), the 3-day CB had an erosion rate 3.5
times larger than that at the 7-day CB.
Realizing the limitations of the UHC meter (unable to
resolve the top 5 mm of sediment), there was no change in
voltage (at a constant ultrasound output) with depth (from 5
to 20 mm depth) within or between the 1-, 3-, and 7-day
CBs, suggesting no difference in density with depth; if
consolidation were to occur, one would expect to have a
change in density at these deeper layers (data not shown).
3.3 Floc strength
Floc strength, assessed most often within the wastewater
industry, has generally been equated to the level of energy
(velocity gradient) required to change a floc size distribution (Jarvis et al. 2005). The empirical expression for the
relationship between the velocity gradient and the floc size
according to Parker at al. (1972) is
D50 ¼ CG
<
ð2Þ
where D50 is the medium floc diameter after applying a
velocity gradient of G (per second) for a time long enough
to obtain a steady state. C is the floc strength coefficient
and < is the floc strength constant.
Equation 2 can be expressed as a log–log plot as follows:
logD50 ¼ log C
< log G
ð3Þ
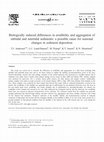
In this relationship, log C values are given by the
intercept and < by the slope of the trend line (Fig. 3 and
Table 2). The higher the value of log C, the stronger the
Fig. 2 Experimental erosion rate (E) for different consolidation/
biostabilization periods
J Soils Sediments (2011) 11:679–689
683
Fig. 3 Experimental results of
velocity gradient versus D50
remaining before a change in the
incremental shear rate, for each
consolidation/biostabilization
period
eroded floc at a fixed shear rate is (Francois 1987; Parker et
al. 1972). Conversely, the higher the value of <, the more
prone the eroded flocs are to breakage under increasing
shear (Jarvis et al. 2005). Note that as this analysis is
relevant only for floc breakage periods, not all shear values
could be incorporated into the analysis. As seen in Fig. 5
(discussed below), the 1- and 3-day CBs only showed floc
breakage during the last three shears applied (0.16 to
0.26 Pa) while the 7-day CB underwent floc breakage from
the first shear value (0.09 Pa). For statistical comparisons
between CBs, however, only the last three shears were
assessed for the 7-day CB (see Fig. 3).
Figure 3 and Table 2 show that 7-day CB flocs were the
strongest at low shear but were more prone to breakage at
higher shear levels (i.e., larger floc sizes at low shear but
smaller floc sizes at higher shear relative to 1- and 3-day
CBs). The 3- and 1-day CBs possessed lower rates of
change in floc size with increasing shear (i.e., lower values
of <), suggesting that they may have stronger bonds. The
3-day CB possessed the most stable floc at any shear as
evidenced by the lowest slope (<) (i.e., minimal change in
floc size with shear). The 1- and 3-day CBs had more
similar < and log C values relative to the 7-day CB.
Following the statistical approach of Larkin (1978) based
on the t statistic, all < and log C were statistically different
between CBs (t-test, p=0.05).
3.4 Eroded floc characteristics
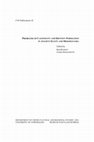
In general, all eroded flocs, regardless of CBs, were of an
open matrix with high water content (Fig. 4a), although
initially the 7-day CB flocs were substantially larger with
more organic content. Quiescent settling of the cohesive
bed material (see Fig. 4b) showed a mean settling velocity,
porosity, and density of 6.1 mm s−1, 75%, and 1.2 gcm−3,
respectively (based on two settled samples of 100 flocs
greater than 100 μm in diameter—lower limit due to
resolution of imaging system). Figure 5 provides the
median particle size variation measured with the CILASTM and demonstrates that while the 1- and 3-day CBs
yielded similar D50 values over erosion time, the 7-day CB
was substantially different (similar to results shown in
Fig. 3). The initial larger size for the 7-day CB was
followed by a rapid decline in D50 below that of the 1- and
3-day CBs, although the slopes of the lines became
similar. It is of interest to note in Fig. 5 that there was
an initial rise in eroded floc D50 for the first 70 min for 1- and
3-day CBs followed by a gradual decline (floc breakage)
with shear.
Direct visual observation through the window of the
flume showed significant variation in the eroded flocs for
the 7-day CB. In this case, very large “stringers” of
integrated biofilm and flocs up to centimeters in length
were initially observed with the onset of erosion (stringers
are indicative of likely algal growth in the system Droppo
et al. 2007). Higher resolution TEM (Fig. 6) does reveal the
significance of the organic material within all eroded floc
matrices regardless of CB. Within this figure, both
microbial cells and significant quantities of extracellular
polymeric substances (EPS) are observed to be prominent
structural features of the eroded flocs. ESEM microscopy
(Fig. 7) further shows the presence of diatoms, organic
Table 2 Summary of floc strength coefficients and constants for different consolidation/biostabilization periods
Consolidation time
Linear fit
1 day
3 days
7 days
log (D50)=−0.66 log (G)+3.24
log(D50)=−0.39 log (G)+2.62
log(D50)=−1.34 log (G)+4.85
Correlation coefficient
r2 =0.96
r2 =0.98
r2 =0.98
<
log C
0.66
0.39
1.34
3.24
2.62
4.85
684
J Soils Sediments (2011) 11:679–689
Fig. 4 a Representative flocs
from 1-day consolidation/biostabilization eroded at a shear of
0.165 Pa and b settling velocity
of collected bed sediment prior
to bed formation for 1-day
consolidation/biostabilization
period
coatings, and a progression towards more elongated open
matrix flocs for the 7-day CB.
3.5 Microbial counts
Mean values of total bacteria counts (n=3) collected at the
end of each run showed an inverse relationship between
mean bacteria counts and CBs (1-day 2.3×10⁴ cfu mL−1, 3day 1.3×10⁴ cfu mL−1, and 4.5×10³ cfu mL−1).
3.6 Eroded POC and DOC
Table 3 provides the results for eroded POC and DOC in
conjunction with SS concentrations. POC was highly
influenced by the amount of sediment eroded, with the
highest values corresponding to high SS concentrations.
The complicating influence of this autocorrelation was
minimized by viewing the ratio of values from the start of
erosion to the end of the experiments. POC values
increased by almost 35 times for the 7-day CB compared
to an almost nine times increase for the 1-day CB in spite of
SS concentrations being lower (at any given time) for the 7day CB relative to the other experimental runs. DOC
remained relatively unchanged from start to finish for all
CBs with concentrations increasing only marginally between
CBs.
study illustrate the dynamic nature of eroded cohesive
sediment in relation to shear levels and the duration of
compaction and/or biostabilization.
The bulk density measurements within this research
showed no difference in density at depths between 5 and
20 mm regardless of CBs. While the density of the upper
most 5 mm was not measured (limitation of UHC), the
constant density even after 7 days suggest that likely no
dewatering and self-weighted consolidation is occurring at
these lower layers. For the upper SFGL, Hawley (1982) has
shown that, while rapid consolidation occurs in the first
hour after deposition, very little additional consolidation
occurs over the next 24 h and that a minimum thickness of
10 mm is required for consolidation. As our system only
consists of a 2-cm bed with 12 cm of overlaying water, it is
questionable just how much consolidation occurs over the
maximum 7-day period. Within a lacustrine field environment, however, Droppo and Amos (2001) found (using CT
scanner analysis of sediment cores) a stratified density
profile with a lower density SFGL layer (ranging from 1.0
to 1.5 gcm−3) of up to 8 mm in thickness, followed by a
more consolidated bed of relatively even strength with
4 Discussion
In the study of sediment and contaminant erosion, transport,
and fate, it is important to assess the likelihood of sediment
mobilization by periodic flood events as, once suspended,
these contaminated sediments may be transported to
environmentally sensitive areas with detrimental impacts.
Further, once suspended, the sediment (floc) structure in
relation to the energy regime imparted onto the flocs will
play a strong role in their fate. The results presented in this
Fig. 5 Median size of eroded floc (D50) for different consolidation/
biostabilization periods (3-day discontinuity was due to clogging of
the CILAS observation cell)
J Soils Sediments (2011) 11:679–689
685
Fig. 6 Example representative TEM images (scale, 500 nm) of flocs at the end of tests for different consolidation/biostabilization periods: a
1-day, b 3-day, and c 7-day
depth (1.5±0.1 gcm−3). Interesting, however, Amos et al.
(2010) suggests that for most erosion scenarios, the
majority of bed erosion occurs in the top few millimeters,
and assumptions or measurements of strength (density)
profiles with depth have little credibility on the control of
erosion. Although, self-weighted consolidation cannot be
ruled out as a process occurring within the flume, with the
above information and the physical conditions of the
experiments noted, it is likely that consolidation plays a
lesser role in stabilizing the sediment compared to
microbial mediation or biostabilization (Gerbersdorf et al.
2008; Paterson 1997). Biostabilization can be defined as the
process whereby microbial growth and production of EPS
in conjunction with sediment colonization by other organisms, such as fungi and algae, result in the increased
stabilization of a bed sediment due to the sticking together
of individual particles and flocs (Droppo et al. 2001). In
essence, biostabilization represents a biofilm incorporated
into the surface sediment.
Certainly there is evidence from Figs. 6 and 7 (showing
two different resolutions—TEM and ESEM, respectively)
of structural biological mediation of sediment flocs. The
importance of individual EPS fibrils is seen in Fig. 6 while
more bulk organic coverage of flocs is seen in Fig. 7. The
observed filamentous stringer type flocs for the 7-day CB
would further suggest that algae are playing a strong role in
stabilizing the bed sediment. Yallop et al. (2000) and
Gerbersdorf et al. (2008, 2009) have demonstrated that
multiple sources of EPS binding material for bed sediment
stability are generally present in sediments from both
microbial and algal sources. In addition, diatoms, which
were observed to be present within our sediments, are also
known to produce significant quantities of EPS (Smith and
Underwood 1998) with stabilizing properties. Lundkvist et
al. (2007) found that diatom colonization of cohesive
sediments increase the critical shear stress for erosion by
120% compared to only 20% for bacteria. Future research
proposed for the Athabasca River oil sands region will
elucidate the role of biological mediation on bed sediment
stability in more detail than could be achieved here.
Our bacterial results, while limited, were contrary to the
expected increase in bacterial counts with CB time. Instead,
Fig. 7 Example representative ESEM images of flocs at the end of tests for different consolidation/biostabilization periods: a 1-day (scale,
50 μm), b 3-day (scale, 50 μm), and c 7-day (scale, 100 μm)
686
J Soils Sediments (2011) 11:679–689
Table 3 Mean POC, DOC, and SS concentrations (all units in milligrams per liter) at the start and end of each run
1-Day
Start
End
Ratio (end/start)
3-Day
POC
DOC
SS
14.3±1.1
124±0.6
8.7
34.3±0.6
34.2 ±0.1
1.0
185
1210
6.5
7-Day
POC
DOC
SS
POC
DOC
SS
132±6.8
NA
38.2±0.4
39.4±0.2
1.0
35
550
15.7
2.4±0.05
84.0±0.5
34.8
47.7±1.2
53.2±0.6
1.1
20
230
11.5
Note that the “end” SS concentration was based on a sample collected at 200 min within each run. This was necessitated to provide a standard
sampling time, given each erosion experiment was run for different lengths of time; n=3 for POC and DOC
concentrations declined with time. This decline, however,
may in part be due to the change in community structure,
with the observed increase in algae coinciding with a
decrease in bacteria. Such a switching of dominant
organisms was found by Droppo et al. (2007) when
investigating biostabilization of cohesive sediments in a
wave-dominated environment. Over a 15-day duration, gramnegative bacteria were found to decline while algal populations
increased. Given that standard plate counts are not highly
sensitive and assume that bacteria are planktonic, it is also
possible that with time, bacteria became more incorporated into
the floc material. In so doing, colony forming microbial units
(CFU) may be missed within the counts (e.g., there may be
hundreds of bacteria associated with a floc but they may result
in only one observed CFU when the inverted filtered sample is
incubated on the agar plate) (Salhani and Uelker-Deffur 1998).
Further, plate counts can be highly selective (missing some
microbial species) and will not account for nonviable
microbes which could still have an effect on bed stability by
increasing the cohesive nature of the deposit.
Measurements of eroded DOC and POC (see Table 3)
were difficult to interpret as their values were highly related
to the amount of SS eroded (sampling of the bed sediment
directly prior to erosion experiments was not possible as
this would have compromised the integrity of the bed
surface). Given that SS concentration varied significantly
between CBs at the same period of erosion due to variations
in bed stability, comparisons of absolute values have
limited utility. For example, the 7-day CB POC was less
than that for the 1-day CB; however, after 200 min of
erosion, the SS concentration was almost ten times that of
the 7-day CB experiment. The indication that POC may be
reflective of some stabilizing condition, however, is weakly
reflected within the relative value (ratio) of POC measured
at the beginning and end of the experiment where the 7-day
CB POC increased by 35 times compared to only nine
times for the 1-day CB. DOC did increase marginally from
the 1- to 7-day CB; however, the relative increase from the
start to end of the experiments did not change suggesting a
lack of influence of SS concentration on this value and a
poor relationship to bed stability.
The suggestion that biological mediation plays a strong
role in the bed sediment stability, along with the possibility
of some self-weighted consolidation is supported by the
experimental results from the flume. Figure 1 illustrates that
regardless of shear level, the 7-day CB consistently yielded
the lowest eroded SS concentration with the 3-day CB
resulting in an intermediate concentration. This inverse
relationship between bed stability and CBs suggests that
more energy is required to suspend an equivalent amount of
sediment relative to lower CBs. This is also seen in the
increasing shear required to generate types Ia and Ib erosion
with CBs. The critical bed shear stress for erosion (Cc)
increased from 0.16 to 0.26 Pa for 1- and 7-day CBs,
respectively. Interestingly, the amount of shear required to
move erosion from type Ia to Ib for all CBs was
consistently one increment in shear (0.05 Pa). Perhaps, a
narrower range in shear increments would have delineated
the differences in more detail.
The values of Cc reported here are at the high end of
those reported by Droppo (2009) for freshwater environments and on the low end of those reported for multiple
marine environments by Amos et al. (2003). However, it
should be noted that no sieving was performed on these
sediments as was done in this study. Sieving was required
to assess the true effects of the cohesive sediments as a
large mix of sediment sizes were within the bed up to and
including cobles. Further, the values reported by Droppo
(2009) and Amos et al. (2003) used type Ib as the τc
whereas our work focused on the SFGL and used type Ia
for τc. In addition, the results of Droppo (2009) were
generated using a 2-m annular flume which may have not
generated even shear across the bed, possibly skewing the
results. The 5-m flume is believed to provide a more even
distribution of bed shear (Petersen and Krishnappan 1994).
Erosion rates commonly show significant variation in
time for a given shear level with an initial spike when a
new shear is applied followed by a reduction in the erosion
rate as new layers of possibly structurally different
sediment are reached. This variation in erosion rate is due
to different consolidation, water content, or microbial
mediation at different levels in the sediment (Amos et al.
J Soils Sediments (2011) 11:679–689
2003). With a further increase in shear, the rate will spike
again and then gradually decline again at the same shear.
While Fig. 2 simplifies erosion rate by using an average
rate constant for each CB, it does further support the
observation of increasing bed strength with CB time.
Once particles are eroded from the bed, their structure
and strength will play a strong role in their transport and
fate within any aquatic system. Very large flocs with an
open matrix (low porosity) will be more prone to breakage
than smaller, more dense flocs (Milligan and Hill 1998). In
general, the larger the floc, the faster its settling velocity is
(see Fig. 4b); however, its transport dynamics within the
water column will be dictated by its interactions with the
shear stresses imparted onto the floc. Droppo (2004) has
used the concept of “floc recycling” to conceptually
illustrate the “life cycle” of a floc with its transient
interactions with the bed and fluid shear, and the continual
formation and break-up of flocs in suspension.
Figure 3 and Table 2 have illustrated that the 7-day CB,
while initially yielding the largest flocs, also produced the
weakest flocs relative to the 1- and 3-day CBs. This is
supported by the visual observations of large organic rich
flocs within the flume that were seen to break up with
increasing shear and by the ESEM observation of more
open elongated matrices (see Fig. 7c). The more tightly
bound eroded flocs of the 1-day and 3-day CBs were more
stable than the more open matrix of the 7-day eroded flocs
which can be easily broken by fluid shear. The likely
thicker buoyant biofilm formed on the 7-day CB bed may
have possessed an upward effective stress larger than the
biofilm strength and hence allowed for easier floc erosion
with subsequently break-up within the flow (Amos et al.
2003; Sutherland et al. 1998). Further, Fig. 5 corroborates
this finding by illustrating a rapid decline in particle size
with time (shear) for the 7-day CB relative to the others.
The lower rates of change in eroded floc size with
increasing shear for the 1- and 3-day runs suggest that
they may have stronger bonding. It is interesting to note,
however, that after approximately 120 min, all CBs had
similar rates of change with shear (slopes) suggesting a
possible similar core floc strength. Liao et al. (2002),
within the wastewater literature, has demonstrated a twolayer floc model with an outer defuse and easily
removable layer around an inner more dense and stable
core. It is possible that the 7-day CB flocs initially
possessed these two layers, and once the first layer was
eroded, only the inner core was left with flocs similar to
the other CBs in size. The strongest flocs were, nonetheless, found for the 3-day CB suggesting that a close to
optimal association of microbes has been achieved to
stabilize the floc, although this cannot be quantified. The
observed increase in floc D50 for the 1- and 3-day CBs
over the initial 80 min of the experiment (shear change
687
from 0 to 0.121 Pa) (see Fig. 5), suggests that either (a)
larger flocs are being brought into suspension, or (b)
flocculation is occurring in suspension to increase the
measured size. Following the coarsening of the distributions, however, the floc D50 gradually decreases for both
CBs, suggesting that the flocs are breaking up as shear
continues to increase.
5 Implications
It is well established that contaminants, including PAHs
(a contaminant of relevance to the Athabasca oil sands
area), possess a high affinity for sediments, particularly
the cohesive fraction (e.g., Ghosh et al. 2000; Headley et
al. 2001; Maruya et al. 1996). While the results presented
here were generated from sediment (<200 μm) collected at
the confluence of the Muskeg River and Athabasca River,
they are applicable to the general fine sediment material
that can be eroded within the watersheds of the Athabasca
oil sands area. The range of Cc measured within the flume
(0.16–0.26 Pa—1- and 7-day CBs), and even the more
erosive type Ib shear for erosion (0.21–0.31 Pa) (see
Table 1), was found to be within the range of values stated
by Amos et al. (2003) and Droppo (2009) for multiple
environments. It is clear that given the size and flows of
the Athabasca River, the τc will be easily surpassed
resulting in a downstream migration of fine sediments
and associated contaminants. In a survey of fine bed
sediment PAHs from multiple tributaries within the
Athabasca oil sands area, Headley et al. (2001) found
elevated values within the tributaries compared to the
main channel of the Athabasca River. The lower PAH
values in the Athabasca River are testament to the
significant erosion, transport, and dilution capacity of the
river itself. Given the possible ecological impact of
sediment PAHs within the oil sands area and downstream
to the Lake Athabasca Delta, this paper provides critical
information towards establishing the required baseline
hydrodynamic conditions for the management of
sediment-PAH erosion, transport, and deposition. In this
regard, the paper provides information (critical bed shear
stress for erosion and erosion rate) towards the development of models such as that described by Krishnappan
(2000) which can be used to predict sediment and
associated contaminant dynamics in the Athabasca River.
Such models will be of importance for the management of
disturbed watersheds within the oil sands area and in
assessing the potential impact on the downstream Lake
Athabasca Delta. Further, the paper demonstrates that in
the management of sediment-contaminant issues, one
cannot only focus on the bulk chemical concentration
alone but rather must also incorporate information on
688
sediment interactions, hydrodynamics, and biological
characteristics of the system. Without a holistic approach
to the modeling and management of water resources,
erroneous decisions on contaminant transport, exposure,
and risk could be made with possible detrimental impacts.
6 Conclusions
The results of this research demonstrate that cohesive
sediment dynamics control the erosion, transport, and fate
of contaminants through the symbiotic interplay between
fluid shear stress and the structure, composition, and
strength of the eroded flocs. In the experimental setting,
consolidation was believed to have limited effect on erosion
while biostabilization was the likely main controlling factor.
Increasing biostabilization with time resulted in a more
stable surficial layer with a reduced erosion rate relative to
less biostabilized beds. The highly biostabilized bed (7-day
CB), however, yielded the largest flocs which broke up
easily compared to those eroded from 1- and 3-day CBs. It
is believed that the EPS produced by the sediment
biological community is the main component of the bed
and flocs that is responsible for the observed stability
results. Finally, for the management, assessment of risk,
and impact of PAHs on the Athabasca River system, there
is a strong need to understand and model the cohesive
sediment dynamics (with emphasis on the biological
influences) as this is a primary driver of contaminant
dynamics within the system.
Acknowledgments JG-A thanks the CONACYT Mexican funding
agency for the economic support during a sabbatical at Environment
Canada. We also thank the staff of Alberta Sustainable Resource
Development at Fort McMurray for their support with the sampling
equipment and shipping of samples.
References
Amos CL, Droppo IG, Gomez EA, Murphy TP (2003) The stability of
a remediated bed in Hamilton harbour, Lake Ontario, Canada.
Sedimentol 50:149–168
Amos CL, Bergamasco A, Umgiesser G, Cappucci S, Cloutier D,
DeNat L, Flindt M, Bonardi M, Cristante S (2004) The stability
of tidal flats in Venice Lagoon—the results of in-situ measurements using two benthic, annular flumes. J Mar Sci 51:211–241
Amos CL, Umgiesser G, Ferrarin C, Thompson CEL, Whitehouse
RJS, Sutherland TF, Bergamasco A (2010) The erosion rates of
cohesive sediments Venice lagoon, Italy. Cont Shelf Res 30:859–
870
Berkhout N (1994) Manual “UHCM”, Ultra High Concentration
Meter. Delft Hydraulics, Rotterdam
Droppo IG (2004) Structural controls on floc strength and transport.
Can J Civ Eng 31:569–578
Droppo IG (2009) Biofilm structure and bed stability of five contrasting
freshwater sediments. Mar Fresh Wat Res 60:690–699
J Soils Sediments (2011) 11:679–689
Droppo IG, Stone M (1994) In-channel surficial fine-grained sediment
laminae (Part I): physical characteristics and formational processes. Hydrol Proc 8:101–111
Droppo IG, Amos CL (2001) The structure, stability and transformation of contaminated lacustrine surface fine-grain laminae. J Sed
Res 71(5):718–727
Droppo IG, Leppard GG, Flannigan DT, Liss SN (1997) The
freshwater floc: a functional relationship of water and organic
and inorganic floc constituents affecting suspended sediment
properties. Wat Air Soil Pollut 99:43–53
Droppo IG, Lau YL, Mitchell C (2001) The effect of depositional
history on contaminated bed sediment stability. Sci Tot Environ
266:7–13
Droppo IG, Ross N, Skafel M, Liss SN (2007) Biostabilization of
cohesive sediment beds in a freshwater wave-dominated environment. Limnol Oceanogr 53(2):577–589
Eaton AD, Clesceri LS, Rice EW, Greenberg AE (2005) Standard
methods for the examination of water and wastewater, 21st edn.
American Public Health Association, American Water Works
Association, Water Environment Federation, Baltimore
Environment Canada (1994) Manual of analytical methods, v. 1.
Major ions and nutrients. Environmental Conservation Service
(ECD). Canadian Communications Group, Toronto
Francois RJ (1987) Strength of aluminum hydroxide flocs. Wat Res
21:1023–1030
Gerbersdorf SU, Jancke T, Westrich B (2007) Sediment properties for
assessing the erosion risk of contaminated riverine sites. J Soils
Sediments 7(1):25–35
Gerbersdorf SU, Jancke T, Westrich B, Paterson DM (2008) Microbial
stabilization of riverine sediments by extracellular polymeric
substances. Geobiology 6:57–69
Gerbersdorf SU, Bittner R, Lubarsky H, Manz W, Paterson DM
(2009) Microbial assemblages as ecosystem engineers. J Soils
Sediments 9:640–652
Ghosh U, Gillette JS, Luthy RG, Zare RN (2000) Microscale location,
characterization, and association of polycyclic aromatic hydrocarbons on harbour sediment particles. Env Sci Tech 34:1729–1736
Hawley N (1982) Settling velocity distribution of natural aggregates. J
Geophys Res 87(C12):9489–9498
Headley JV, Akre C, Conly FM, Peru KM, Dickson LC (2001)
Preliminary characterization and source assessment of PAHs in
tributary sediments of the Athabasca river, Canada. Environ
Forensis 2:335–345
Jarvis P, Jefferson B, Gregory J, Parsons SA (2005) A review of floc
strength and breakage. Wat Res 39:3121–3137
Krishnappan BG (1993) Rotating circular flume. J Hydraul Eng 119
(6):758–767
Krishnappan BG (2000) Modelling cohesive sediment transport in
rivers. In: Stone M (ed), The role of erosion and sediment
transport in nutrient and contaminant transfer. Proceedings of the
International Association for Hydrological Sciences, Waterloo,
Ontario, Canada, IAHS Pub 263, pp 269–276
Krishnappan BG (2007) Recent advances in basic and applied
research in cohesive sediment transport in aquatic systems. Can
J Civ Eng 34:731–743
Krumbein WE, Paterson DM, Stal LJ (eds) (1994) Biostabilization of
sediments. Verlag, Oldenburg, p 526
Lambert CP, Walling DE (1988) Measurement of channel storage
of suspended sediment in a gravel-bed river. Catena 15:65–
80
Larkin PA (1978) Biometrics—a handbook of elementary statistical
tests. University of British Columbia, Vancouver, British Columbia, Canada
Liao BQ, Allen DG, Leppard GG, Droppo IG, Liss SN (2002)
Interparticle interactions affecting the stability of sludge flocs. J
Colloid Interf Sci 249:372–380
J Soils Sediments (2011) 11:679–689
Liss SN, Droppo IG, Flannigan D, Leppard GG (1996) Floc
architecture in wastewater and natural riverine systems. Env Sci
Tech 30(2):680–686
Lundkvist M, Grue M, Friend PL, Flindt MR (2007) The relative
contributions of physical and microbiological factors to cohesive
sediment stability. Contin Shelf Res 27(8):1143–1152
Maruya KA, Risebrough RB, Horne AJ (1996) Partitioning of polynuclear aromatic hydrocarbons between sediments from San Francisco
Bay and their porewaters. Env Sci Tech 30:2942–2947
Milligan TG, Hill PS (1998) A laboratory assessment of the relative
importance of turbulence, particle composition, and concentration in limiting maximal floc size and settling behavior. J Sea Res
39:227–241
Parker DS, Kaufman WJ, Jenkins D (1972) Floc breakup in turbulent
flocculation processes. J Sanit Eng Div: Proc ASCE SA1:79–99
Paterson DM (1997) Biological mediation of sediment erodibility:
ecology and physical dynamics. In: Burt N, Parker R, Watts J
(eds) Cohesive sediments. John Wiley, New York, pp 215–229
Petersen O, Krishnappan BG (1994) Measurement and analysis of
flow characteristics in a rotating circular flume. J Hydraul Res 32
(4):483–494
689
Ravens TM, Gschwend PM (1999) Flume measurements of sediment
erodibility in Boston harbor. J Hydraul Eng 125(10):998–1005
Salhani N, Uelker-Deffur A (1998) Improved quantification of
aggregated bacteria by combined enzymatic and mechanical
treatment of flocs and biofilms from a rotating drum bioreactor.
Wat Res 32:1287–1295
Smith DJ, Underwood JC (1998) Exopolymer production by intertidal
epipelic diatoms. Limnol Oceanogr 43(7):1578–1591
Stone M, Krishnappan BG, Emelko MB (2008) The effect of bed age
and shear stress on the particle morphology of eroded cohesive
river sediment in an annular flume. Wat Res 42:4179–4187
Sutherland TF, Amos CL, Grant J (1998) The effect of buoyant
biofilms on the erodibility of sublittoral sediments of a temperate
microtidal estuary. Limnol Oceanogr 43(2):225–235
Teisson C, Ockenden M, Le Hir P, Kranenburg C, Hamm L
(1993) Cohesive sediment transport processes. Coastal Eng
21:129–162
Yallop ML, Paterson DM, Wellsbury P (2000) Interrelationships
between rates of microbial production, exopolymer production,
microbial biomass and sediment stability in biofilms of intertidal
sediments. Microb Ecol 39:116–127
Erosion characteristics and floc strength of Athabasca River cohesive sediments: towards managing sediment-related issues
Journal of soil and sediments, 2011
Purpose This research aims to investigate: (1) the evolutional sequence of erosion of cohesive sediments entering the Athabasca River, (2) the influence of consolidation/ biostabilization time on bed sediment stability, and (3) the implication of these results on contaminant transport within the Athabasca River. Materials and methods A 5-m annular flume was used to generate bed shear to assess cohesive sediment dynamics for eroded beds with consolidation/biostabilization periods (CBs) of 1, 3, and 7 days. Additional laser particle sizing, image analysis, densitometry, and microbial analysis were employed to further the analysis with respect to bed erosion and eroded floc characteristics. Results and discussion The critical bed shear stress for erosion increased from 0.16 (1-day CB) to 0.26 Pa (7-day CB) with an inverse relationship observed for both suspended sediment concentration and erosion rate with respect to CBs. The 7-day CB yielded the largest eroded flocs that initially have high organic content but were quickly broken up with increasing shear. The strongest eroded floc population occurred for the 3-day CB. Eroded flocs were found to be of an open matrix with high water content and low density. Flocs contained a mixture of clay and silt particles, microbes, algae, diatoms, and secreted extracellular polymeric substances (EPS). Counts of bacteria were observed to decrease with CBs while an increase in the algal community is suggested with time. Conclusions Consolidation was believed to have limited effect on erosion while biostabilization was the main controlling factor. Increasing biostabilization with time resulted in a more stable surficial layer with a reduced erosion rate relative to less biostabilized beds. The highly biostabilized bed (7-day CB), however, yielded the largest flocs which broke up easily compared to those eroded from 1-and 3-day CBs. It is believed that the EPS produced by the sediment biological community is the main component of the bed and flocs that is responsible for the observed stability results....Read more