Motiv Emot (2015) 39:448–457
DOI 10.1007/s11031-014-9456-8
ORIGINAL PAPER
Regularity of daily activities buffers the negative impact of low
perceived control on affect
Caitlan A. Tighe • Natalie D. Dautovich
Rebecca S. Allen
•
Published online: 3 December 2014
Ó Springer Science+Business Media New York 2014
Abstract The main objective of the present study was to
examine the potential buffering effect of regularity of the
duration of time spent on daily activities in the association
between perceived control and affect in communitydwelling adults. The sample for the current study was
derived from the Midlife in the United States longitudinal
follow-up study, MIDUS-II. Findings corroborated the
association between a general sense of perceived control
and positive and negative affect. Further, daily regularity
was found to moderate the relationships of perceived
control and both positive and negative affect. In each case,
the findings suggest that individuals who scored lower on
perceived control measures were more likely to have better
affective outcomes when they demonstrated greater regularity in daily activities. The findings imply the relevance
of regularity to affective experiences.
Keywords
Perceived control Affect Regularity
Introduction
Perceived control, or the extent to which an individual
believes in his or her ability to influence outcomes, has
been empirically associated with the experience of affect.
C. A. Tighe (&) N. D. Dautovich
Department of Psychology, University of Alabama, 356B
Gordon Palmer Hall, 505 Hackberry Lane, Tuscaloosa,
AL 35487-0348, USA
e-mail: catighe@crimson.ua.edu
R. S. Allen
Center for Mental Health and Aging/Department of Psychology,
University of Alabama, 248A Gordon Palmer Hall, 505
Hackberry Lane, Tuscaloosa, AL 35487-0348, USA
123
Specifically, an increased sense of control is associated
with increased positive and decreased negative affect (Bye
and Pushkar 2009). Although there is research to substantiate this association, less is known about additional variables that may influence this relationship (Lachman et al.
2011; Skinner 1995). Therefore, the main objective of the
present study was to examine the potential moderating
effect of regularity, defined as day-to-day variability in the
duration of time spent on daily activities, in the association
between perceived control and affect. This aim was
accomplished through an archival analysis of the Midlife in
the United States (MIDUS) follow-up dataset, MIDUS-II.
Perceived control represents the belief that desired outcomes can be regulated or influenced by one’s own actions. It
is conceptualized as the learned view of a competent self and
a responsive environment and, as such, is susceptible to
change across time and life domains (Skinner 1996). Perceived control has been linked to both physical (e.g., cortisol
responses; Bollini et al. 2004) and mental (e.g., anxiety;
Lachman et al. 2011) health and, therefore, is an important
factor to examine. In the present study, perceived control is
considered in relation to affect. The social determination
theory provides theoretical support for the association
between perceived control and affect. Social determination
theory proposes a human need or desire for competence, or
the experience of oneself as effective in dealing with the
environment. When achieved, this experience is associated
with a sense of well-being (Deci and Ryan 2000; Sheldon
et al. 2001). In a general sense, when an individual perceives
that desired outcomes are contingent on his or her own
behavior or actions, there is a tendency to experience more
competence, which may be experienced as positive affect.
Conversely, when outcomes are perceived to be non-contingent on an individual’s behavior, there is a tendency to
experience negative affect, which may be representative of
Motiv Emot (2015) 39:448–457
incompetence (Skinner 1996). At this point in time, there has
been a great deal of attention focused on the direct relationship between perceived control and affect (e.g.,
Bookwala and Fekete 2009; Bye and Pushkar 2009; DeNeve
and Cooper 1998; Windsor and Anstey 2010). However, this
association may be influenced by additional personal and
environmental circumstances.
Dysregulation of daily activities is one variable that has
been implicated in numerous health outcomes, including the
experience of affective episodes, and may influence the
association of perceived control and affect (Ehlers et al.
1988; Grandin et al. 2006). Throughout each day, the daily
activities in which individuals engage (e.g., meal times,
physical activity, etc.) serve as social time cues that collectively comprise their social rhythms. According to the social
zeitgeber theory (Ehlers et al. 1988), an individual’s social
rhythm exerts influence on his/her biological rhythms. As
such, disruption of these daily social rhythms can result in the
subsequent disruption of biological rhythms, which has been
implicated in the experience of affective episodes (Ehlers
et al. 1988; Wirz-Justice et al. 2009).
Empirically, much of the current literature on regularity
of daily activities has focused on the detrimental impact of
rhythm disruption, where decreased regularity has been
associated with increased levels of depressive symptoms in
individuals who have recently experienced stressful life
events (e.g., bereavement) or those who meet the criteria
for depressive disorders (Prigerson et al. 1994). However,
Monk et al. (1997) propose a model wherein having a more
regular lifestyle may contribute to greater well-being.
Based on this model, having a more regular lifestyle (i.e.,
the consistent allocation of time spent on daily activities)
promotes event predictability, which in turn promotes
better mood (Monk et al. 1997). Predictability and perceived control are distinct, but complementary constructs.
Therefore, event predictability may offset the negative
effects of having low perceived control. A more regular
lifestyle may also contribute to greater circadian entrainment, which is proposed to facilitate the experience of
increased affective well-being (Monk et al. 1997).
Few studies have examined rhythm stability as a factor
contributing to the maintenance of affective well-being, or
as a protective factor against negative psychological outcomes. Notably, Ivanova and Israel (2005) identified the
moderating role of regularity in daily activities and events
in the relation between pessimistic attributional style and
depressive symptoms in a sample of college students.
Specifically, for individuals who were more regular in their
daily life, a pessimistic attributional style (e.g., attributing
negative events to internal causes and positive events to
external causes) was not as strongly negatively related to
depressive symptoms as it was for those who were less
regular. These findings suggest that regularity may serve as
449
a buffer against the influence of attributional style.
Although the constructs examined are not identical to those
in the proposed study, the findings lend theoretical and
empirical support for a conceptual model where regularity
of daily activities moderates the relation between views of
the self and affective outcomes (Ivanova and Israel 2005).
However, because the sample consisted of younger adults
ranging in age from 17 to 23 years, the generalizability of
results to individuals across the lifespan is limited. Additionally, regularity was measured using a Likert-type scale
on which participants rated their perceived regularity in
daily activities, which presents a subjective measure of
regularity. As such, the present study aims to more clearly
elucidate this conceptual model by sampling individuals
from an age-range that spans adulthood, as well as by using
prospective measures of regularity.
This study extends current research on perceived control
and affect in adults by assessing the potential moderating
role of regularity of daily activities. Specifically, the study
aims to examine if: (1) the construct of overall perceived
control independently predicts positive affect and negative
affect, (2) regularity predicts positive and negative affect,
and (3) the relationship between overall perceived control
and positive and negative affect varies by regularity in
duration of daily activities.
Based on the above-mentioned research and on the Monk
et al. (1997) conceptual model of lifestyle regularity as it
relates to well-being, it was hypothesized that perceived
control would positively predict positive affect and negatively predict negative affect. Regularity was hypothesized
to predict positive and negative affect with higher levels of
regularity predicting greater positive affect and lower levels
predicting greater negative affect. Finally, it was hypothesized that increased regularity would buffer the effects of
low perceived control on positive and negative affect.
Methods
Participants
The sample of interest for the current study was derived
from those individuals who completed both Project 1
(follow-up of MIDUS-I demographic information and
psychological constructs) and Project 2 (National Study of
Daily Experiences-II; NSDE-II) of MIDUS-II, the secondwave of a nationally representative study of communitydwelling adults (Ryff amd Almeida 2010). Participants
were selected utilizing random digit dialing from working
telephone banks in the United States. Only those participants who completed perceived control measures, affect
measures, and at least 7 days of daily activity data, where
engagement in a minimum of three activities was endorsed
123
450
Motiv Emot (2015) 39:448–457
at least twice during the 7-day period, were included in the
study. The final sample consisted of 1,548 participants.
Participants ranged in age from 33 to 84 years old
(M = 56.93, SD = 12.06). The majority of the sample
were female (56.9 %), white (93.0 %), currently married
(73.0 %) and reported completing at least 1–2 years of
college (70.7 %). On average, participants self-rated as
being in good health (M = 2.35, SD = .99), on a Likerttype scale where 1 is excellent and 5 is poor. Complete
descriptive statistics are listed in Table 1.
Procedures
Data collection for MIDUS-II, Project 1 occurred through
structured telephone interviews and mail surveys. Measures of demographics, perceived control, and positive and
negative affect were embedded within the Project 1 selfadministered questionnaires, which were sent by mail and,
once completed, were returned by mail.
Data collection for the NSDE-II occurred in ‘‘flights’’ of
interviews with each flight consisting of approximately 20
participants. Individual flights were conducted at varying
times in the calendar year to allow for consideration of
seasonal variation in daily experiences. Participants completed structured telephone interviews about their daily
experiences for eight consecutive days. Data for all measures of interest were self-reported by each participant.
Table 1 Participant demographics
Variable
Statistic
M (SD) age (years)
56.93 (12.06)
Gender (%) female
56.9
Race (%)
White
93.0
African American
2.5
Native American or Alaska Native
1.4
Asian
.3
Other
2.9
Marital status (%)
Currently married
73.0
Separated
1.6
Divorced
11.4
Widowed
7.0
Never married
7.0
Highest level of education (%)
Junior high school
High school
At least 1–2 years college
M (SD) health
1.0
28.3
70.7
2.35 (.99)
Health was calculated from a Likert-type scale where respondents
self-rated their physical health, where 1 = excellent and 5 = poor
123
Measures
Demographic information
Participants self-reported age, sex, physical self-rated
health, highest level of education completed, current marital status (married, separated, divorced, widowed, or never
married), and race (White, African American, Native
American, Asian, Native Hawaiian or Pacific Islander, or
other) on the self-administered questionnaires that were
sent via mail. Since the majority of the sample identified as
married and as White, and because these were not variables
of primary interest for the current study, both marital status
and racial origins were dichotomized (i.e., married/nonmarried, White/Other), to promote parsimonious models
for statistical analysis. Based on their potentially differential associations with affect, the following covariates
were included in the models: age, sex, race, marital status,
self-rated health, and years of education (Steptoe et al.
2011).
Perceived control
Overall perceived control was measured by combining
items from personal mastery and perceived constraints
scales, for a total of 12 items. The mastery scale is comprised of four questions that measure an individual’s
beliefs about his or her ability to carry out goals (e.g.,
‘‘what happens to me in the future mostly depends on
me’’). Two items were created by Lachman and Weaver
(1998) and two items were drawn from Pearlin and
Schooler’s Mastery Scale (1978). The perceived constraints scale is comprised of eight total items that measure
the extent to which an individual believes in the potential
for uncontrollable factors to interfere with goal achievement (Lachman and Weaver 1998; e.g., ‘‘there are many
things that interfere with what I want to do’’). Five items
were drawn from Pearlin and Schooler’s mastery scale
(1978) and three items were created by Lachman and
Weaver (1998).
Responses to all prompts were rated on a 7-point Likert
scale (1 = strongly agree and 7 = strongly disagree).
Scale scores were constructed by calculating the mean of
the respective items. Overall perceived control scores were
constructed by calculating the mean across all items, with
higher scores representing higher levels of perceived control. Cases were excluded if responses were missing from
at least half of each scale. The overall measure of perceived
control (Cronbach’s a = .68) demonstrated adequate
internal reliability in NSDE-II sample. Additionally, the
convergent validity of the measure items was previously
demonstrated through an analysis of factor loadings indicating that the items derived from Pearlin and Schooler
Motiv Emot (2015) 39:448–457
(1978) and Lachman and Weaver (1998) each loaded
properly onto their respective scales (Lachman and Weaver
1998). Although domain-specific measures may be more
sensitive to identifying relationships in specific life
domains, a generalized measure of control was used in
MIDUS-II, given the range of domains being assessed in
the larger study (Lachman and Weaver 1998).
Regularity
The current study utilized data from the daily experiences
interview which was modified for use in NSDE-II and is
comprised of stem and open-ended questions to collect
information on daily physical and psychological health, as
well as daily experiences. The items of interest asked
participants how much time was spent on various activities
in the preceding 24 h. Based on their similarity to social
rhythm activities that have previously been associated with
mood outcomes (Ashman et al. 1999; Monk et al. 1991),
the following specific activities were selected for inclusion
in the present conceptualization of daily regularity: sleeping, caring for children, doing chores, working, watching
television, giving unpaid assistance, participating in leisure
activities, engaging in physical activities, and volunteering.
To calculate a composite regularity variable, intraindividual standard deviations (ISDs) were calculated for each
individual across each response variable (e.g., time spent
sleeping). First, the duration of time spent each day on each
activity was de-trended to remove the effects of time,
leaving only the residuals for each variable. These residuals
were then used to calculate ISDs for each response variable, to determine the extent to which an individual varied
around his/her own mean. De-trending the data prior to the
calculation of the ISDs for each response variable ensured
that the ISDs represent pure variability. The ISDs for each
response variable were then averaged to produce a continuous, composite regularity score.
Although the study was designed to collect data over
8 days, the composite regularity variable was derived from
7 days of data. Seven days of data provides an estimate of
regularity over the equivalent of 1 week while still capturing
changes in routine that occur from weekdays to weekend. In
summary, regularity was operationally defined as the composite amount of intraindividual variability in the duration of
endorsed daily activities, over 7 days, where greater variability indicates less regularity. Composite variables were
derived if the participant endorsed engagement in a minimum of three activities at least twice during the 7-day period.
Positive and negative affect
Measures of positive and negative affect were developed
for MIDUS-II from pre-established and validated scales
451
including the Positive and Negative Affect Scales (Watson
and Tellegen 1985) and the Affect Balance Scale (Bradburn 1969). The positive affect scale was comprised of 13
items querying participants about how much of the time
during the past 30 days that they felt: cheerful, in good
spirits, extremely happy, calm and peaceful, satisfied, close
to others, full of life, enthusiastic, attentive, proud, confident and active. All responses were rated on a 5-point
Likert scale (1 = all of the time and 5 = none of the time).
Items were recoded so that higher scores indicated greater
positive affect. A positive affect score was calculated by
summing scores on each of the items. This measure demonstrates high internal reliability based on the NSDE-II
sample (Cronbach’s a = .94).
Negative affect was assessed using a negative affect
scale which consisted of 14 items to which participants
indicated responses on a 5-point Likert scale (1 = all of the
time and 5 = none of the time). Items asked participants
about how much of the time during the past 30 days that
they felt: so sad nothing could cheer you up, nervous,
restless, hopeless, that everything was an effort, worthless,
lonely, afraid, jittery, irritable, ashamed, angry, and upset.
Items were recoded so that higher scores represented
greater negative affect. A negative affect score was calculated by summing scores on each of the 14 items. This
measure of negative affect demonstrates good internal
reliability in the NSDE-II sample (Cronbach’s a = .95).
Results
Statistical significance was set at the .05 probability level
with results reported from SPSS version 20. In the present
analyses, the largest number of predictors in any one
regression model was nine. For a multiple regression analysis with nine predictors, predicting an effect size of at
least .02, at an alpha level of .05, a sample size of 1,548
yields a power of approximately .98 (Faul et al. 2007).
Thus, there was sufficient power to detect small effect sizes
with the current sample and analyses. Preliminary analyses
indicated that all assumptions for multiple regression
analyses were met.
Summary of analyses
Two separate, multi-tiered regression analyses using the
product term analysis method were used to test the
hypotheses that variability in the duration of daily activities
moderates the relationship between overall perceived
control and positive and negative affect, respectively
(Frazier et al. 2004). In the first step, six covariate variables
were entered: age, sex, health, education, marital status,
and race. For the second step, the standardized predictor
123
123
Health refers to participant self-rated physical health, where higher scores indicated worse health, marital status refers to married or non-married, and education indicates highest level of
education obtained
* p \ .05; ** p \ .001
.05*
.43
Regularity by Control
.17
.02
.44**
.19
.18
.14
3.80
Regularity
Perceived Control
.44**
.02
.18
.13
Regularity
.19
3.83
Perceived Control
.44**
.19
3.83
Perceived Control
.05*
-.07**
.71
.41
.97
-2.47
Race
Marital Status
.05*
-.07*
.71
.41
1.02
-2.43
Race
Marital Status
.05*
-.07*
.71
.41
1.02
-2.42
Race
Marital Status
.07*
-.08*
.79
.46
1.37
-2.54
Race
Marital status
-.23**
-.04
.20
.08
-2.00
-.14
Health
Education
-.23**
-.04
.20
.08
-1.99
-.14
Health
Education
-.23**
-.04
.20
.08
-1.99
-.14
Health
Education
-.36**
-.01
.21
.08
Sex
Age
.21**
.04
.37
.02
.15
.70
Sex
Age
.22**
.01
.41
.22
.02
.16
Sex
-3.15
-.03
Age
Sex
.04
.21**
.02
.15
.70
.37
b
SE B
B
b
SE B
B
b
SE B
B
Age
Health
Education
.21**
.02
.15
.71
.37
b
SE B
B
DR2 = .003*
Step 4
DR2 = .00
Step 3
DR2 = .18**
Step 2
DR2 = .16**
The adjusted R2, unstandardized beta weights, beta weight
standard errors, and the standardized beta weights for the
model predicting positive affect are reported in Table 2.
R was significantly different from zero at the end of each
step. After step 1, with the covariates included in the
equation, R2 = .16, Finc (6, 1,538) = 49.24, p \ .001.
Age, self-rated health, marital status, and race were significant predictors. The entry of overall perceived control
in step 2 explained an additional 17.5 % of variance,
R2 = .34, Finc (1, 1,537) = 406.58, p \ .001. Perceived
control was a significant predictor. The addition of the
regularity variable to the equation in step 3 did not produce
reliable improvements in R2, and the regularity variable
was not a significant predictor (p = .49). However, the
addition of the perceived control by regularity interaction
term in step 4 significantly explained an additional .3 % of
unique variance, R2 = .34, Finc (1, 1,535) = 6.50,
p = .01, demonstrating a small effect size, Cohen’s
f2 = .005. The regularity by sense of control interaction
term significantly predicted positive affect.
To further understand the relation between control,
regularity, and positive affect, we sampled two levels of
the regularity moderator variable at approximately 1
standard deviation below the average variability in daily
activities (low) and 1 standard deviation above the average
variability in daily activities (high). The remaining figure
in the document utilizes the same method of depiction with
the dependent variable changed, accordingly. As depicted
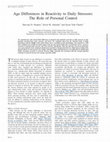
in Fig. 1, more perceived control is associated with more
positive affect, across the sample. The significant interaction term suggests that at low levels of perceived control,
individuals who are more regular report greater positive
affect than those who are less regular. At high levels of
perceived control, greater regularity was associated with
slightly less positive affect. Further, older age, better selfrated health, being married, identifying as White, and
Step 1
Perceived control and regularity predicting positive
affect
Table 2 Regression analyses predicting positive affect by covariates, perceived control, regularity, and a perceived control by regularity interaction term
variable, perceived control, was added to the model. In the
third step, the standardized moderator variable, composite
regularity, was added. In the final step, the product term
reflecting the interaction of perceived control and regularity was added to the model. Two additional regression
analyses were used to test the direct effect of regularity on
positive and negative affect, without controlling for the
effect of perceived control. Covariates were entered in step
1, the standardized composite regularity variable was
entered in step 2, the standardized perceived control variable was entered in step 3, and the regularity by control
interaction term was entered on step 4.
Motiv Emot (2015) 39:448–457
.04
452
.03
-.05*
.15
.14
.22
-.33
Regularity
Regularity by control
.03
.15
.23
Regularity
.03
* p \ .05; ** p \ .001
-.05*
-.40**
.15
-2.70
Perceived control
-.40**
.15
-2.72
Perceived control
-.40**
.15
-2.72
Perceived control
.57
.33
-.72
.67
Race
Marital status
-.05*
.02
.57
.33
-.76
.64
Race
Marital status
-.05*
.03
.57
.33
-.76
.65
Race
Marital status
-.07*
.03
.62
.36
-1.01
.74
Race
Marital status
.19**
.03
.03
.06
.08
Education
.03
.06
.08
Education
.03
.06
.08
Education
.00
.07
.00
Education
.16
1.33
Health
.19**
.16
1.33
Health
.20**
.16
1.33
Health
.32**
.17
2.16
.72
Sex
Health
.30
.01
-.14
.37
Sex
Age
-.25
.03
.30
.01
-.14
.38
Sex
Age
-.26**
.03
.30
.01
-.14
.38
Sex
Age
-.26**
-.15
Age
.01
.05*
b
SE B
B
b
SE B
B
b
SE B
B
.32
SE B
B
DR2 = .003*
Step 4
DR2 = .001
Step 3
DR2 = .15**
Step 2
For the model predicting negative affect, R was significantly different from zero at the end of all four steps (see
Table 3). After step 1, the addition of covariates explained
15.6 % of variance, R2 = .16, Finc (6, 1538) = 47.40,
p \ .001. Age, health, and marital status were significant
predictors. The entry of overall perceived control in step 2
resulted in a 14.5 % increment in R2, R2 = .30, Finc (1,
1537) = 318.10, p \ .001. Perceived control was a significant predictor. Step 3 did not account for any reliable
improvements in R2. The addition of the regularity by
perceived control interaction term in the final step (step 4)
accounted for an additional .3 % of variance, R2 = .31,
Finc (1, 1535) = 5.88, p = .02, and exhibited a small
effect size, Cohen’s f2 = .004. The regularity by perceived
control interaction term was a significant predictor.
For this model, greater age, better health, being married,
and greater perceived control were predictive of less negative affect. Additionally, the significant interaction term
indicates that the negative relationship between perceived
control and negative affect is stronger for those who are
DR2 = .16**
Perceived control and regularity predicting negative
affect
Step 1
having an increased sense of control were associated with
greater positive affect.
For the model testing the unique effect of regularity on
positive affect, without controlling for the effect of perceived control, R was significantly different from zero at
the end of each step. However, the entry of the regularity
variable in step 2 did not result in a reliable increase in R2
and regularity was not a significant predictor of positive
affect (p = .46). Further, regularity did not emerge as a
unique predictor in step 3 (p = .49) or step 4 (p = .42).
Table 3 Regression analyses predicting negative affect by covariates, perceived control, regularity, and a perceived control by regularity interaction term
Fig. 1 Significant regularity interaction term in the relationship
between perceived control and positive affect. The regularity
moderator variable was sampled at 1 standard deviation below the
average variability in daily activities (low) and 1 standard deviation
above the average variability in daily activities (high)
-.25**
453
b
Motiv Emot (2015) 39:448–457
123
454
Fig. 2 Significant regularity interaction term the relationship
between perceived control and negative affect. The regularity
moderator variable was sampled at 1 standard deviation below the
average variability in daily activities (low) and 1 standard deviation
above the average variability in daily activities (high)
low in regularity, relative to those who demonstrate greater
regularity (see Fig. 2). Of note, individuals who are more
regular experience less negative affect at low levels of
perceived control in comparison to those who are less
regular.
For the model testing the effect of regularity on negative
affect, beyond the effect of perceived control, R was significantly different from zero at the end of each step. The
entry of the regularity variable in step 2 did not result in a
reliable increase in R2 and regularity was not a significant
predictor of negative affect (p = .19). Regularity did
uniquely predict negative affect in either step 3 (p = .12)
or step 4 (p = .14).
Discussion
These findings extend prior research by demonstrating that
regularity of daily activities was found to moderate the
relationships of perceived control and both positive and
negative affect. In each case, individuals who scored lower
on perceived control were more likely to have positive
affective outcomes when they demonstrated greater regularity in daily activities. Findings from the present study
also corroborate the cross-sectional association between a
general sense of perceived control and positive and negative affect, where decreased control is predictive of lower
positive and greater negative affect. This relationship was
present even when accounting for other influential demographic variables such as age, race, marital status, and
health.
Regularity in the duration of time spent on daily activities did not uniquely predict positive or negative affect,
beyond the effects of perceived control. Although a direct
123
Motiv Emot (2015) 39:448–457
relationship between regularity and affect was anticipated
(Monk et al. 1997), there are several factors that may have
contributed to these relationships being non-significant.
First, data was collected over 8 days, which gives a clear
picture of how time spent on daily activities fluctuated on a
daily basis, across 1 week. However, whereas circadian
rhythms follow a 24-h cyclical period, other processes
demonstrate circaseptan rhythms, which are cycles that
vary over 7 day periods. So, it is possible that the timing of
daily activities follows a circaseptan rhythm, where the
variability from day-to-day is less meaningful than the
variability occurring from week to week. That is to say, the
examination of daily regularity over a week could have
given an incomplete representation of regularity across
greater time periods. An incomplete understanding of this
regularity construct may have precipitated misrepresentation of regularity in relation to affect (which represented
affect occurring over the preceding month). As such, the
present study could have benefited from daily data collection occurring over a greater duration of time (e.g.,
2 weeks) which would have enabled the identification of
circaseptan rhythmicity.
Additionally, the inclusion of several follow-up questions may have offered insight into the relationship
between regularity and affect. Specific questions might
have asked participants to indicate if the time-span reported
was typical and if the respondent has a preference for
routine or regularity (e.g., a trait routinization questionnaire), in order to ascertain if the typicality of the daily
activities or aversion to regularity may confound the relation of regularity to affect. An alternative explanation for
the non-significant finding is that since regularity has primarily been studied as it relates to clinical levels of
affective experiences (e.g., bipolar disorder; Ehlers et al.
1988), it is possible that the direct relationship between
regularity and affect is not significant at subclinical levels.
It is also possible that regularity of the timing of daily
activities (i.e., the time activities were completed) is more
strongly associated with affect than regularity in the
amount of time spent on various daily activities. Unfortunately, data on the timing of daily activities was not collected in MIDUS-II.
Nonetheless, the present analyses suggest that regularity
in daily activities moderates the association of overall
perceived control with positive and negative affect, albeit
accounting for a small amount of unique variance. Specifically, for those with lower perceptions of control,
increased regularity in daily activities is associated with
better affective outcomes than for those who are less regular. Consistent with Monk et al.’s (1997) model, regularity
during daily activities may provide a psychological sense
of stability that, in essence, weakens the relationship
between perceived control and both positive and negative
Motiv Emot (2015) 39:448–457
affect. For example, respondents may report low levels of
perceived control more broadly, but are exerting or experiencing control relative to a smaller, more specific portion
of their life, the regularity of daily activities. At the psychological level, although perhaps it is not readily identified as an aspect of control, knowing that component
activities of a day are predictable may ameliorate the
effects of a low sense of control on experience of affect. At
the circadian level, greater behavioral rhythmicity during
the day and night may also be promoting a more positive
affective experience.
One explanation for the small size of the significant
interaction effects stems from the differentiation of perceived versus actual regularity in daily life. Whereas Ivanova and Israel (2005) identified regularity as a significant
moderator in a similar conceptual model, respondents used
a retrospective measure to report on stability in daily
activities. The use of retrospective, self-report measures
invites some degree of self-report bias, where individuals
may misremember or misattribute the degree of actual
regularity experienced. It is also possible that other factors
(i.e., how frequently an activity occurs or mean levels of
activity duration) may influence how an individual
responds to questions about regularity. As such, retrospective reports may represent, to some extent, a perceived
sense of regularity. The present study used a prospective
report of regularity in daily activities, which is a more
accurate representation of actual behavioral regularity.
However, the ISD values representing regularity in the
present study do not consider activity frequency, which
may have contributed to the lower effect size seen in the
present findings. Therefore, it is possible that perceived
regularity is equally, or even more, important to consider
relative to the association between perceived control and
affect.
Limitations of the present study must be considered.
Despite being a randomly selected sample, there was little
variability in demographic characteristics (i.e., racial and
ethnic diversity). Therefore, this study cannot reliably
capture the hypothesized relations in minority populations.
From a methodological standpoint, the study is limited by
the domain-general measure of control. Domain-general
measures of control are not the most precise form of
measurement of an individual’s experience of control,
given that perceived control may vary across differing
domains (e.g., cognition, health, etc.) Just as perceived
control varies across situations, it also varies across time.
Notably, an overall sense of perceived control may vary as
frequently as from week to week (Eizenman et al. 1997) or
day to day (Ong et al. 2005). Future studies would benefit
from measuring control at a more specific level and on a
more frequent time scale, to promote acquisition of the
most precise self-reports of perceived control. Further,
455
though the reliability of the present measure of perceived
control is considered within an acceptable range, it would
be advisable for future studies to utilize a more internally
consistent measure of perceived control.
Similar to with single time-point measurement of perceived control, there may be additional error variance that
resulted from measurement of affect over a month. Affect
is a highly variable construct that fluctuates more frequently than from day-to-day, being variable even from
moment to moment (Sliwinski et al. 2009). Future studies
examining these constructs would benefit from utilizing
measures on smaller and more congruent time scales (e.g.,
measuring control, regularity, and affect at the daily level).
A final methodological limitation relates to the calculation
of the regularity variable. Specifically, whereas prior
measures of daily regularity (i.e., Social Rhythm Metric;
Monk et al. 1991) have considered the timing of daily
activities within a day, the MIDUS dataset only contained
data on the amount of time spent on daily activities and not
the time of day the activities were completed. Although
this study would have benefited from this additional timing
component, examination of variability in time spent on
daily activities remains an important aspect of daily stability. The need to understand the unique functions of
variability in timing versus time spent engaging in activities is corroborated in other literatures (e.g., sleep; Zisberg
et al. 2010). Moreover, the significant associations of
control, regularity of time spent on daily activities, and
affect imply the need to consider multiple dimensions of
daily regularity, including time spent on activities.
In summary, the present study demonstrated the associations of perceived control with positive and negative
affect. The sample size of the present study was large and
regularity moderated the effect of perceived control with
positive and negative affect, but only with small effect
sizes. Additional research is needed to understand the exact
nature and function of regularity as it relates both to perceived control and affect, but this research is merited for
numerous reasons. There is existing research indicating
that perceived control is a psychological construct that can
be enhanced through training methods such as cognitive
restructuring (Tennstedt et al. 1998). Nonetheless, the
identification of regularity as a protective factor for those
experiencing low levels of perceived control offers an
additional potential target for intervention when low perceived control may not be modifiable (e.g., the ability to
cure a chronic illness). As a target of therapy, the regulation of daily activities offers several benefits. First, as a
behavioral technique, it may be applied with individuals
with compromised cognitive capacities and may also be a
more plausible behavioral target for individuals who are
not as psychologically-minded, or do not prefer cognitive
treatment approaches. Further, regulation of daily activities
123
456
may naturally complement existing treatment approaches
to mood disorders, such as behavioral activation, where
engagement in reinforcing daily activities is promoted.
In conclusion, the presented results are promising.
Future researchers would benefit from expounding on the
current analyses by measuring control, regularity, and
affect on the same time-scale. Moreover, measuring preference for regularity may yield a clearer picture of the
relationship between these three variables.
References
Ashman, S. B., Monk, T. H., Kupfer, D. J., Clark, C. H., Myers, F. S.,
Frank, E., et al. (1999). Relationship between social rhythms and
mood in patients with rapid cycling bipolar disorder. Psychiatry
Research, 86(1), 1–8. doi:10.1016/S0165-1781(99)00019-0.
Bollini, A. M., Walker, E. F., Hamann, S., & Kestler, L. (2004). The
influence of perceived control and locus of control on the cortisol
and subjective responses to stress. Biological Psychology, 67(3),
245–260. doi:10.1016/j.biopsycho.2003.11.002.
Bookwala, J., & Fekete, E. (2009). The role of psychological
resources in the affective well-being of never-married adults.
Journal of Social and Personal Relationships, 26(4), 411–428.
doi:10.1177/0265407509339995.
Bradburn, N. M. (1969). The structure of psychological well-being.
Chicago: Aldine.
Bye, D., & Pushkar, D. (2009). How need for cognition and perceived
control are differentially linked to emotional outcomes in the
transition to retirement. Motivation and Emotion, 33(3),
320–332. doi:10.1007/s11031-009-9135-3.
Deci, E. L., & Ryan, R. M. (2000). The’’ what’’ and’’ why’’ of goal
pursuits: Human needs and the self-determination of behavior.
Psychological Inquiry, 11(4), 227–268. doi:10.1207/
S15327965PLI1104_01.
DeNeve, K. M., & Cooper, H. (1998). The happy personality: a metaanalysis of 137 personality traits and subjective well-being.
Psychological Bulletin, 124(2), 197–229. doi:10.1037/00332909.124.2.197.
Ehlers, C. L., Frank, E., & Kupfer, D. J. (1988). Social zeitgebers and
biological rhythms—A unified approach to understanding the
etiology of depression. Archives of General Psychiatry, 45(10),
948–952. doi:10.1001/archpsyc.1988.01800340076012.
Eizenman, D. R., Nesselroade, J. R., Featherman, D. L., & Rowe, J.
W. (1997). Intraindividual variability in perceived control in a
older sample: The MacArthur successful aging studies. Psychology and Aging, 12(3), 489.
Faul, F., Erdfelder, E., Lang, A. G., & Buchner, A. (2007). G*Power
3: A flexible statistical power analysis program for the social,
behavioral, and biomedical sciences. Behavior Research Methods, 39, 175–191. doi:10.3758/BF03193146
Frazier, P. A., Tix, A. P., & Barron, K. E. (2004). Testing moderator
and mediator effects in counseling psychology research. Journal
of Counseling Psychology, 51(1), 115. doi:10.1037/0022-0167.
51.1.115
Grandin, L. D., Alloy, L. B., & Abramson, L. Y. (2006). The social
zeitgeber theory, circadian rhythms, and mood disorders: Review
and evaluation. Clinical Psychology Review, 26(6), 679–694.
doi:10.1016/j.cpr.2006.07.001.
Ivanova, M. Y., & Israel, A. C. (2005). Family stability as a protective
factor against the influences of pessimistic attributional style on
123
Motiv Emot (2015) 39:448–457
depression. Cognitive Therapy and Research, 29(2), 243–251.
doi:10.1007/s10608-005-3167-0.
Lachman, M. E., Neupert, S. D., & Agrigoroaei, S. (2011). The
relevance of control beliefs for health and aging. Handbook of
the psychology of aging, 7, 175–190.
Lachman, M. E., & Weaver, S. L. (1998). The sense of control as a
moderator of social class differences in health and well-being.
Journal of Personality and Social Psychology, 74, 763–773.
doi:10.1037/0022-3514.74.3.763.
Monk, T. H., Kupfer, D. J., Frank, E., & Ritenour, A. M. (1991). The
Social Rhythm Metric (SRM): Measuring daily social rhythms
over 12 weeks. Psychiatry Research, 36(2), 195–207. doi:10.
1016/0165-1781(91)90131-8.
Monk, T. H., Reynolds, C. F., Kupfer, D. J., Hoch, C. C., Carrier, J.,
& Houck, P. R. (1997). Differences over the life span in daily
life-style regularity. Chronobiology International, 14(3),
295–306. doi:10.3109/07420529709001421.
National Survey of Midlife Development in the United States
(MIDUS II), 2004–2006. ICPSR04652-v6. Ann Arbor, MI:
Inter-university Consortium for Political and Social Research
[distributor], 2012-04-18. doi:10.3886/ICPSR04652.v6.
Ong, A. D., Bergeman, C. S., & Bisconti, T. L. (2005). Unique effects
of daily perceived control on anxiety symptomatology during
conjugal bereavement. Personality and Individual Differences,
38(5), 1057–1067. doi:10.1016/j.paid.2004.07.004.
Pearlin, L. I., & Schooler, C. (1978). The structure of coping. Journal
of Health and Social Behavior, 19, 2–21.
Prigerson, H. G., Reynolds, C. F, III., Frank, E., Kupfer, D. J.,
George, C. J., & Houck, P. R. (1994). Stressful life events, social
rhythms, and depressive symptoms among the elderly: An
examination of hypothesized causal linkages. Psychiatry
Research, 51(1), 33–49. doi:10.1016/0165-1781(94)90045-0.
Ryff, C. D., & Almeida, D. M. (2010). National Survey of Midlife in
the United States (MIDUS II): Daily Stress Project, 2004–2009.
ICPSR26841-v1. Ann Arbor, MI: Inter-university Consortium
for Political and Social Research [distributor], 2010-02-26.
doi:10.3886/ICPSR26841.v1.
Sheldon, K. M., Elliot, A. J., Kim, Y., & Kasser, T. (2001). What is
satisfying about satisfying events? Testing 10 candidate psychological needs. Journal of Personality and Social Psychology,
80, 325–339. doi:10.1037//O022-3514.80.2.325.
Skinner, E. A. (1995). Perceived control, motivation, and coping.
Thousand Oaks, CA: Sage.
Skinner, E. A. (1996). A guide to constructs of control. Journal of
Personality and Social Psychology, 71(3), 549–570. doi:10.
1037/0022-3514.71.3.549.
Sliwinski, M. J., Almeida, D. M., Smyth, J., & Stawski, R. S. (2009).
Intraindividual change and variability in daily stress processes:
findings from two measurement-burst diary studies. Psychology
and Aging, 24(4), 828. doi:10.1037/a0017925.
Steptoe, A., Leigh, E. S., & Kumari, M. (2011). Positive affect and
distressed affect over the day in older people. Psychology and
Aging, 26(4), 956–965. doi:10.1037/a0023303.
Tennstedt, S., Howland, J., Lachman, M. E., Peterson, E. W., Kasten,
L., & Jette, A. (1998). A randomized, controlled trial of a group
intervention to reduce fear of falling and associated activity
restriction in older adults. Journals of Gerontology: Psychological Sciences, 53B, P384–P392. doi:10.1093/geronb/53B.6.P384.
Watson, D., & Tellegen, A. (1985). Toward a consensual structure of
mood. Psychological Bulletin, 98, 219–235. doi:10.1037/00332909.98.2.219.
Windsor, T. D., & Anstey, K. J. (2010). Age differences in
psychosocial predictors of positive and negative affect: A
longitudinal investigation of young, midlife, and older adults.
Psychology and Aging, 25(3), 641–652. doi:10.1037/a0019431.
Motiv Emot (2015) 39:448–457
Wirz-Justice, A., Bromundt, V., & Cajochen, C. (2009). Circadian
disruption and psychiatric disorders: The importance of entrainment. Sleep Medicine Clinics, 4(2), 273–284. doi:10.1016/j.
jsmc.2009.01.008.
457
Zisberg, A., Gur-Yaish, N., & Shochat, T. (2010). Contribution of
routine to sleep quality in community elderly. Sleep, 33(4),
509.
123
Keep reading this paper — and 50 million others — with a free Academia account
Used by leading Academics

John Sutton
Macquarie University

Asimina M Ralli
National and Kapodistrian University of Athens

Timothy Jordan
İbn Haldun Üniversitesi

Cor Baerveldt
University of Alberta