doi: 10.1111/j.1365-3121.2006.00686.x
The Punjab foreland basin of Pakistan: a reinterpretation of zircon
fission-track data in the light of Miocene hinterland dynamics
Geoffrey Ruiz1 and Diane Seward2
1
10 rue X. Sigalon, GSC, 30700 Uzès, France; 2Geology Institute, ETH Zentrum, Zurich 8092, Switzerland
ABSTRACT
Sedimentary basins represent an archive of tectonic events of
the hinterland source regions. By determining the variation in
sediment lagtime over time, events can be distinguished which
may no longer be available as the source has been eroded. In
regions characterized by rapid exhumation this is most often
the case but the erosion products form a record of these events.
Detrital zircon fission-track ages from sediments of the Siwalik
basin, Pakistan, originally presented by Cerveny et al. (New
Perspectives in Basin Analysis, Springer-Verlag, New York, 1988,
p. 43), have been reinvestigated and reinterpreted using a
revised methodological approach. Detrital age populations
were determined from different stratigraphic levels and were
correlated through time in order to assess the change in lag
time over the stratigraphic section. This information was
combined with the many new ages from the hinterland to
further interpret events in the source region. The new investigation suggests that steady-state evolution has not always
existed. An overall trend of exhumation increasing by
0.1 mm Myr�1 (from 0.9 to 2.65 mm yr�1) from 18 Ma to the
present is evident with a major exception of a net pulse
between 11.7 and 10.9 Ma associated with an increase in
Introduction
Zeitler et al. (1982, 1986) and Zeitler
(1985) were the first to report zircon
fission-track (ZFT) ages on the basement rocks of northern Pakistan.
Since then, many more ZFT ages have
been determined – ranging from 120
to 0.5 Ma (e.g. Meigs et al., 1995;
Treloar et al., 2000; Gubler, 2001;
Zeilinger et al., 2001; D. Seward,
unpublished data, 2005) but in general
Neogene or younger (Fig. 1).
Because the drainage basins of the
palaeo- and modern-Indus were geographically extensive (Clift et al.,
2002; Clift and Blusztajn, 2005), covering many sub-tectonic blocks, each
with its own thermal history, a large
variation in ages must be expected in
the eroded material. Zeitler et al.
(1986) examined the age of the spectra
obtained from five units ranging in
stratigraphic age from 22 to 0 Ma.
Correspondence: Dr Geoffrey M. H. Ruiz,
10 rue Sigalon, 30700 Uzes, France. Fax:
+33 4 66 37 36 60; e-mail: geoffrey.ruiz@
gmail.com
248
sedimentation increasingly rich in hornblende. Earlier studies
suggested that at this time the source of the sediments was the
presently outcropping Kohistan Arc. We are able to demonstrate that this cannot be so but was rather the rapidly
exhuming Nanga-Parbat Haramosh syntaxis (> 2 mm yr�1) coevally with transpressional displacement along the Main
Karakorum Thrust, whereby the overlying Kohistan Arc sequences were removed. Furthermore, comparison of our
detrital thermochronological data set with another one from
the same basin and one from another foreland basin to the east,
in NW India suggest that the Himalayan orogenesis was
probably not synchronous for the late Early–Middle Miocene.
Overall, regions that undergoes today’s rapid uplift may be
useless to reconstruct earlier phases of exhumation as the
levels that may have yielded such info were eroded and
deposited into the adjacent basin(s). Such scenario is reproducible in most orogens as in the Himalaya in NW Pakistan
stressing the high potential of detrital thermochronological
studies to trace hinterland dynamics.
Terra Nova, 18, 248–256, 2006
Cerveny et al. (1988) presented a
slightly different approach as they
restored the present-day ZFT ages of
individual grains from eight Siwalik
and Rawalpindi Group samples (ranging in age from 18 to 4 Ma) back to
their ages at the time of deposition of
the sediments.
We have further re-utilized the data
set of Cerveny et al. (1988), statistically resolved individual ZFT age
populations, and plotted these age
groups against their revised stratigraphic age as detailed in Ruiz et al.
(2004). This allows an immediate
inspection of the changes in lagtime
and hence variations in cooling histories in the hinterland which can then
be correlated to regional tectonic
activity.
Geological framework
The Indus River and most likely the
palaeo-Indus and tributaries drain(ed)
the Northern Suture of Pakistan,
across the Kohistan and Ladakh arcs
that accreted to the southern margin
of the Asian plate between 102 and
85 Ma (Treloar et al., 2000), across
the Indus Suture [the Main Mantle
Thrust (MMT), Fig. 1]; later the
Indian Plate accreted at c. 55 Ma
(Treloar et al., 2000). Peak metamorphism was reached in the Pakistan
Himalaya during the Eocene (Treloar
and Rex, 1990) and was followed by
exhumation during the Early Miocene
that was driven by north vergent
extension (Burg et al., 1996). The
Main Boundary Thrust (MBT,
Fig. 1) separates the Lesser Himalaya
from the dominantly sedimentary
sequences of the foreland basin. Initial displacement on this thrust occurred prior to 9 Ma (Meigs et al.,
1995) most likely at c. 11 Ma as
evidenced by a net increase of tectonic
subsidence in the foreland basin to
the south of the MBT from 0.2–0.3 to
1 km Myr�1 (Burbank and Beck,
1989; Burbank et al., 1996). In the
foreland basin of Pakistan, the Siwalik and Rawalpindi Groups, welldated, thick molasse-type sequences
(Johnson et al., 1985; Gee, 1989), are
the Neogene record of exhumation in
the western Himalayas.
� 2006 Blackwell Publishing Ltd
�Terra Nova, Vol 18, No. 4, 248–256
G. Ruiz and D. Seward • The Punjab foreland basin of Pakistan
.............................................................................................................................................................
71°
36°
A
B
73°
74°
30 Ma
um
or te
k
ra la
Ka P
120 Ma
10
25 Ma
M
5M
a
a
KOHISTAN
?
15 Ma
8125
?
30 Ma
40 Ma
30 Ma
Trans- Ma
Indus 40
Ma
Chinji 50
Village
75°
MKT
15 Ma
20 Ma
20 Ma
20
M
a
1 Ma
KH
DA
LA
35°
72°
Quaternary
deposits
Tertiary
Molasse
deposits
Lesser
Himalaya
KohistanLadakh
Arc series
Rivers
NP-HM
T
MM
Indus River
LESSER HIMALAYA
34°
MBT
50 km
A
B
32°
CHINA
ST
AN
SRT
PA
KI
33°
INDIA
PUNJAB FORELAND BASIN
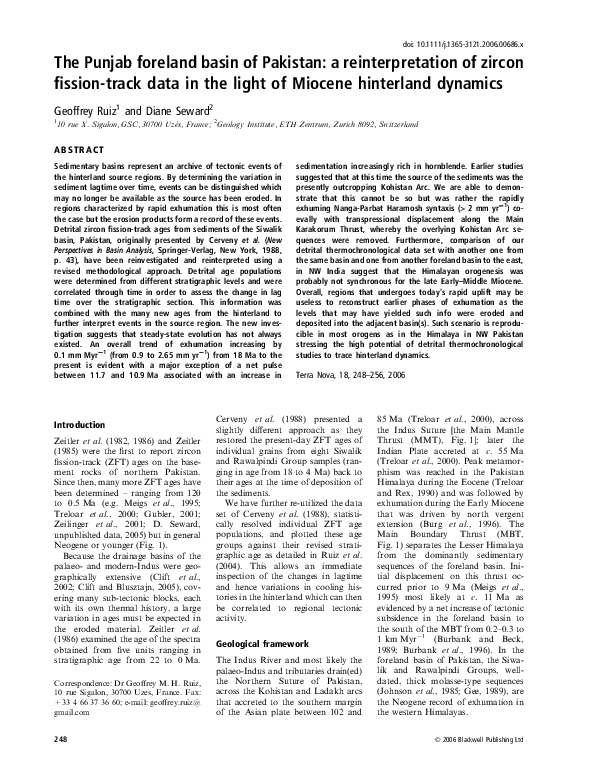
Fig. 1 Regional map of the Himalayan foreland of north-west Pakistan and
surrounding regions showing the locations of major faults, tectonic units and
drainage. Black circles represent the location of the Trans-Indus (A) and Chinji (B)
sections (Cerveny et al., 1988). MBT, Main Boundary Thrust; MMT, Main Mantle
Thrust; NP-HM, Nanga-Parbat Haramosh Massif; MKT, Main Karakorum Thrust;
SRT, Salt and Range Thrust. The black and white dashed lines represent zirconfission track (ZFT) age contours from the Kohistan, NP-HM and Lesser Himalaya
regions, where data are available. They are based on 46 ZFT ages (Zeitler, 1985;
Treloar et al., 2000; Gubler, 2001; Zeilinger et al., 2001; D. Seward, unpublished
data, 2001).
Methodology
The notion of lagtime as introduced
by Zeitler et al. (1986) corresponds to
the time taken for a mineral to be
cooled through its closure temperature, brought to the surface, and
transported to the depositional site.
Assuming negligible transport time
from source to basin, the lagtime can
be interpreted as an exhumation rate
in the source region after a series of
assumptions concerning the necessary
depth of closure are considered (Garver et al., 1999). In essence this implies
that as exhumation rate increases, the
lagtime decreases; the converse situation is also true (Ruiz et al., 2004).
The lagtime of the various age populations, (Pn), from within a sedimentary
horizon,
is
graphically
represented by the horizontal distance
� 2006 Blackwell Publishing Ltd
between the Pn population and the 1/1
line (Fig. 2). A point lying on the 1/1
line, i.e. where the detrital age is the
same as the stratigraphic age, represents either extremely fast denudation
in the hinterland or the incoming of
contemporary volcanic detritus. However, volcanism during the Miocene in
this region of the Himalayas can be
discounted (Cerveny et al., 1988).
The detrital ZFT (DZFT) data
from the Upper Rawalpindi (Kamlial
Fm.) and Siwalik Groups (Fig. 2;
Cerveny et al., 1988) have been recompiled and the stratigraphic ages
of levels from which they were
extracted updated using a newer
polarity time scale (Cande and Kent,
1995; Gautam and Rösler, 1999;
Fig. 3).
Detrital zircon fission-track age
populations were extracted from the
raw data using two different approaches (Table 1): (1) the Binomfit software of Brandon (1996). This is
based on a binomial peak fitting
meaning that the best-fit solution is
determined directly by comparing the
distribution of the grain data to a
predicted mixed binomial distribution
(for details see Stewart and Brandon,
2004). We used the automated version of the program that fitted the
F-test (Stewart and Brandon, 2004).
(2) The Sambridge and Compston
(1994) method using their Macmix
software was also employed. Differences between these two approaches
were negligible, i.e. age peaks overlapped (Table 1), validating the
separation of age components. In
consequence, data sets resulting from
approach (1) were used in this study.
The resulting DZFT age groupings
are termed P1 to Pn where P1 represents the youngest and Pn the oldest
population, within a single horizon.
The populations are plotted against
their stratigraphic age (Fig. 2) and the
different populations, Pn, are joined
together per rank forming the Dn
curves (Fig. 2) to investigate any possible genetic relationships (Ruiz et al.,
2004). The nature of the lines joining
the Pn points through time represents
meaningful trends. Such trends can be
resolved into five types (for details see
Ruiz et al., 2004). Those that are
pertinent in this report are (1) type 1,
which is identified by an increase in
both lagtime and detrital age upward
within the stratigraphic column and is
interpreted normally as an indication
of change of source region but may
also represent cannibalism of unreset
sediments (e.g. Ruiz et al., 2004) and
(2) type 5, with both a decreasing
lagtime and a decreasing age upwards
representing an increasing exhumation rate in the source region. When
the different Dn curves are parallel to
sub-parallel with each other, this
probably implies that the regional
source areas for the various (P1–Pn)
age populations experienced similar
cooling/exhumation rates, assuming
that a constant regional geothermal
gradient prevailed regionally and
through time (Ruiz et al., 2004). The
D1 patterns are the easiest to interpret
as there is less chance of multiple
events recorded in the ages. The
methodology is fully detailed in Ruiz
et al. (2004).
249
�The Punjab foreland basin of Pakistan • G. Ruiz and D. Seward
Terra Nova, Vol 18, No. 4, 248–256
.............................................................................................................................................................
Formations
D3
Soan/Ahmed
Zai Fms.
D2 D1
Pliocene
CK-5
type 1
*
5
Dokh Patan
Fm.
G10
*
CK-10
11.7
*
*
10
Nagri Fm.
type 5
Increase in
Hb. content
Chinji Fm.
14.0
1/1 correlation
line
Lagtime - P1
Kamlial Fm.
C1
minimum
lagtime value
*
15
*
Muree
Fm.
Rawalpindi Group
maximum
lagtime value
Miocene
Stratigraphic
D4
Pleistocene
Siwalik Group
D5
SERIES
*
age in Ma (td)
0
Indus
D1
D2
20 Ma
160
150
140
90
80
70
60
50
40
30
20
10
0
Detrital Zircon Fission-Track (DZFT) ages in Ma (tc)
Fig. 2 A comparison of the stratigraphic age (td, time of deposition indicated by arrows), and the detrital zircon fission-track
(DZFT) age of distinct FT age populations (tc, time of closure) from sedimentary formations of the foreland basin of northern
Pakistan (re-compiled from data presented in Cerveny et al., 1988). The data set is summarized in Table 1. Where possible, the
plotted points of each DZFT age population Pn are joined together in a linear fashion in order to construct the detrital curves Dn
(Ruiz et al., 2004). The 1/1 correlation line represents the limit below which detrital grain age populations must have been reset by
post-depositional heating in the basin. Error bars are ±2 standard deviation for population ages. The variation of the lagtime upsequence along the D1 curve is shaded in dark grey within 95% confidence (min. and max. lagtime value). Upper left corner: zoom
of the 11.7–4 Ma episodes for the D2 and D1 curves with the associated type 5 and 1 paths.
Results and interpretation
The number of grains counted for
each sample was about 80 (Cerveny
et al., 1988). At all horizons the samples failed the chi-square test indicating a multicomponent data set
(Gailbraith, 1981) while post-depositional resetting can be excluded (Najman et al., 2005). Thus, the ZFT data
represent the timing of cooling
through 260–215 �C in the source
region (Brandon et al., 1998) Firstorder results from the 730 individual
ZFT grain ages (Table 1) reveal populations ranging from 167 to 1.8 Ma
(Table 1A). Very few populations are
older than 80 Ma. These old grains
may be variably sourced, e.g. the
northern margin of the Indian Plate,
the Kohistan Arc, or the southern
margin of the Eurasia Plate where
bedrocks still yield such relatively old
ZFT ages (Fig. 1). A second cluster
ranging from 52 to 30 Ma is in complete agreement with identical
40
Ar/39Ar cooling ages determined on
muscovite extracted from Late Eocene–Early Oligocene sedimentary
rocks in the nearby Hazara-Kashmir
region to the east (Najman et al.,
2001). Overlapping ages from these
250
radiometric systems probably implies
rapid exhumation in the hinterland
because of progressive collision of the
Kohistan arc with the Indian-Pakistan
plate since 55 Ma.
The high representation of ages
younger than 30 Ma suggests extensive exhumation since 30 Ma in the
hinterland, which is once again in
agreement with 40Ar/39Ar muscovite
Early Miocene cooling ages extracted
from molasse-type deposits in northwestern India (Najman et al., 1997)
and with the documented post-metamorphic cooling history of the internal Himalayan zone in northern
Pakistan (Treloar et al., 2000).
The oldest sample (C1, Table 1)
reveal a lagtime value of c. 5 to
15 Ma that is in agreement with the
lagtime value produced on detrital
40
Ar/39Ar mica ages on a sandstone
with identical stratigraphic age
(18 Ma; Najman et al., 2003) that
was sampled in the same region.
The most likely source of the youngest P1, i.e. 1.8 ± 0.4 Ma (Table 1)
present in the Indus River (Fig. 1) at
the Chinji section is the Nanga ParbatHaramosh Massif (NP-HM; Fig. 1),
which yields ÔtodayÕ the youngest ZFT
ages of 0.5–2 Ma (Zeitler, 1985;
Treloar et al., 2000; Fig. 1). Other age
groups also exist within this fluvial
deposit; the oldest DZFT population (P7; Table 1) has an age of
55.4 ± 7.3 Ma. These old ages are
most likely sourced from regions
located to the north-west, where ZFT
ages between 50 and 60 Ma (Fig. 1)
have been determined (Zeitler, 1985;
Gubler, 2001), but may also be due to
cannibalism of preexisting sedimentary
rocks (Zeitler et al., 1986) because
similar ages are recorded within the
Miocene–Pliocene
series
(Fig. 2,
Table 1).
Samples K7 and G1 from sites A
and B (Fig. 1) have almost identical
stratigraphic ages, i.e. 13.8–14.1 Ma
as samples CK-11 and G5 (Table 1;
Fig. 4). The youngest population of
each is the same within 2 r (Table 1).
Assuming that the sources for both
sites were similar, we feel it is reasonable to combine data from these two
pairs of samples to increase the reliability of peak-fitting procedure.
Hence, this generates two samples
labelled 14.0 and 11.7 (Table 1;
Fig. 2). The Chinji and Trans-Indus
sections are thus joined together in
Fig. 2 to increase the precision in the
changing Dn patterns in the light of
� 2006 Blackwell Publishing Ltd
�Terra Nova, Vol 18, No. 4, 248–256
G. Ruiz and D. Seward • The Punjab foreland basin of Pakistan
.............................................................................................................................................................
Fig. 3 Updated polarity time scale of the Siwalik group in northern Pakistan.
Stratigraphic ages of sand samples from the Chinji section (C1, G1, G5 and G10)
were corrected using their observed polarity (Cerveny et al., 1988) and recent polarity
time scale (Cande and Kent, 1995; Gautam and Rösler, 1999). The stratigraphic ages
of sand samples from the Trans-Indus section (CK10, CK11 and K7) were corrected
the same way using their assumed stratigraphic age in 1988 because observed polarity
was not reported (Cerveny et al., 1988).
cooling/tectonic activity in the source
region. The commonality of the trends
of the Dn curves is thus quite remarkable. We believe that this is not an
artefact of the method of dividing the
populations (Ruiz et al., 2004). From
12 Ma onwards all Dn curves are subparallel or parallel to the D1 line with
a marked decrease in lagtime between
12 and 10.9 Ma (a strong type 5 path;
Ruiz et al., 2004); the ZFT and depositional ages of the youngest population (P1) of sample CK-10 are
identical within error bars at approximately 10.9 Ma, implying that source
rocks were cooling at extremely high
rates yielding exhumation rates
> 2 mm yr�1 (Table 1). For comparison, such rates are currently found in
the NP-HM region. It is followed by
an increase in lagtime from 10.9 to
� 2006 Blackwell Publishing Ltd
9.2 Ma (type 1 path). Subsequently
and until today, lagtime decreases
along a type 5 path (Fig. 2) that is
characteristic of accelerating exhumation of the source region (Ruiz et al.,
2004).
Discussion
The data set based on the P1 populations for the 18–0 Ma period fits a
linear relationship (R2 ¼ 0.94) suggesting that the exhumation rate has
been increasing by 0.1 mm Myr�1
since
18 Ma
(from
0.9
to
2.65 mm yr�1, Fig. 2) with the exception of a net pulse between 11.7 and
10.9 Ma. Najman et al. (2003) reported short lagtime values (0–6 Myr)
from detrital mica ages in the Kamlial
Fm. in the same locations since
c. 18 Ma until 13.9 Ma and concluded, on the basis of sediment petrography and detrital thermochronology
that the uplift of the NPHM initiated
by this time. White et al. (2002) using
the same methodology evidenced a
rapid phase of exhumation in the
Himalayan range of NW India for
the time of deposition of the lower
Dharamsala Fm. (21–17 Ma) while
lagtime values for the upper Dharamsala Fm. and Lower Siwalik (17–
12.5 Ma) are larger, i.e. 7–8 to
10 Myr. The combination of these
data sets from the foreland basins of
NW Pakistan to the west and NW
India to the east, with our results
clearly suggests a diachroneity of
exhumation in the hinterland for the
late Early–Middle Miocene, while
Najman et al. (2005) concluded that
this may not have been the case for the
early development of the Himalayan
chain in the Eocene.
The identification of accelerated
exhumation (Table 1, > 2 mm yr�1)
within the source regions between 11.7
and 10.9 Ma is the major feature of
this re-evaluation of Cerveny et al.Õs
(1988) data set. This period is contemporaneous with (1) a significant
increase in blue–green hornblende
content in the heavy mineral fraction
in the upper Chinji Formation and the
Nagri Formation, i.e. from c. 5% to
40% (Cerveny et al., 1989), (2) a
twofold increase in sedimentation
rates from the Chinji to the Nagri
Formations (Zeitler et al., 1986), and
(3) an important interval of thrust
loading by the MBT in the basin
beginning at c. 11 Ma (Burbank and
Beck, 1989) but which may have
occurred slightly earlier as suggested
by the refinement of stratigraphic ages
(Fig. 3).
The observed change in the heavy
mineral assemblage was, according to
Cerveny et al. (1989) and Willis
(1993), unequivocal evidence that the
blue-schist to amphibolite grade rocks
identified in the Kohistan arc terrane
were the only possible source. However, any potential source region for
the P1 population must have, today,
ZFT ages younger than 12 Ma. No
ZFT ages < 12 Ma have yet been
obtained from the bedrocks of Kohistan arc (Fig. 1). This implies then,
that the present outcropping arc, even
though it contains abundant blue–
green hornblende, cannot have been
251
�Site
(A) Binomfit separation
Indus
0
0.0
CK-5 (T)
4
4.0
G10 (Ch) 7.9
9.2
CK-10 (T)
10
10.9
G5 (Ch) 10.8
11.5
CK-11 (T)
11
11.8
G1 (Ch)
14
13.8
K7 (T)
14
14.1
C1 (Ch)
18
18.0
Combined
CK11-G5
–
11.7
K7-G1
–
14.0
Site
Strat. 1
(Ma)
0
0
0
0
0
0
0
0
0
159 0
162 0
Strat. 2
(Ma)
1.8
6.4
13.7
12.2
15.9
16.8
16.6
19.7
27.7
+0.5
+1.2
+1.4
+1.2
+2.1
+1.5
+2.5
+1.8
+5.3
6.9
8.7
33.8
28.4
16.0
29.2
5.3
26.6
17.8
1.8
2.4
4.5
1.3
4.4
5.0
2.8
5.6
9.7
±
±
±
±
±
±
±
±
±
27.4
15.0
31.7
24.6
36.6
51.9
37.1
26.3
45.8
10.8
16.9
37.5
31.8
43.4
66.7
43.8
62.7
68.8
P(v )
Age
95% CI
to
to
to
to
to
to
to
to
to
+0.9
+2.1
+4.1
+3.0
+4.2
+2.3
+3.2
+5.9
+8.5
95% CI
%
Age
95% CI
%
34.3
42.1
26.1
22.0
33.5
19.0
40.3
39.0
36.5
19.8
28.4
85.7
63.9
93.6
–
75.7
163.5
–
�1.6 to +1.7
�3.5 to +4.0
�12.2 to +14.2
�5.3 to +5.8
�11.0 to +12.5
–
�7.6 to +8.4
�22.6 to +26.2
–
24.1
29.0
8.4
25.0
13.9
–
17.2
10.0
–
55.4
61.1
–
–
–
–
–
–
–
�6.8 to +7.8
�11.8 to +14.7
–
–
–
–
–
–
–
7.3
5.2
–
–
–
–
–
–
–
�5.1 to +5.5
�4.8 to +5.1
26.8 164.1 �22.2 to +25.6 5.6
26.0 167.0 �19.6 to +22.2 5.7
23.3 �2.4 to +2.7 24.3 36.3 �3.9 to +4.4 28.6 64.9
25.9 �1.8 to +1.9 25.9 42.5 �2.9 to +3.1 32.9 66.6
P2
to
to
to
to
to
to
to
to
to
Age
1.2–2.0
1.4–3.0
�0.8
�1.8
�3.7
�3.0
�3.8
�2.2
�3.0
�5.4
�7.6
P3
%
Age
95% CI
to
to
to
to
to
to
to
to
to
P5
%
15.8 �1.4 to +1.5 14.7 4.1 ± 1.4
17.2 �1.2 to +1.6 9.5 3.2 ± 1.4
P1
N
Age 95% CI
5.3
10.1
21.7
17.8
23.4
29.6
26.6
37.9
43.5
2
+0.5
+1.5
+2.8
+2.0
+2.3
+2.3
+1.9
+4.7
+6.7
%
2.3–3.0
1.8–3.0
1.2–1.7
2.0–9.0
1.1–2.2
1.0–1.7
1.3–5.3
0.9–1.5
0.4–1.4
�0.5
�1.4
�2.5
�1.8
�2.1
�2.2
�1.8
�4.2
�5.8
to
to
to
to
to
to
to
to
to
P4
0.4
1.0
1.3
1.1
1.9
1.5
2.3
1.7
4.9
�0.4
�1.0
�1.3
�1.1
�1.8
�1.4
�2.2
�1.6
�4.4
to
to
to
to
to
to
to
to
to
%
P3
P4
%
Age
95% CI
to
to
to
to
to
to
to
to
to
P5
%
Age
95% CI
%
�1.8 to +1.8
�2.4 to +2.4
�22.2 to +22.2
�4.6 to +4.6
�12.6 to +12.6
�8.8 to +8.8
�8.8 to +8.8
�26.8 to +26.8
–
20
25
5
20
9
7
11
6
–
49.1
36.1
–
–
–
–
–
–
–
�9.0 to +9.0
�6.4 to +6.4
27
35
81.2
215.4
0.0
4.0
9.2
10.9
11.5
11.8
13.8
14.1
18.0
83
80
80
84
79
80
80
82
80
0
0
0
0
0
0
0
0
0
1.9
6.3
13.4
11.3
15.8
15.4
16.5
18.7
25.4
�0.6
�1.2
�1.2
�1.0
�1.8
�1.2
�2.2
�1.4
�3.4
+0.6
+1.2
+1.2
+1.0
+1.8
+1.2
+2.2
+1.4
+3.4
5
7
31
22
15
27
6
23
11
5.1
9.5
21.7
16.8
23.1
22.4
26.3
37.7
37.7
�0.6
�1.4
�2.8
�1.8
�2.0
�2.0
�1.6
�5.0
�4.2
+0.6
+1.4
+2.8
+1.8
+2.0
+2.0
+1.6
+5.0
+4.2
23
10
24
24
30
26
32
24
34
10.3
15.0
37.8
30.6
42.5
31.7
43.2
60.8
59.2
�1.0
�1.4
�3.6
�3.2
�4.6
�5.2
�2.8
�6.4
�6.8
+1.0
+1.4
+3.6
+3.2
+4.6
+5.2
+2.8
+6.4
+6.8
28
30
20
18
25
20
33
29
35
18.7
22.6
89.3
59.4
91.6
72.9
69.7
138.2
–
11.7
14.0
159
162
0
0
15.3
16.7
�1.0 to +1.0
�1.6 to +1.6
32
18
22.4
25.6
�2.0 to +2.0
�1.6 to +1.6
48
46
31.7
42.9
�5.2 to +5.2
�2.6 to +2.6
37
59
45.8
67.9
Age
95% CI
%
�7.2 to +7.2
�6.2 to +6.2
–
–
–
–
–
–
–
5.0
8.0
–
–
–
–
–
–
–
�13.0 to +13.0
�57.0 to +57.0
15
4
Terra Nova, Vol 18, No. 4, 248–256
� 2006 Blackwell Publishing Ltd
(B) Macmix separation
Indus
0
CK-5 (T)
4
G10 (Ch)
7.9
CK-10 (T)
10
G5 (Ch)
10.8
CK-11 (T)
11
G1 (Ch)
14
K7 (Ch)
14
C1 (Ch)
18
Combined
CK11-G5
–
K7-G1
–
83
80
80
84
79
80
80
82
80
P(v2) Age 95% CI
Exhumation P2
rate
Lagtime
(Myr) ± 2r (mm yr�1)
Age 95% CI
The Punjab foreland basin of Pakistan • G. Ruiz and D. Seward
P1
Strat. 1 Strat. 2
(Ma)
(Ma)
N
.............................................................................................................................................................
252
Table 1 Zircon fission-track age populations (in Ma) from the Miocene to Recent Siwalik and Rawalpindi Group sediments of northern Pakistan – using the data of Cerveny
(1988). For sample localities see Fig. 1. Abbreviations for the sections are: T (Trans-Indus) and Ch (Chinji). The initial stratigraphic age (in Ma) of each dated level (Strat. 1,
Cerveny et al., 1988) was corrected using recent revisions of the geological time scale (Strat. 2, Cande and Kent 1995, Gautam and Rösler, 1999 – see Fig. 4). N represents the
number of grains analysed. Combined: data from samples with similar stratigraphic ages from the Chinji and trans-Indus sections, i.e. G5 (Ch – 11.5 Ma) – CK11 (T – 11.8 Ma), and
G1 (Ch – 13.8 Ma) – K7 (T – 14.1 Ma) were mixed and compiled to increase the reliability of peak-fitting procedure. The P(v2) value is used to distinguish the possible presence of
multi-components. When the distribution of detrital cooling ages from a particular sedimentary rock yields a P(v2) value of less than 5% (Gailbraith, 1981, and reply, pp. 485–488),
it is assumed that more than one age population is present. (A) Peak ages or populations (Pn) and 95% confidence interval were estimated using binomial-fit method (Gailbraith and
Green, 1990) – note that there is no overlapping. Exhumation rate calculations (in mm yr�1) are based on the lagtime (in Myr) of the P1 populations (see Garver et al., 1999 for
details). % ¼ per cent of total number of dated grains in individual peak. (B) Below: age peak fitting (95% confidence) obtained with macmix software. %: number of grains
attributed to each population.
�Terra Nova, Vol 18, No. 4, 248–256
G. Ruiz and D. Seward • The Punjab foreland basin of Pakistan
253
.............................................................................................................................................................
� 2006 Blackwell Publishing Ltd
Fig. 4 Radial plots (Gailbraith, 1990) for zircon fission-track age determinations of nine samples from the Miocene basin fill series in northern Pakistan. The different peaks or age
populations (Pn) were separated using Binomfit software, version 1.0.51 (Brandon, 1996; Table 1). The x-axis corresponds to the precision for each grain or relative error, precision
increases to the right along the horizontal scale (see Brandon, 1996 for details). Two pairs of samples, one from each sample site were mixed because they have almost identical
stratigraphic ages, and are labelled 14.0 and 11.7.
�The Punjab foreland basin of Pakistan • G. Ruiz and D. Seward
Terra Nova, Vol 18, No. 4, 248–256
.............................................................................................................................................................
the major source for the P1 population
during the Late Miocene. ZFT ages
that are < 12 Ma are only encountered within bedrocks of northern
Pakistan in the region of the NP-HM
(Fig. 1).
The NP-HM is bounded to (1) the
east and west by the Ladakh and
Kohistan arcs, respectively and (2) to
the north by the rapidly exhuming
Karakorum range (Lemennicier et al.,
1996; Villa et al., 1996; Rolland et al.,
2001), and separated from them,
respectively, by the MMT and the
Main Karakorum Thrust (MKT,
Fig. 1). Prior to the exhumation of
the NP-HM, this region was also
overlain by suites similar to the arcs
that now border it – hence a possible
source of the blue–green hornblendes.
Thus, we conclude that the eroded
cover of the NP-HM is the strong
contender for the source of this population at this time. The palaeo-Indus,
an antecedent system, was eroding
rapidly cutting through the growing
anticline, thus removing the upper arc
suites and transporting the detritus to
the foreland basins. Based on geochronological constraints Treloar
et al. (2000) concluded that early
doming of the NP-HM massif predated 9 Ma which is corroborated by
bodily uplift along vertical shears at
9 Ma along the western margin of the
NP-HM (Reddy et al., 1997), while
Najman et al. (2003) suggest that
initiation of uplift/exhumation in the
NPHM region began at c. 18 Ma
based on a detrital 40Ar/39Ar study.
Schneider et al. (2001) revisited the
geological constraints on the tectonic
evolution of the NPHM. The authors
concluded that a crustal scale doming
occurred by the Late Miocene in the
NPHM region that can be traced
further north and east in the Karakorum range. Such phase would be
related to transpression along the
South Karakorum Fault (Pecher and
Le Fort, 1999; Fig. 1). Such doming is
in accord with the rapid phase of
exhumation we evidenced for the Late
Miocene at c. 11.7 Ma through the
dating of syn-orogenic sediments.
A change of source region is induced for the 10.9–9.2 Ma period
from the D1�3 curves (Fig. 2). This
corresponds to a period of increasing
thrust loading by the MBT in the
basin (Burbank and Beck, 1989). Such
movement along the MBT may have
254
uplifted the proximal series of the
foreland basin of Pakistan. Cannibalized material from these units most
likely hosted slightly older DZFT ages
than those derived from the NP-HM,
but similar to the ones present in
the older formations (sample G10;
Table 1; Fig. 2).
At the end of this phase, from
9.2 Ma to present-day (Fig. 2), no
major events can be detected because
the resolution of this data set is low
and based only on three samples
(G10, CK-5 and Indus; Fig. 2). It is
thus impossible to trace from our data
sets the reorganization of the western
Himalayan river system 5 Ma as evidenced by Clift and Blusztajn (2005)
by Nd isotopic measurements and
seismic reflection data in the Indus
fan.
The young ages of 1.8 Ma today
in the bedload of the Indus River
suggest an exhumation rate in the
order of 2–3 mm yr�1 that is in
agreement with rapid denudation (c.
3–5 mm yr�1) in the NP-HM evidenced for the Pliocene–Pleistocene
based on petrologic and U/Pb data
on zircon and monazites (Zeilter
et al., 1993) as well as sediment
budget (Garzanti et al., 2005). This
phase is associated with rapid cooling, deformation as a pop-up structure, anatectic melting and granulitegrade
metamorphism
(Schneider
et al., 2001). The younger ages are
also synchronous with major subsidence in the Peshawar and Kashmir
basins on either side of the syntaxis
(Burg and Podladchikov, 2000). Present-day thermochronological ages
from the NPHM region are too
young (< 2 Ma) to reconstruct earlier phases of exhumation as the
levels that may have yielded such
info were eroded and deposited into
the basin. This explains why some
earlier studies (e.g. Zeilter et al.,
1993) erroneously concluded that
doming in the NP-HM region was
restricted to very recent times.
region of the Himalayan orogeny is in
a constructional phase and was diachronous for the late Early–Middle
Miocene from NW Pakistan to NW
India.
The event identified between 11.7
and 10.9 Ma as a phase of rapid
exhumation is coincident with the
increase of blue–green hornblendes
in the sedimentary sequences. The
Kohistan Arc has previously been
cited as the sole source of these
minerals. But the many new fissiontrack ages of rocks presently exposed
in the Kohistan arc are all older than
12 Ma, negating this possibility. A
potential region with the prerequisite
younger zircon ages was the region of
the growing NP-HM syntaxis. The
down cutting palaeo-Indus, and its
tributaries, removed the upper sections of the syntaxis-arc material –
the Kohistan lateral equivalent –
before exposing the underlying sequence of the Indian subcontinent.
The conclusions imply that the doming of the NP-HM region have accelerated at c. 11.7 Ma and was related
to transpressional displacement along
the MKT.
The combination of all data sets
from both the hintherland and adjacent Punjab foreland basin in NW
Pakistan suggests that the NPHM
region underwent more than one rapid
phases of uplift: an early uplift at c.
18 Ma, a rejuvenation of doming at c.
11.7 Ma, and a more recent uplift
since the Plio-Quaternary as a pop-up
structure that generates very young
ZFT ages (i.e. 1.8 Ma) in the presentbedload of the Indus river.
Acknowledgements
The authors thank Nancy Naeser for
access to the raw data sets in the thesis of
Cerveny (1986), Prof. Jean-Pierre Burg, Dr
Zeilinger, Vroni Gubler, Dr Jagoutz, and
Dr Salichon for discussions on the regional
geology of the Himalayas. Special thanks
to Andrew Carter (Birbeck College, London) for the age component separation
with Macmix software.
Conclusions
Detrital grain ages of the Siwalik or
Punjab basin in northern Pakistan
reveal an increase in exhumation rate
since 18 Ma taking place in the source
region. This implies that there has not
been a steady state of erosion from
early Mid-Miocene to Recent. This
References
Brandon, M.T., 1996. Probability density
plot for fission-track grain-age samples:
Radiat. Meas., 26, 663–676.
Brandon, M.T., Roden-Tice, M.K. and
Garver, J.I., 1998. Late Cenozoic exhumation of the Cascadia accretionary
� 2006 Blackwell Publishing Ltd
�Terra Nova, Vol 18, No. 4, 248–256
G. Ruiz and D. Seward • The Punjab foreland basin of Pakistan
.............................................................................................................................................................
wedge in the Olympic Mountains, NW
Washington State. Geol. Soc. Am. Bull.,
110, 985–1009.
Burbank, D.W. and Beck, R.A., 1989.
Synchronous sediment accumulation,
decompaction and subsidence in the
Miocene foreland basin of northern
Pakistan. In: Tectonics of the Western
Himalayas (L.L. Malinconico Jr and
R.J. Lille, eds), Geological Society of
America, 232, 113–128.
Burbank, D.W., Beck, R.A. and Mulder,
T. 1996. The Himalayan foreland.
In: Asian Tectonics (Y. An and M.
Harrison, eds), pp. 149–188.
Cambridge University Press,
Cambridge.
Burg, J.-P. and Podladchikov, Y., 2000.
From buckling to asymmetric folding of
the continental lithosphere: numerical
modelling and application to the Himalayan syntaxis. Spec. Publ.-Geol. Soc.
Lond., 170, 219–236.
Burg, J.P., Chaudhry, M.N., Ghazanfar,
M., Anczkiewicz, R. and Spencer, D.,
1996. Structural evidence for back
sliding of the Kohistan arc in the collisional system of northwest Pakistan.
Geology, 24, 739–742.
Cande, S.C. and Kent, D.V., 1995. Revised
calibration of the geomagnetic polarity
timescale for the late Cretaceous and
Cenezoic. J. Geophys. Res. (B4), 100,
6093–6096.
Cerveny, P.F., 1986. Uplift and erosion in
the Himalaya over the past 18 million
years: evidence from fission-track dating
of detrital zircons and heavy mineral
analysis. Master thesis, Dartmouth
College, Hanover, NH.
Cerveny, P.F., Naeser, N.D., Zeitler, P.K.,
Naeser, C.W. and Johnson, N.M., 1988.
History of uplift and relief of the
Himalaya during the past 18 million
years: evidence from fission-track ages of
detrital zircons from sandstones from the
Siwalik Group. In: New Perspectives in
Basin Analysis (K.L. Kleinspehn and
C. Paola, eds), pp. 43–61. Springer-Verlag, New York.
Cerveny, P.F., Johnson, N.M., Tahirkheli,
R.A.K. and Bonis, N.R., 1989. Tectonic
and geomorphic implications of Siwalik
Group heavy minerals, Potwar Plateau,
Pakistan. In: Tectonics of the Western
Himalayas (L.L. Malinconico Jr and
R.J. Lille, eds), Geol. Soc. Am. Spec.
Pap., 232, 129–136.
Clift, P.D. and Blusztajn, J., 2005. Reorganization of the western Himalayan
river system after five million years ago.
Nature, 438, 1001–1003.
Clift, P.D., Lee, J.I., Hildebrand, P.,
Shimizu, N., Layne, G.D., Blusztajn, J.,
Blum, J.D., Garzanti, E. and Khan,
A.A., 2002. Nd and Pb isotope variability in the Indus River System: implications for sediment provenance and
� 2006 Blackwell Publishing Ltd
crustal heterogeneity in the Western
Himalaya. Earth Planet. Sci. Lett., 200,
91–106.
Gailbraith, R.F., 1981. On statistical
models for fission tracks counts. Math.
Geol., 13, 471–478
Gailbraith, R.F., 1990. The radial plots:
graphical assessment of spread in ages.
Nucl. Tracks Radiat. Meas., 17, 207–214.
Gailbraith, R.F., and Green, P.F., 1990.
Estimating the component ages in a
finite mixture. Nuclear Tracks and
Radiation Measurements, 17, 197–206.
Garver, J.I., Brandon, M.T., Roden-Tice,
M., and Kamp, P.J.J. 1999. Erosional
denudation determined by fission-track
ages of detrital apatite and zircon. In:
Exhumation Processes: Normal Faulting,
Ductile Flow, and Erosion (U. Ring,
M.T. Brandon, S.D. Willett and G.S.
Lister, eds), Geol. Soc. Lond. Spec. Publ.,
154, 283–304.
Garzanti, E., Vezzoli, G., Andò, S., Paparella, P. and Clift, P.D., 2005. Petrology
of Indus River sands: a key to interpret
erosion history of the western Himalayan Syntaxis. Earth Planet. Sci. Lett., 229,
287–302.
Gautam, P. and Rösler, W., 1999. Depositional chronology and fabric of Siwalik
group sediments in Central Nepal from
magnetostratigraphy and magnetic anisotropy. J. Asian Earth Sci., 17, 659–
682.
Gee, E.R., 1989. Overview of the geology
and structure of the Salt Range, with
observations on related areas of northern Pakistan. In: Tectonics of the
Western Himalayas (L.L. Malinconico Jr
and R.J. Lille, eds), Geol. Soc. Am. Spec.
Pap., 232, 95–112.
Gubler, V., 2001. Fission track analysis in
north Pakistan. Unpublished MSc thesis,
ETH Zurich, Switzerland, 71 pp.
Johnson, N.M., Stix, J., Tauxe, L., Cerveny, P.F. and Tahirkheli, R.A.K., 1985.
Paleomagnetic chronology, fluvial processes and tectonic implications of the
Siwalik deposits near Chinji Village,
Pakistan. J. Geol., 93, 27–40.
Lemennicier, Y., Le Fort, A, Lombardo,
B., Pêcher, A. and Rolfo, F., 1996.
Tectonometamorphic evolution of the
central Karakorum (Baltistan – northern
Pakistan). Tectonophysics, 260, 119–143.
Meigs, A.J., Burbank, D.W. and Beck,
R.A., 1995. Middle–Late Miocene
(>10 Ma) formation of the Main
Boundary Thrust in the western Himalaya. Geology, 23, 423–426.
Najman, Y.M.R., Pringle, M.S., Johnson,
M.R.W., Robertson, A.H.F. and Wijbrans, J.R., 1997. Laser 40Ar/39Ar dating
of single detrital muscovite grains from
early foreland-basin sedimentary deposits in India; implications for early
Himalayan evolution. Geology, 25,
535–538.
Najman, Y.M.R., Pringle, M.S., Godin, L.
and Grahame, O., 2001. Dating of the
oldest continental sediments from the
Himalayan foreland basin. Nature, 410,
194–197.
Najman, Y., Garzanti, E., Pringle, M.,
Bickle, M., Stix, J. and Khan, I., 2003.
Early–Middle Miocene paleodrainage
and tectonics in the Pakistan Himalaya.
Geol. Soc. Am. Bull., 115, 1265–1277.
Najman, Y., Carter, A., Oliver, G. and
Garzanti, E., 2005. Provenance of
Eocene foreland sediments, Nepal:
constraints on the timing and diachroneity of early Himalayan orogenesis.
Geology, 33, 309–312.
Pecher, A. and Le Fort, P., 1999. Late
Miocene tectonic evolution of the
Karakorum-Nanga Parbat contact zone
(northern Pakistan). In: Himalaya and
Tibet: Mountain Roots to Mountain Tops
(A. Macfarlane, J. Qude and R. Sorkhabi, eds), Geol. Soc. Am. Spec. Pap.,
328, 145–158.
Reddy, S.M., Kelley, S.P. and Magennis,
L., 1997. A microstructural and argon
laserprobe study of shear zone development at the western margin of the Nanga
Parbat-Haramosh Massif, western
Himalaya. Contrib. Mineral. Petrol.,
128, 16–29.
Rolland, Y., Maheo, G., Guillot, S. and
Pêcher, A., 2001, Tectono-metamorphic
evolution of the Karakoram Metamorphic Complex (Skardu area, NW Himalaya): case of a mid-crustal granulite
exhumation in a transpressive context.
J. Metamorphic Geol., 19, 717–737.
Ruiz, G.M.H., Seward, D. and Winkler,
W., 2004. Detrital thermochronology – a
new perspective on hinterland tectonics,
an example from the Andean Amazon
Basin, Ecuador. Basin Res., 16, 413–430.
Sambridge, M.S. and Compston, W., 1994.
Mixture modelling of multi-components
data sets with application to ion-probe
zircon ages. Earth Planet. Sci. Lett., 128,
373–390.
Schneider, D.A., Zeitler, P.K., Kidd,
W.S.F. and Edwards, M.A., 2001. Geochronological constraints on the Tectonic Evolution and Exhumation of
Nanga Parbat, Western Himalaya Syntaxis, revisited. J. Geol., 109, 563–583.
Stewart, R.J. and Brandon, M.T., 2004.
Detrital zircon fission-track ages for the
ÔÔHoh FormationÕÕ: Implications for late
Cenozoic evolution of the Cascadia
subduction wedge. Geological Society of
America Bulletin, 116, 60–75.
Treloar, P.J. and Rex, D.C., 1990. Cooling,
uplift and exhumation rates in the crystalline thrust stack of the northern Indian Plate, west of the Nanga Parbat
syntaxis. Tectonophysics, 180, 323–349.
Treloar, P.J., Rex, D.C., Guise, P.G.,
Wheeler, J., Hurford, A.J. and Carter, A.,
2000. Geochronological constraints on
255
�The Punjab foreland basin of Pakistan • G. Ruiz and D. Seward
Terra Nova, Vol 18, No. 4, 248–256
.............................................................................................................................................................
the evolution of the Nanga Parbat syntaxis, Pakistan Himalaya. In: Tectonics of
the Nanga Parbat Syntaxis and the Western Himalaya (M.A. Khan, P.J. Treloar,
M.P. Searle and M.Q. Jan, eds), Geol.
Soc. Lond. Spec. Publ., 170, 137–162.
Villa, I.M., Lemmenicier, Y. and Le Fort,
P., 1996. Late Miocene to Early Pliocene
tectonometamorphism and cooling in
south-central Karakorum and IndusTsangpo suture, Chogo Lungma area
(NE Pakistan). Tectonophysics, 260,
201–214.
White, N.M., Pringle, M.S., Garzanti, E.,
Bickle, M.J., Najman, Y.M.R., Chapman, H. and Friend, P., 2002. Constraints on the exhumation and erosion
of the High Himalayan Slab, NW India,
from foreland basin deposits. Earth
Planet. Sci. Lett., 195, 29–44.
256
Willis, B., 1993. Evolution of Miocene
fluvial systems in the Himalayan foredeep through a two kilometer-thick
succession in northern Pakistan. Sed.
Geol., 88, 77–121.
Zeilinger, G., Burg, J.-P., Schaltegger, U.
and Seward, D., 2001. New U/Pb and
fission track ages and their implication
for the tectonic history of the Lower
Kohistan Arc Complex, Northern
Pakistan. XI EUG Conference, Strasbourg, France, p. 338.
Zeilter, P.K., Chamberlain, C.P. and
Smith, H.A., 1993. Synchronous anatexis, metamorphism, and rapid denudation at Nangat Parbat (Pakistan
Himalaya). Geology, 21, 347–350.
Zeitler, P.K., 1985. Cooling history of the
NW Himalaya, Pakistan. Tectonics, 4,
127–151.
Zeitler, P.K., Johnson, N.M., Naeser,
C.W. and Tahirkheli, R.A.K., 1982.
Fission-track evidence for Quaternary
uplift of the Nanga Parbat region,
Pakistan. Nature, 298, 255–257.
Zeitler, P.K., Johnson, N.M., Briggs, N.D.
and Naeser, C.W., 1986. Uplift history
of the NW Himalaya as recorded by
fission-track ages on detrital Siwalik
zircons. In: Proceedings of the
Symposium on Mesozoic and Cenozoic
Geology in Connection of the 60th
Anniversary of the Geological Society
of China (H. Jiqing, ed.), Geological
Publishing House, Beijing, China,
pp. 481–496.
Received 16 March 2006; revised version
accepted 26 April 2006
� 2006 Blackwell Publishing Ltd
�
 geoffrey ruiz