zyxwvut
Macromolecules 1987,20,440-443
Kremer, K.; Baumggrtner, A.; Binder, K. J. Phys. A.; Math.
Gen. 1981,15, 2879.
de Gennes, P.-G. Scaling Concepts in Polymer Physics; Corne11 University: Ithaca, NY, 1979.
the light scattered at q = 0. The correlation length di)
verges at the spinodal point x , ( # ~ as
where
zyxwvutsrqp
zyxwvutsrqpon
zyxwvutsrqp
Microphase Separation in Block
Copolymer/Homopolymer Blends
MONICA OLVERA DE LA CRUZ*t and
(7)
ISAAC C. SANCHEZ$
Institute of Materials Science and Engineering, National
Bureau of Standards, Gaithersburg, Maryland 20899.
Received June 5, 1986
In the case where the A and B chains are chemically
linked at the end points, the phase separation occurs on
length scales of the order of the radius of gyration of the
block copolymer, R2 = 12N/6 with N = NA + N B . Let f
be the fraction of A monomers along the block copolymer.
If the melt is quenched below xt(f),the block copolymer
microphase separates into an ordered s t r ~ c t u r e .Leibler
~
found that for f # 0.5 a body-centered cubic microphase
structure is formed at x = xt(f), for deeper quenches a
hexagonal cylinder, and for quenches x 2 x,(f) the microphase separation proceeds by spinodal decomposition
and forms a one-dimensional lamellar structure. He found
that the critical point is at xc = 10.5/N and f, = 0.5; at this
point the phase separation proceeds by spinodal decomposition to a lamellar structure. The spinodal point for
microphase separation x,(f) is determined by the condition
zyxwvutsrqp
zyxwvuts
zyxwvu
zyxw
Phase separation in a blend of long polymers is properly
described by mean field the0ry.l The phase diagram may
be obtained from a lattice model free energy of mixing
(Flory-Huggins free energy)
4(r)
f[4(r)l = - 1n 4(r) +
N A
where 4 is the concentration of component A, NA and N B
are the number of monomers in the A and B chains, respectively, and x is the usual interaction parameter.
The mixture is homogeneous at high temperatures where
the entropic term dominates the free energy. The blend
phase separates into two system, one richer in component
A and the other richer in component B when the temperature is lowered below xt(#). For a blend with N A =
NBthe critical value at which immiscibility first occurs is
X, = 2 / N and 4, =
The system with original concentration 4o is metastable for x > xt(+o). The limit of
metastability for a given do is at the spinodal point ~ ~ ( 4 ~
below x , ( # ~the
) system is unstable. The spinodal point
is an inflexion point in the free energy
s-l(q)lq=q*
=0
(8)
where q* determines the wave vector at which the concentration fluctuations are maximum. The scattering
function for a block copolymer is3
where
);
D, = a2D(ax)
a = f, (1 - f ) , or 1
(9b)
x = q2R2
with D ( p ) given by eq 4 and
S(q) is the Fourier transform of the density-density correlation function and can be obtained directly from scattering experiments
S(r - r’) = (Ar$(r)A$(r’))
S(q) = l e x p ( i q r ) S ( r ) dr
with A$(r) = - 4(r).
The scattering function for this blend is2
1
l
+
- 2% (3)
= ~JVXJNA
(1 - 4 0 ) ~ ( X g ) ~ g
where xi = q2R: with R: = (Z2/6)Ni(i = A, B) the radius
of gyration, and D ( p ) is the Debye function defined as
@J
.~
AD = AD(& f ) = f/z[D1- (Df + Dl41
(10)
When homopolymer is added to a block copolymer, the
phase diagram is very rich and complicated. For example,
when the concentration of homopolymer is low, there can
be transitions to different ordered morphologies, and as
the homopolymer concentration increases, transitions to
micellar structures are possible. Let 4 be the concentration
of homopolymer made of Nc monomers of type C and (1
- 9) the concentration of block copolymer with degree of
polymerization N and with the fraction of A monomers
along the chain given by f. An inspection of the lattice
model free energy for such systems4
dr)
(1 - 4(r))
f[4(r)l = -In 4(r) +
In (1 +
NC
[XAC
+ ~X B C -~ f ) - xABf(1 - f)l4(r)(l- d r ) ) (11)
where xuis the usual net interaction between ij monomers,
reveals an immiscibility curve or liquid-liquid phase
transition.
From eq 11 the spinodal temperature of a system with
mean concentration 4o = 4 can be calculated by using eq
2. The spinodal temperature is given by the familiar expression
zyxwvutsr
D(r) = (2/p2)b + e-’ - 11
(4)
In the limit xi= qzR: << 1 (i = A, B)the scattering function
takes on the Ornstein-Zernike form
S-l(q) a K2+ (I2)
(5)
where the correlation length 5 measures the intensity of
NBS Guest Scientist from the University of Massachusetts.
Current addrase: Department of Material Science and Engineering,
Northwestern University, Evanston, IL 60201-9990.
*Currentaddress: Alcoa Laboratories, Alcoa Center, PA 15069.
0024-9297/87/2220-0440$01.5Q/Q 0 1987 American Chemical Society
�zyxwvutsrqpo
zyxwvutsr
zyxwvuts
zyxwvutsrq
zyxwvuts
zyxwvutsrq
zyxwv
zyxwvutsr
Notes 441
Macromolecules, Vol. 20, No. 2, 1987
where the net interaction parameter x is now given by
x(f) = XBC(1 - f ) + XACf - XABf(1 - f )
(13)
The Flory-Huggins free energy eq 11 does not give information about the microphase separation transition or
the formation of micelles. The simplest case to study is
when the homopolymer is made by B type monomers, so
x(f) is simply xABfL. Leibler et aL6 have analyzed micelle
formation for 4 > 0.5 and Nc/N = r > 2. They found that
the formation of micelles occurs well before (at higher
temperatures) the xc predicted by the lattice model (eq
11). Because the system is inhomogeneous due to the
micelles well before the predicted critical point, the Flory-Huggins free energy eq 11cannot predict the true liquid-liquid phase diagram. Neither would the phase diagram be correctly predicted by a microscopic theory that
expands the free energy of the homogeneous block copolymer-homopolymer melt in powers of, say, the concentration fluctuations of homopolymer A4(r) = 4 - 4(r).
However, when the concentration of homopolymer is
very low and f is around 0.5, the system is close to the
critical point of the pure block copolymer melt. Near the
critical point the spinodal and the first-order-transition
lines are very close together, and an expansion of the free
energy of the homogeneous melt in powers of the concentration fluctuations can describe the microphase separation. At the critical point, the wave vector at which the
scattering function diverges dominates the transition. So,
it is reasonable to assume that near the critical points@the
free energy is also dominated by the concentration fluctuations of wave vector q*(f). Within this assumption the
third- and fourth-order terms in the free energy expansion
in the concentration fluctuations can be evaluated at q*
for different structures, and the structure that minimizes
the free energy is determined. So only in the vicinity of
the critical point (4 = 0 and f = 0.5) can the spinodal lines,
which determine q*, reveal information about the coexistence curves; away from this point the first-order transition xt(f, 4) can be very distant from the spinodal, and
the assumption that a single wave vector q* dominates the
free energy is not valid.
In this paper we analyze the variations of the spinodal
line and the value of q* as a function of 4, P , and f near
= 0 and f = 0.5. We first calculate the scattering function
for an A-B block copolymer with C homopolymer melt,
then we discuss in detail the case C = B. Throughout the
calculation the chains are assumed to be Gaussian.
Let us consider a system consisting of nABblock copolymer chains of degree of polymerization N = NA + N B
with NA = fN and N B = (1- f)N and nc chains of length
Nc = rN. In order to construct the partition function 2,
a continuous model for ni Gaussian chains of contour
length Li = Nili (i = A, B, C)was used. The short-range
interaction energy was represented as a delta function
interaction of magnitude wij between ij monomer,' where
w$i, with p the total density, is related to cij, the interaction
between ij monomers. In the continuous representation
the i = A, B, C chains are given as continuous curves in
space as S@(r- r(s))ds/li. So the microscopic concentration is
Introducing the collective coordinates, eq 15, into the
partition function 2,one can express the partition function
as8
r
where Sic1is the ij element of the inverse of the matrix
0
(1 - 4)m
(1 - 4)DI-t
(1 -$ID,
(1 - 4)aO
S=N
(
O
0
0
0
)
4Dh
)'l(
D, = cr2D(ax)is defined in eq 9b, AD in eq 10, and D ( p )
in eq 4 with x = q2R2,R2 = N12/6, and 4 is the concen-
zyxwvut
tration of homopolymer in the system, and where we have
simplified eq 16 by assuming that the step lengths of the
A, B, and C polymers are equal.
Integrating out ddBqand dr$cq, one obtains
where the scattering function for component A is
with xij = P/kbT(Wij - '/2(wij + Wu)) and XABC XAB XBC
- XAC. Equation 18 reduces to eq 9 in the limit of 4 = 0,
as required. Also in the limit when f = 1 (and x u = XBC
= 0), eq 18 reduces to eq 4. Equation 18 is in agreement
with previous t h e o r i e ~ . ~ J ~
Let us concentrate on the case where the homopolymer
of length rN is made of B monomers so xBC = 0 and xAB
= XAC = x. Then eq 18 reduces to
zyxwvuts
where the 4iq,the collective coordinates, are given by
where B, = pA + pB
+ pc and pi = niNi/Vfor i = A, B, C.
S A ( q ) = N/(F(x, 4, f , r ) - 2x1
(19)
where
Jb,4, f, r ) =
(1 - 4)Dl
+ @r/r
DPr
4 0 - 4 1 7 + (1 - 4)2(OfDI-f- AD2)
(20)
-
The scattering function eq 19 for small 4 has a broad peak
at x* # 0 even at high temperatures (x 0). When 4 is
small, the concentration fluctuations are maximum at x
finite, while when 4 is large, concentration fluctuations of
infinite wavelength ( x = 0) dominate the scattered intensity.
�zyxwvutsrqponm
zyxw
zy
zy
zyxwvutsrq
zyxwvuts
442 Notes
Macromolecules, Vol. 20,No. 2, 1987
The broad peak of eq 19 at x = 0 is at the minimum of
F(x, 4, f, r); i.e., when
14
I
l
zyxwvu
zyxwvuts
12
i
One approaches the spinodal point by lowering the temperature or increasing x. The broad peak becomes sharper
as in the case of pure block copolymer with the difference
that now the scattering function has a finite intensity at
x = 0 that represents the concentration fluctuations of
infinite wavelength. At the spinodal point (xN),, the
scattering function diverges and
(xW, = '/z&*,
4, f , r )
(22)
The concentration fluctuations are localized in domains
with a periodic structure of wave vector q* = ( x * ) l I 2 ( R .
When 4 increases, the scattering intensity at x = 0 increases until eventually it dominates and the spinodal is
found at x = 0. The homogeneous state is then unstable
against concentration fluctuations of infinite wavelength.
We are interested in the values of (xN), and x* for small
values of 4 near f = 0.5. Leibler3 found for 4 = 0 the
critical point at f, = 0.5 with x,* = 3.78. In order to calculate the variation of (xN), when 4 = 0, we differentiate
eq 22 and solve the resulting equation numerically to find
in general agreement with a previous study1 that
-
(a(xlv),/a4)io-o,,,,x~*
= -18.1
m
= 0.0
r = 0.257
= 10.5 r
0
-
(23)
The entropy of mixing homopolymer with block copolymer
increases with respect to its value at 4 = 0 because adding
homopolymer increases the number of degrees of freedom.
The shorter (small r ) the homopolymer added, the larger
the entropy of mixing. A system with homopolymer made
of short chains is more stable in the disordered state than
when it is made of long chains because entropically it is
more difficult to localize short chains in a domain. So one
would expect (xN), to increase as 4 increases, and at fixed
4, one would expect (xn?, to increase as r decreases. On
the other hand, the energy of mixing, Umix,increases as
4 increases independent of r, aU-la$ > 0. According to
eq 23 when r > 0.257,the energy coming from adding more
AB contacts between different chains dominates the entropy term. The disordered state for r > 0.257 and f = 0.5
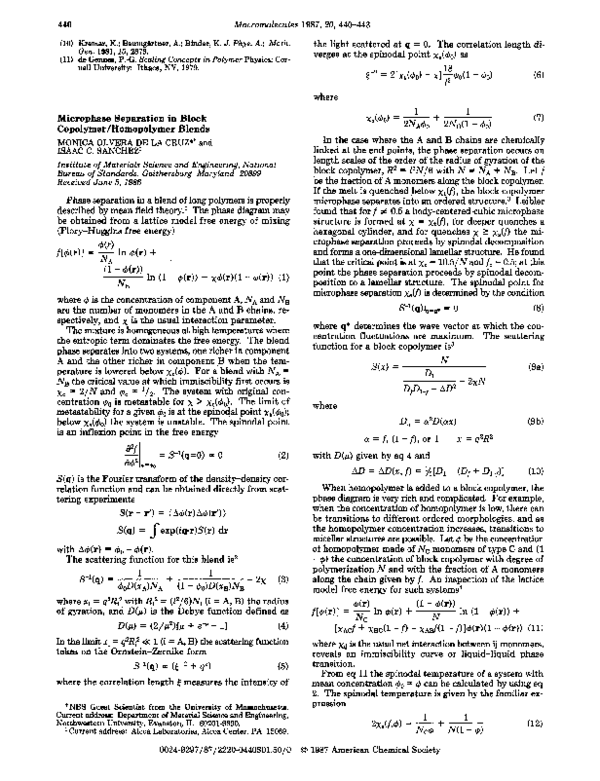
becomes unstable at (xN), < 10.5. The numerical solution
of (xN), as a function of 4 from eq 22 for f = 0.5 and r =
1.6, 1.0, and 0.15 is plotted in Figure 1A.
We also found the variation of x* for f = 0.5 in the limit
4 0:
(ax*/a4)Io=o,rc
= -19.7 r
03
= -12.1 r
1
= 0.0 r = 0.181
= 3.35 r
0
(24)
In figure 1B x* is plotted against 4 for f = 0.5 for r = 1.6,
1.0, and 0.15;x* was determined by finding the maximum
in eq 19 numerically. The above result that x* decreases
with 4 for sufficiently large values of r is in qualitative
agreement with the results of Hong and Noolandi.lo What
is new is the result that when the added homopolymer is
sufficiently small (r < 0.18), x* can increase with 4. Indeed, it has been mentioned1°J3 that, when short homopolymer chains are present, the periodicity of the ordered
structure may decrease. It is believed that in the absence
of a diluent (4 = 0) interfacial forces and the condition of
constant density leads to a situation where the block copolymer chains are stretched well beyond their normal
-
--
cp
B
01
0 00
0 10
0 20
P
Figure 1. Block copolymer (A-B)-homopolymer (B) blend (A)
spinodal temperature (xN),; (B) x* as a function of 4, for f = 0.5
and r = 1.6, 1.0, and 0.15.
Gaussian dimensions. It is probable that by adding a
diluent, say, a short-chain homopolymer, the strectched
chains might relax, which would decrease the periodicity.
In our calculation the chains are always assumed to be
Gaussian and in the homogeneous one-phase region of the
phase diagram, so this "relaxation" is not the origin of the
effect; instead it arises because x* is an inverse measure
of the range of possible concentration fluctuations.8 In
general, x* varies inversely as the radius of gyration of the
polymer chains. Adding a small amount of short homopolymer chains effectively reduces the radius of gyration
of the chains and the range of concentration fluctuations
(or increases x*). However, there is an important caveat.
It is well-known that adding solvent to a melt will cause
the polymer chains to swell. Self-excluded volume effects
will not be screened if the added homopolymer is very
short (r << 1). Therefore, the effect of the excluded volume
interaction is in the opposite direction and may significantly reduce (or eliminate) the predicted increase in x*
with 4. Although there are experimental reports of periodicity spacings decreasing upon addition of low molecular weight di1uents1"l6 in agreement with the present
theory, the agreement may be fortuitous. A true test of
the theory requires measurements in the neighborhood of
the microphase transition temperature but still in the
one-phase region of the phase diagram.
The influence off, 4, and r on (xN), can be determined
by expanding eq 22 in a Taylor series around f = 0.5, 4
= 0, and r = 0.257:
(xN), = 10.5(1
+ 0.4864' + 7.63(f - 1/2)'
- 4.584(f 1/2) - 2.834(r - 0.257) + ...) (25)
In parts A and B of Figure 2 we have plotted
(XM,and
x * , respectively, against 4 for f = 0.25,0.5,and 0.75 with
r = 1. Notice that x* goes to zero faster for f > 0.5, because
when f > 0.5 the number of repulsive contacts (A, B) between homopolymer and block copolymer is higher than
when f < 0.5, favoring immiscibility at infinite wavelength.
Equation 25 is in qualitative agreement with the experiments of Roe and Zin13in polystyrene-polybutadiene block
�zyxwvuts
zyxw
zyxwvutsrqpo
Macromolecules 1987,20,443-445
32
r------
f=.5
A
0.2
0.0
I
0.4
P
443
physical properties of nylon 6 arising from the solubility
of these salts in nylon 6 even in the absence of any liquid
diluent. Further, nylon 6 and other nylon type polyamides
have been shown to be soluble in CaC12-methanol solut i o n ~ . ~We
% now report the swelling and eventual dissolution of aliphatic polyamides (nylons) in tetrahydrofuran
(THF) in the presence of LiC104. The possibility of using
the LiC104 complex of nylon 6 as a solid electrolyte and
of drawing a fiber from nylon 6 gel were the motives behind
this study.
Nylon 6 films (Type 77A) produced commercially by
Allied Corp. were used in all our experiments ( [ q ]= 1.33
dL/g, M , = 20000, Mw/Mn 2). Nylon 6,9 was obtained
from Aldrich Chemical Co., nylon 6,10, nylon 11, and nylon
6,12 were purchased from Polysciences, Inc., nylon 12 was
purchased from Emser Industries, and nylon 3 was obtained from H. K. Reimschuessel (Allied). X-ray diffraction (XRD) patterns were obtained at room temperature on a Philips automated powder diffractometer in the
parafocus mode using Cu K a radiation. Viscosities were
determined with a capillary viscometer, using both mcresol (a standard solvent) and the THF/LiC104 solution
as solvents. Differential scanning calorimeter scans (DSC)
were obtained on a Du Pont 9900 DSC apparatus. Infrared
spectra were obtained on a Perkin-Elmer 953 spectrometer
both in the ATR mode on a thick film and in the transmission mode on thin films sandwiched between KBr
plates.
Polyamides do not diasolve in THF and it also was found
that nylon 6 films changed very little when immersed in
a solution of 0.25 M LiC104 in THF. At a salt concentration of 0.5 M, the nylon 6 film became whitish, at 0.75
M LiC104the film lost its shape, and at 1.0 M LiC104the
film became a gel and did not dissolve in the solvent. The
gel exhibited an ionic conductivity similar to that of the
LiC104/THF solution, and this conductivity disappeared
as the gel was dried. At a salt concentration of 1.5 M or
higher, nylon 6 dissolved. At least 18 wt % of nylon 6
could be dissolved in a 2.0 M LiC104/THF solution (ca.
1 2 wt % in n-cresol). We also found that other nylons
dissolved in THF a t the following approximate concentrations of LiC104: nylon 3 at 2 M, nylon 6,6 at 4 M, nylon
6,9 at 2.5 M, and nylon 6,lO at 2.0 M. However, nylons
with 10 or more CH2 units, nylon 6,11 and nylon 11, dissolved very slowly over a period of several days in 6 M
LiC104/THF solution, and nylon 12 did not dissolve even
in saturated (6-8 M) LiC104/THF solutions. We limited
our detailed investigation to nylon 6.
Viscosity measurements were done to follow the changes
in the molecular weight and the conformation of nylon 6
in solution. The intrinsic viscosity of a sample of nylon
6 in m-cresol was 1.33 dL/g. The intrinsic viscosity of
nylon 6 in THF with 2.0 M LiC104 was 0.88 dL/g. The
lower intrinsic viscosity in LiC104/THF as compared to
that in m-cresol suggests a smaller spatial extension of
nylon 6 in LiC104/THF. The viscosities of nylon 6 reprecipitated from the gel and from the solution (LiC104/THF) as measured in m-cresol are similar to that of
the original nylon 6 (1.38 vs. 1.32 dL/g; thus in fact slightly
higher), suggesting that nylon 6 was not degraded in the
LiC104/THF solvent.
X-ray diffraction scans of nylon 6 variously treated with
LiC104/THF solutions are shown in Figure 1. The gel
freshly prepared by immersing nylon 6 in 1.0 M LiC104/THF for -15 h was amorphous (Figure la). Drying
the gel under vacuum at 22 "C crystallized LiC104.3H20
but nylon 6 apparently was still complexed with Li' and
C104-ions and thus remained amorphous (Figure lb). The
zyxwvu
zyxwvutsr
zyxwvutsrq
cp
Figure 2. Block copolymer (A-B)-homopolymer (B) blend (A)
spinodal temperature
(B) x* as a function of 6 for r = 1
and f = 0.25, 0.5, and 0.75.
(xw,;
copolymers mixed with polystyrene or polybutadiene.
Acknowledgment. We are grateful to Jeff Marqusee
for several useful discussions. Monica Olvera de la Cruz
thanks Professor Frank Karasz for financial support.
References and Notes
de Gennes, P.-G. J. Phys. Lett. 1977,38, L-441.
de Gennes, P.-G. Scaling Concepts in Polymer Physics; Cornell University: Ithaca, NY,1979; p 109.
Leibler, L. Macromolecules 1980, 13, 1602.
Roe, R. J.; Zin, W. C. Macromolecules 1980,13, 1221.
Leibler, L.;Orland, H.; Wheeler, J. C. J. Chem. Phys. 1983, 79,
3550.
Alexander, S.; McTague, J. Phys. Rev. Lett. 1978, 41, 702.
Edwards, S. F. Proc. Phys. SOC.London 1966,88, 265.
Olvera de la Cruz, M.; Sanchez, I. C. Macromolecules 1986,19,
2501.
Benoit, H.; Wu, W.; Benmouna, M.; Mozer, B.; Bauer, B.;
Lapp, A. Macromolecules 1988, 18, 986.
Hong, K.M.;Noolandi, J. Macromolecules 1983, 16, 1083.
Whitmore, M. D.; Noolandi, J., preprint, 1986.
de Gennes, P.-G. Scaling Concepts in Polymer Physics; Corne11 University: Ithaca, NY, 1979;p 65.
Roe,R. J.; Zin, W. C. Macromolecules 1984, 17, 189.
Shibayama, M.; Hashimoto, T.; Hasegawa, H.; Kawai, H.
Macromolecules 1983, 16, 1427.
Douy, A.; Mayer, R.; Rossi, J.; Gallot, B. Mol. Cryst. Liq. Cryst.
1969, 7, 103.
Ioneacu, M.L.; Skoulious, A. Makromol. Chem. 1976,177,257.
Gelation and Solubilization of Aliphatic
Polyamides in Tetrahydrofuran Using Lithium
Perchlorate
N. S. MURTHY
Corporate Technology, Allied-Signal, Inc.,
Morristown, New Jersey 07960. Received May 29, 1986
Mixtures of nylon 6 and inorganic salts, mainly metal
halides such as LiC1, KI, and KBr, have been extensively
studied over the past decade (see, for example, ref 1). In
these efforts, the emphasis has been on the changes in the
0024-9297/~ ~ ~ 2 2 2 a - a 4 4 3 ~ a i . 50
a /1987
o American Chemical Society
-
�
 ISAAC ISMAEL ROSADO SANCHEZ