Understanding Partial Autocorrelation Functions (PACF) in Time Series Data

Last Updated : 01 Feb, 2024
Comments
Improve
Suggest changes
Like Article
Like
Save
Share
Report
News Follow

Partial autocorrelation functions (PACF) play a pivotal role in time series analysis, offering crucial insights into the relationship between variables while mitigating confounding influences. In essence, PACF elucidates the direct correlation between a variable and its lagged values after removing the effects of intermediary time steps. This statistical tool holds significance across various disciplines, including economics, finance, meteorology, and more, enabling analysts to unveil hidden patterns and forecast future trends with enhanced accuracy.

What is Partial Autocorrelation?

Partial correlation is a statistical method used to measure how strongly two variables are related while considering and adjusting for the influence of one or more additional variables. In more straightforward terms, it helps assess the connection between two variables by factoring in the impact of other relevant variables, providing a more nuanced understanding of their relationship.

The correlation between two variables indicates how much they change together. Nonetheless, partial correlation takes an additional step by considering the potential influence of other variables that might be affecting this relationship. In this way, partial correlation seeks to unveil the distinctive connection between two variables by eliminating the shared variability with the control variables.

In terms of mathematical expression, the partial correlation coefficient which assesses the relationship between variables X and Y while considering the influence of variable Z, is typically calculated using the given formula:

\rho_{XY.Z} = \frac{\rho_{XY}-\rho_{XZ}.\rho_{YZ}}{\sqrt{(1- \rho_{XZ}^{2})(1 - \rho_{YZ}^{2})}}

Here,

  • \rho_{XY}   is the correlation coefficient between X and Y.
  • \rho_{XZ}   is the correlation coefficient between X and Z.
  • \rho_{YZ}   is the correlation coefficient between Y and Z.

The numerator represents the correlation between X and Y after accounting for their relationships with Z. The denominator normalizes the correlation by removing the effects of Z.

What are Partial Autocorrelation Functions?

In the realm of time series analysis, the Partial Autocorrelation Function (PACF) measures the partial correlation between a stationary time series and its own past values, considering and accounting for the values at all shorter lags. This is distinct from the Autocorrelation Function, which doesn’t factor in the influence of other lags.

The PACF is a crucial tool in data analysis, particularly for identifying the optimal lag in an autoregressive (AR) model. It became integral to the Box–Jenkins approach to time series modeling. By examining the plots of partial autocorrelation functions, analysts can determine the appropriate lags (often denoted as p) in an AR(p) model or an extended ARIMA(p,d,q) model. This helps in understanding and capturing the temporal dependencies in the data, aiding in effective time series modeling and forecasting.

Calculation of PACF

The Durbin–Levinson Algorithm is employed to compute the theoretical partial autocorrelation function of a stationary time series.

\phi_{k|X} = \frac{\gamma_k - \sum_{i=1}^{k-1} \phi_{i|X} \gamma_{k-i}}{1 - \sum_{i=1}^{k-1} \phi_{i|X} \gamma_i}

here,

  • \phi_{k|X}  is the partial autocorrelation at lag k.
  • \gamma_k  is the autocovariance at lag k.
  • \phi_{i|X}   represents the partial autocorrelation at lag i, where i ranges from 1 to k-1.

The provided formula can be utilized by incorporating sample autocorrelations to determine the sample partial autocorrelation function for a given time series.

Interpretation of PACF

  • Peaks or troughs in the PACF indicate significant lags where there is a strong correlation between the current observation and that specific lag. Each peak represents a potential autoregressive term in the time series model.
  • The point at which the PACF values drop to insignificance (i.e., within the confidence interval) suggests the end of the significant lags. The cut-off lag helps determine the order of the autoregressive process.
  • If there is a significant peak at lag “p” in the PACF and the values at subsequent lags drop to insignificance, it suggests an autoregressive process of order p(AR(p)) is appropriate for modeling the time series.

Difference Between ACF and PACF

Autocorrelation Function (ACF)

Partial Autocorrelation Function (PACF)

ACF measures the correlation between a data point and its lagged values, considering all intermediate lags. It gives a broad picture of how each observation is related to its past values.

PACF isolates the direct correlation between a data point and a specific lag, while controlling for the influence of other lags. It provides a more focused view of the relationship between a data point and its immediate past.

ACF does not isolate the direct correlation between a data point and a specific lag. Instead, it includes the cumulative effect of all intermediate lags.

PACF is particularly useful in determining the order of an autoregressive (AR) process in time series modeling. Significant peaks in PACF suggest the number of lag terms needed in an AR model.

ACF is helpful in identifying repeating patterns or seasonality in the data by examining the periodicity of significant peaks in the correlation values.

The point where PACF values drop to insignificance helps identify the cut-off lag, indicating the end of significant lags for an AR process.

Partial Autocorrelation Functions using Python

Using Custom Generated dataset

Let’s compute the Partial Autocorrelation Function (PACF) using statsmodels library in Python.

Importing Libraries:

Python3

import pandas as pd
import numpy as np
from statsmodels.tsa.stattools import pacf
from statsmodels.graphics.tsaplots import plot_pacf

                    
  • pandas as pd: Imports the Pandas library with an alias pd. Pandas is commonly used for handling structured data.
  • numpy as np: Imports the NumPy library with an alias np. NumPy is used for numerical computations.
  • from statsmodels.tsa.stattools import pacf: Imports the pacf function from the statsmodels library. This function is used to compute the Partial Autocorrelation Function (PACF) values.

Generating Time Series Data:

Python3

np.random.seed(42)
time_steps = np.linspace(0, 10, 100)
data = np.sin(time_steps) + np.random.normal(scale=0.2, size=len(time_steps))

                    
  • np.random.seed(42): Sets the seed for random number generation in NumPy to ensure reproducibility.
  • time_steps = np.linspace(0, 10, 100): Creates an array of 100 evenly spaced numbers from 0 to 10.
  • data = np.sin(time_steps) + np.random.normal(scale=0.2, size=len(time_steps)): Generates a sine wave using np.sin(time_steps) and adds random noise using np.random.normal() to create a synthetic time series data. This data mimics a sine wave pattern with added noise.

Computing and Plotting PACF :

  • pacf_values = pacf(data, nlags=20): Calculates the Partial Autocorrelation Function (PACF) values using the pacf function from statsmodels. It computes PACF values for the provided data with a specified number of lags (nlags=20). Change nlags according to the length of your time series data or the number of lags you want to investigate.
  • PACF Plotting: Create a plot representing the PACF values against lags to visualize partial correlations. Set title, labels for axes, and display the PACF plot.
  • for lag, pacf_val in enumerate(pacf_values): Iterates through the computed PACF values. The enumerate() function provides both the lag number (lag) and the corresponding PACF value (pacf_val), which are then printed for each lag.

Python3

pacf_values = pacf(data, nlags=20)
 
# Print PACF values
print("Partial Autocorrelation Function (PACF) values:")
for lag, pacf_val in enumerate(pacf_values):
    print(f"Lag {lag}: {pacf_val}")
 
 
# Plot PACF
plt.figure(figsize=(10, 5))
plot_pacf(data, lags=20# Change lags according to your data
plt.title('Partial Autocorrelation Function (PACF)')
plt.xlabel('Lags')
plt.ylabel('PACF')
plt.grid(True)
plt.show()


Output:

Partial Autocorrelation Function (PACF) values:
Lag 0: 1.0
Lag 1: 0.9277779190634952
Lag 2: 0.39269022809503606
Lag 3: 0.15463548623480705
Lag 4: -0.03886302489844257
Lag 5: -0.042933753723446405
Lag 6: -0.3632570559137871
Lag 7: -0.2817338901669104
Lag 8: -0.3931692351265865
Lag 9: -0.16550939301708287
Lag 10: -0.27973978478073214
Lag 11: 0.1370484695314932
Lag 12: -0.20445377972909687
Lag 13: -0.12087299096297043
Lag 14: 0.046229571707022764
Lag 15: -0.3654906423192799
Lag 16: -0.36058859364402557
Lag 17: -0.4949891744857339
Lag 18: -0.3466588099640611
Lag 19: -0.30607850279663795
Lag 20: -0.3277911710431029

Screenshot-2024-01-04-005607

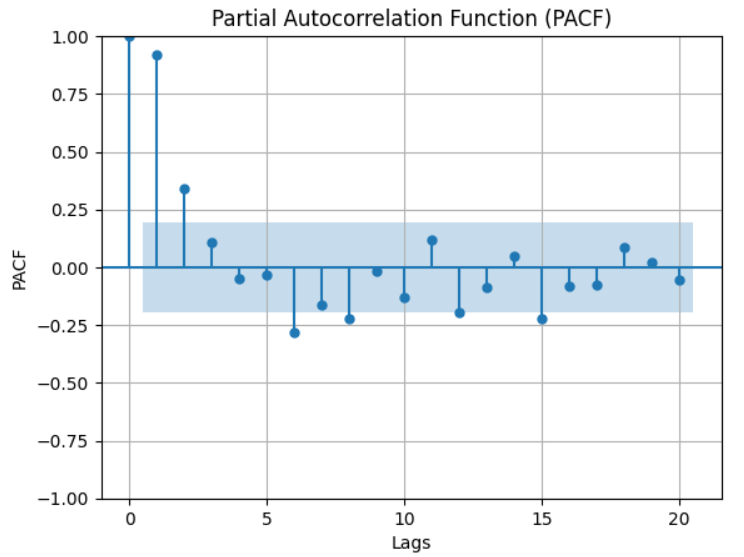
These values represent the Partial Autocorrelation Function (PACF) values calculated for each lag.

Each line in the output indicates the lag number and its corresponding PACF value. Positive or negative values indicate positive or negative correlations respectively, while values close to zero suggest weaker correlations at that lag.

Using Real world Dataset

Importing Required Libraries and Dataset Retrieval

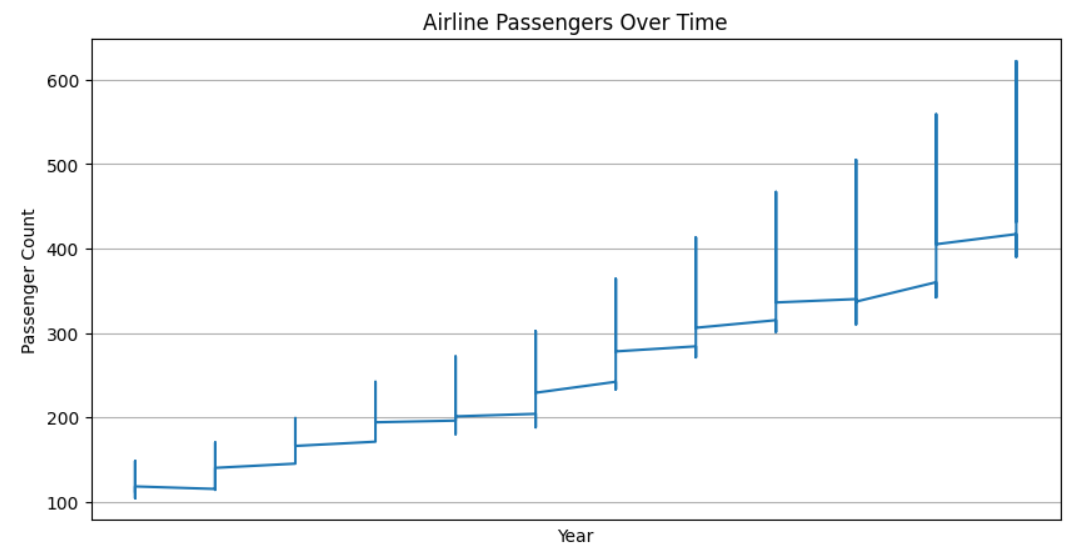
  • Imports: Import necessary libraries such as Pandas for data manipulation, Matplotlib for plotting, pacf from statsmodels.tsa.stattools for PACF computation, and get_rdataset from statsmodels.datasets to obtain the ‘AirPassengers’ dataset.
  • Loading Dataset: Retrieve the ‘AirPassengers’ dataset using get_rdataset. Convert the index to datetime format.

Python3

import pandas as pd
import matplotlib.pyplot as plt
from statsmodels.tsa.stattools import pacf
from statsmodels.datasets import get_rdataset
 
# Load the 'AirPassengers' dataset from statsmodels
data = get_rdataset('AirPassengers').data
 
# Convert the index to datetime format
data.index = pd.to_datetime(data['time'])


Plotting Time Series Data

  • Time Series Plotting: Create a figure and plot the ‘AirPassengers’ time series data using Matplotlib. Set title, labels for axes, and display the plot.

Python3

# Plot the time series data
plt.figure(figsize=(10, 5))
plt.plot(data['value'])
plt.title('Airline Passengers Over Time')
plt.xlabel('Year')
plt.ylabel('Passenger Count')
plt.grid(True)
plt.show()


Output:
Screenshot-2023-12-30-144006

Calculating and Plotting PACF

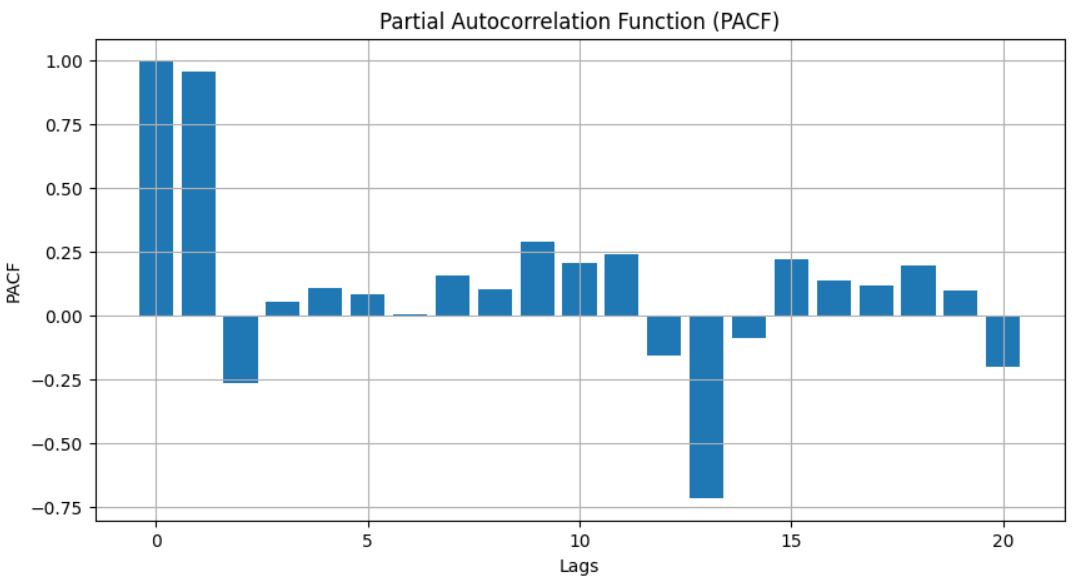
  • PACF Computation: Compute the Partial Autocorrelation Function (PACF) values for the ‘AirPassengers’ dataset using pacf from statsmodels. Define the number of lags as 20.
  • PACF Plotting: Create a bar plot representing the PACF values against lags to visualize partial correlations. Set title, labels for axes, and display the PACF plot.

Python3

# Calculate PACF using statsmodels pacf function
pacf_values = pacf(data['value'], nlags=20)
 
# Plot PACF
plt.figure(figsize=(10, 5))
plt.bar(range(len(pacf_values)), pacf_values)
plt.title('Partial Autocorrelation Function (PACF)')
plt.xlabel('Lags')
plt.ylabel('PACF')
plt.grid(True)
plt.show()


Output:

Screenshot-2023-12-31-152522

Interpreting PACF plots involves identifying these significant spikes or “partial correlations.” A significant spike at a particular lag implies a strong correlation between the variable and its value at that lag, independent of the other lags. For instance, a PACF plot showcasing a significant spike at lag 1 but no significant spikes at subsequent lags suggests a first-order autoregressive process, often denoted as AR(1) in time series analysis.

Applications in Time Series Analysis

The application of PACF extends to various aspects of time series analysis:

  1. Model Identification: PACF aids in identifying the order of autoregressive terms in autoregressive integrated moving average (ARIMA) models. The distinct spikes in the PACF plot indicate the number of autoregressive terms required to model the data accurately.
  2. Feature Selection: In predictive modeling, especially in forecasting tasks, understanding the significant lags through PACF helps select relevant features that contribute meaningfully to the predictive power of the model.
  3. Diagnostic Checks: PACF plots are indispensable for diagnosing residual autocorrelation in time series models. Deviations from expected PACF patterns can signify model inadequacies or errors.

Limitations and Considerations

While PACF is a powerful tool, it does have certain limitations. It assumes linearity and stationarity in the data, which might not hold true for all-time series. Moreover, interpreting PACF plots might be challenging in cases of noisy or complex data, requiring supplementary analyses or adjustments.

Conclusion

In the realm of time series analysis, partial autocorrelation functions stand as a fundamental tool, enabling analysts to disentangle complex relationships between variables and their lagged values. By revealing direct correlations while mitigating confounding factors, PACF aids in model development, forecasting, and diagnostic evaluations. As data analysis methodologies evolve, the role of PACF remains pivotal, facilitating deeper insights and more accurate predictions in diverse fields where time series data is paramount.


Similar Reads

Autocorrelation and Partial Autocorrelation
Autocorrelation and partial autocorrelation are statistical measures that help analyze the relationship between a time series and its lagged values. In R Programming Language, the acf() and pacf() functions can be used to compute and visualize autocorrelation and partial autocorrelation, respectively. AutocorrelationAutocorrelation measures the lin
6 min read
Understanding the Moving average (MA) in Time Series Data
Data is often collected with respect to time, whether for scientific or financial purposes. When data is collected in a chronological order, it is referred to as time series data. Analyzing time series data provides insights into how the data behaves over time, including underlying patterns that can help solve problems in various domains. Time seri
15 min read
Types of Autocorrelation
Autocorrelation: As we discussed in this article, Autocorrelation is defined as the measure of the degree of similarity between a given time series and the lagged version of that time series over successive time periods. Autocorrelation measures the degree of similarity between a time series and the lagged version of that time series at different i
4 min read
AutoCorrelation
Autocorrelation is a fundamental concept in time series analysis. Autocorrelation is a statistical concept that assesses the degree of correlation between the values of variable at different time points. The article aims to discuss the fundamentals and working of Autocorrelation. Table of Content What is Autocorrelation?What is Partial Autocorrelat
10 min read
How to Test the Autocorrelation of the Residuals in R?
Autocorrelation in residuals is a critical aspect of time series analysis and regression modeling. It refers to the correlation of a signal with a delayed copy of itself as a function of delay. Autocorrelation in residuals indicates that there is some pattern left in the residuals that the model has not captured, which can lead to inefficiency in t
4 min read
Peak Signal Detection in Real-Time Time-Series Data
Real-time peak detection from within time-series data forms an essential and significant technique or method for a variety of different applications, right from anomaly detection in sensor networks to financial market analytics within the realm of big data analytics. Real-time peak detection is particularly challenging due to the need for immediate
7 min read
How to Plot Multiple Series/Lines in a Time Series Using Plotly in R?
Plotly is a powerful and flexible graphing library that enables the creation of interactive plots in R. It is especially useful for visualizing time series data with multiple lines or series. In this article, we will cover how to plot multiple time series in a single plot using Plotly in R. Multiple Time SeriesMultiple time series involve more than
5 min read
Real-Time Peak Detection in Noisy Sinusoidal Time-Series
Peak detection from time-series data is an essential procedure in many branches: from signal processing to finance and environment monitoring. Under linguistics, it may serve as the basis for the following action or conclusion. Additionally, peak detection in accurate noisy sinusoidal signals is always one of the most challenging tasks to conduct.
5 min read
Dynamic Time Warping (DTW) in Time Series
Dynamic Time Warping (DTW) is a powerful algorithm used in time series analysis to measure the similarity between two temporal sequences. Unlike traditional distance metrics like Euclidean distance, DTW can handle sequences of different lengths. It can align sequences that may be out of sync, making it particularly useful in fields such as speech r
8 min read
NLP | Partial parsing with Regex
Defining a grammar to parse 3 phrase types. ChunkRule class that looks for an optional determiner followed by one or more nouns is used for noun phrases. To add an adjective to the front of a noun chunk, MergeRule class is used. Any IN word is simply chunked for the prepositional phrases. an optional modal word (such as should) followed by a verb i
2 min read
Partial Least Squares Singular Value Decomposition (PLSSVD)
Partial Least Squares Singular Value Decomposition (PLSSVD) is a sophisticated statistical technique employed in the realms of multivariate analysis and machine learning. This method merges the strengths of Partial Least Squares (PLS) and Singular Value Decomposition (SVD), offering a powerful tool to extract crucial information from high-dimension
9 min read
Partial Least Squares (PLS) Canonical
In the realm of machine learning, it’s essential to have a diverse toolkit to solve various complex problems. Partial Least Squares (PLS) Canonical, a technique rooted in both regression and dimensionality reduction, has gained significant traction in recent years. This method, which finds patterns in data by projecting it onto a lower-dimensional
7 min read
Partial Least Squares Regression (PLSRegression) using Sklearn
Partial least square regression is a Machine learning Algorithm used for modelling the relationship between independent and dependent variables. This is mainly used when there are many interrelated independent variables. It is more commonly used in regression and latent variable modelling. It finds the directions (latent variables) in the independe
8 min read
Partial differential equations (PDEs) in Deep Larning
Partial Differential Equations (PDEs) are fundamental in modeling various phenomena in science and engineering, ranging from fluid dynamics to heat transfer and quantum mechanics. Traditional numerical methods for solving PDEs, such as the finite difference method, finite element method, and finite volume method, have been effective but often compu
8 min read
How to Create a 2D Partial Dependence Plot on a Trained Random Forest Model in R
Random Forest, a powerful ensemble learning algorithm, is widely used for regression and classification tasks due to its robustness and ability to handle complex data. However, understanding how individual features influence the model's predictions can be challenging. Partial Dependence Plots (PDPs) provide a valuable tool for visualizing the relat
3 min read
MANOVA Effect Size (Partial Eta Squared) in R
Multivariate Analysis of Variance (MANOVA) is the statistical analysis method that generalizes the ANOVA test for cases when there is more than one variable to compare. In one way, it assists in determining whether the means of several groups are statistically different on several dependent variables. What is Partial Eta Squared?Partial eta squared
3 min read
Partial derivatives in Machine Learning
Partial derivatives play a vital role in the area of machine learning, notably in optimization methods like gradient descent. These derivatives help us grasp how a function changes considering its input variables. In machine learning, where we commonly deal with complicated models and high-dimensional data, knowing partial derivatives becomes vital
4 min read
How to Create a Partial Dependence Plot for a Categorical Variable in R?
Partial Dependence Plots (PDPs) are a powerful tool for understanding the relationship between predictor variables and the predicted outcome in machine learning models. PDPs are particularly useful for visualizing how a feature affects the predictions, holding other features constant. While they are commonly used for continuous variables, PDPs can
4 min read
Partial Dependence Plot from an XGBoost Model in R
Partial Dependence Plots (PDPs) are a powerful tool for interpreting complex machine-learning models. They help visualize the relationship between a subset of features and the predicted outcome, holding other features constant. In the context of XGBoost models, PDPs can provide insights into how specific features influence the model's predictions.
4 min read
Components of Time Series Data
Time series data is a sequence of data points recorded or collected at regular time intervals. It is a type of data that tracks the evolution of a variable over time, such as sales, stock prices, temperature, etc. The regular time intervals can be daily, weekly, monthly, quarterly, or annually, and the data is often represented as a line graph or t
11 min read
Similarity Search for Time-Series Data
Time-series analysis is a statistical approach for analyzing data that has been structured through time. It entails analyzing past data to detect patterns, trends, and anomalies, then applying this knowledge to forecast future trends. Time-series analysis has several uses, including in finance, economics, engineering, and the healthcare industry. T
15+ min read
Machine Learning for Time Series Data in R
Machine learning (ML) is a subfield of artificial intelligence (AI) that focuses on the development of algorithms and models that enable computers to learn and make predictions or decisions without being explicitly programmed. In R Programming Language it's a way for computers to learn from data and improve their performance on a specific task over
11 min read
Seasonality Detection in Time Series Data
Time series analysis is a fundamental area of study in statistics and data science that provides a powerful framework for understanding and predicting patterns in sequential data. Time series data, in particular, captures information over successive intervals of time, which allows analysts to uncover trends, seasonal patterns, and other temporal de
5 min read
Periodicity in Time Series Data using R
Periodicity refers to the existence of repeating patterns or cycles in the time series data. Periodicity helps users to understand the underlying trends and make some predictions which is a fundamental task in various fields like finance to climate science. In time series data, the R Programming Language and its environment for statistical analysis
4 min read
Handling Missing Values in Time Series Data
Handling missing values in time series data in R is a crucial step in the data preprocessing phase. Time series data often contains gaps or missing observations due to various reasons such as sensor malfunctions, human errors, or other external factors. In R Programming Language dealing with missing values appropriately is essential to ensure the a
5 min read
Stationarity of Time Series Data using R
In this article, we will discuss about Stationarity of Time Series Data, its characteristics, and types, why stationarity matters, and How to test it using R. Stationarity of Time Series Data Stationarity is an important concept when working with time series data. A stationary time series is one whose statistical properties, such as mean, variance,
7 min read
Time Series Data Transformation using Python
Time series data transformation is a crucial step in time series analysis and forecasting, it involves converting raw time series data into a format that is suitable for analysis and modelling. In this article, we will see how we can use time series data transformation, which will be beneficial to our analysis. Types of transformationsIn univariate
6 min read
Effective Methods for Merging Time Series Data with Metadata in Pandas
Combining time series data with metadata is a common task in data analysis, especially in fields like finance, healthcare, and IoT. This process involves merging time-indexed data with additional information that provides context or attributes to the time series. In this article, we will explore the proper way to combine time series data with metad
5 min read
Monitoring and Assessing the Significance of Changes in Time Series Data
Time series data is ubiquitous in various fields such as finance, meteorology, medicine, and more. Detecting significant changes in time series data is crucial for understanding underlying patterns and making informed decisions. However, it is equally important to determine when these changes are no longer significant. This article delves into the
8 min read
Step-by-Step Guide to Modeling Time Series Data Using Linear Regression
Time series data is a sequence of data points collected or recorded at specific time intervals. Modeling time series data is crucial in various fields such as finance, economics, environmental science, and many others. One of the simplest yet powerful methods to model time series data is using linear regression. This article will delve into the tec
6 min read