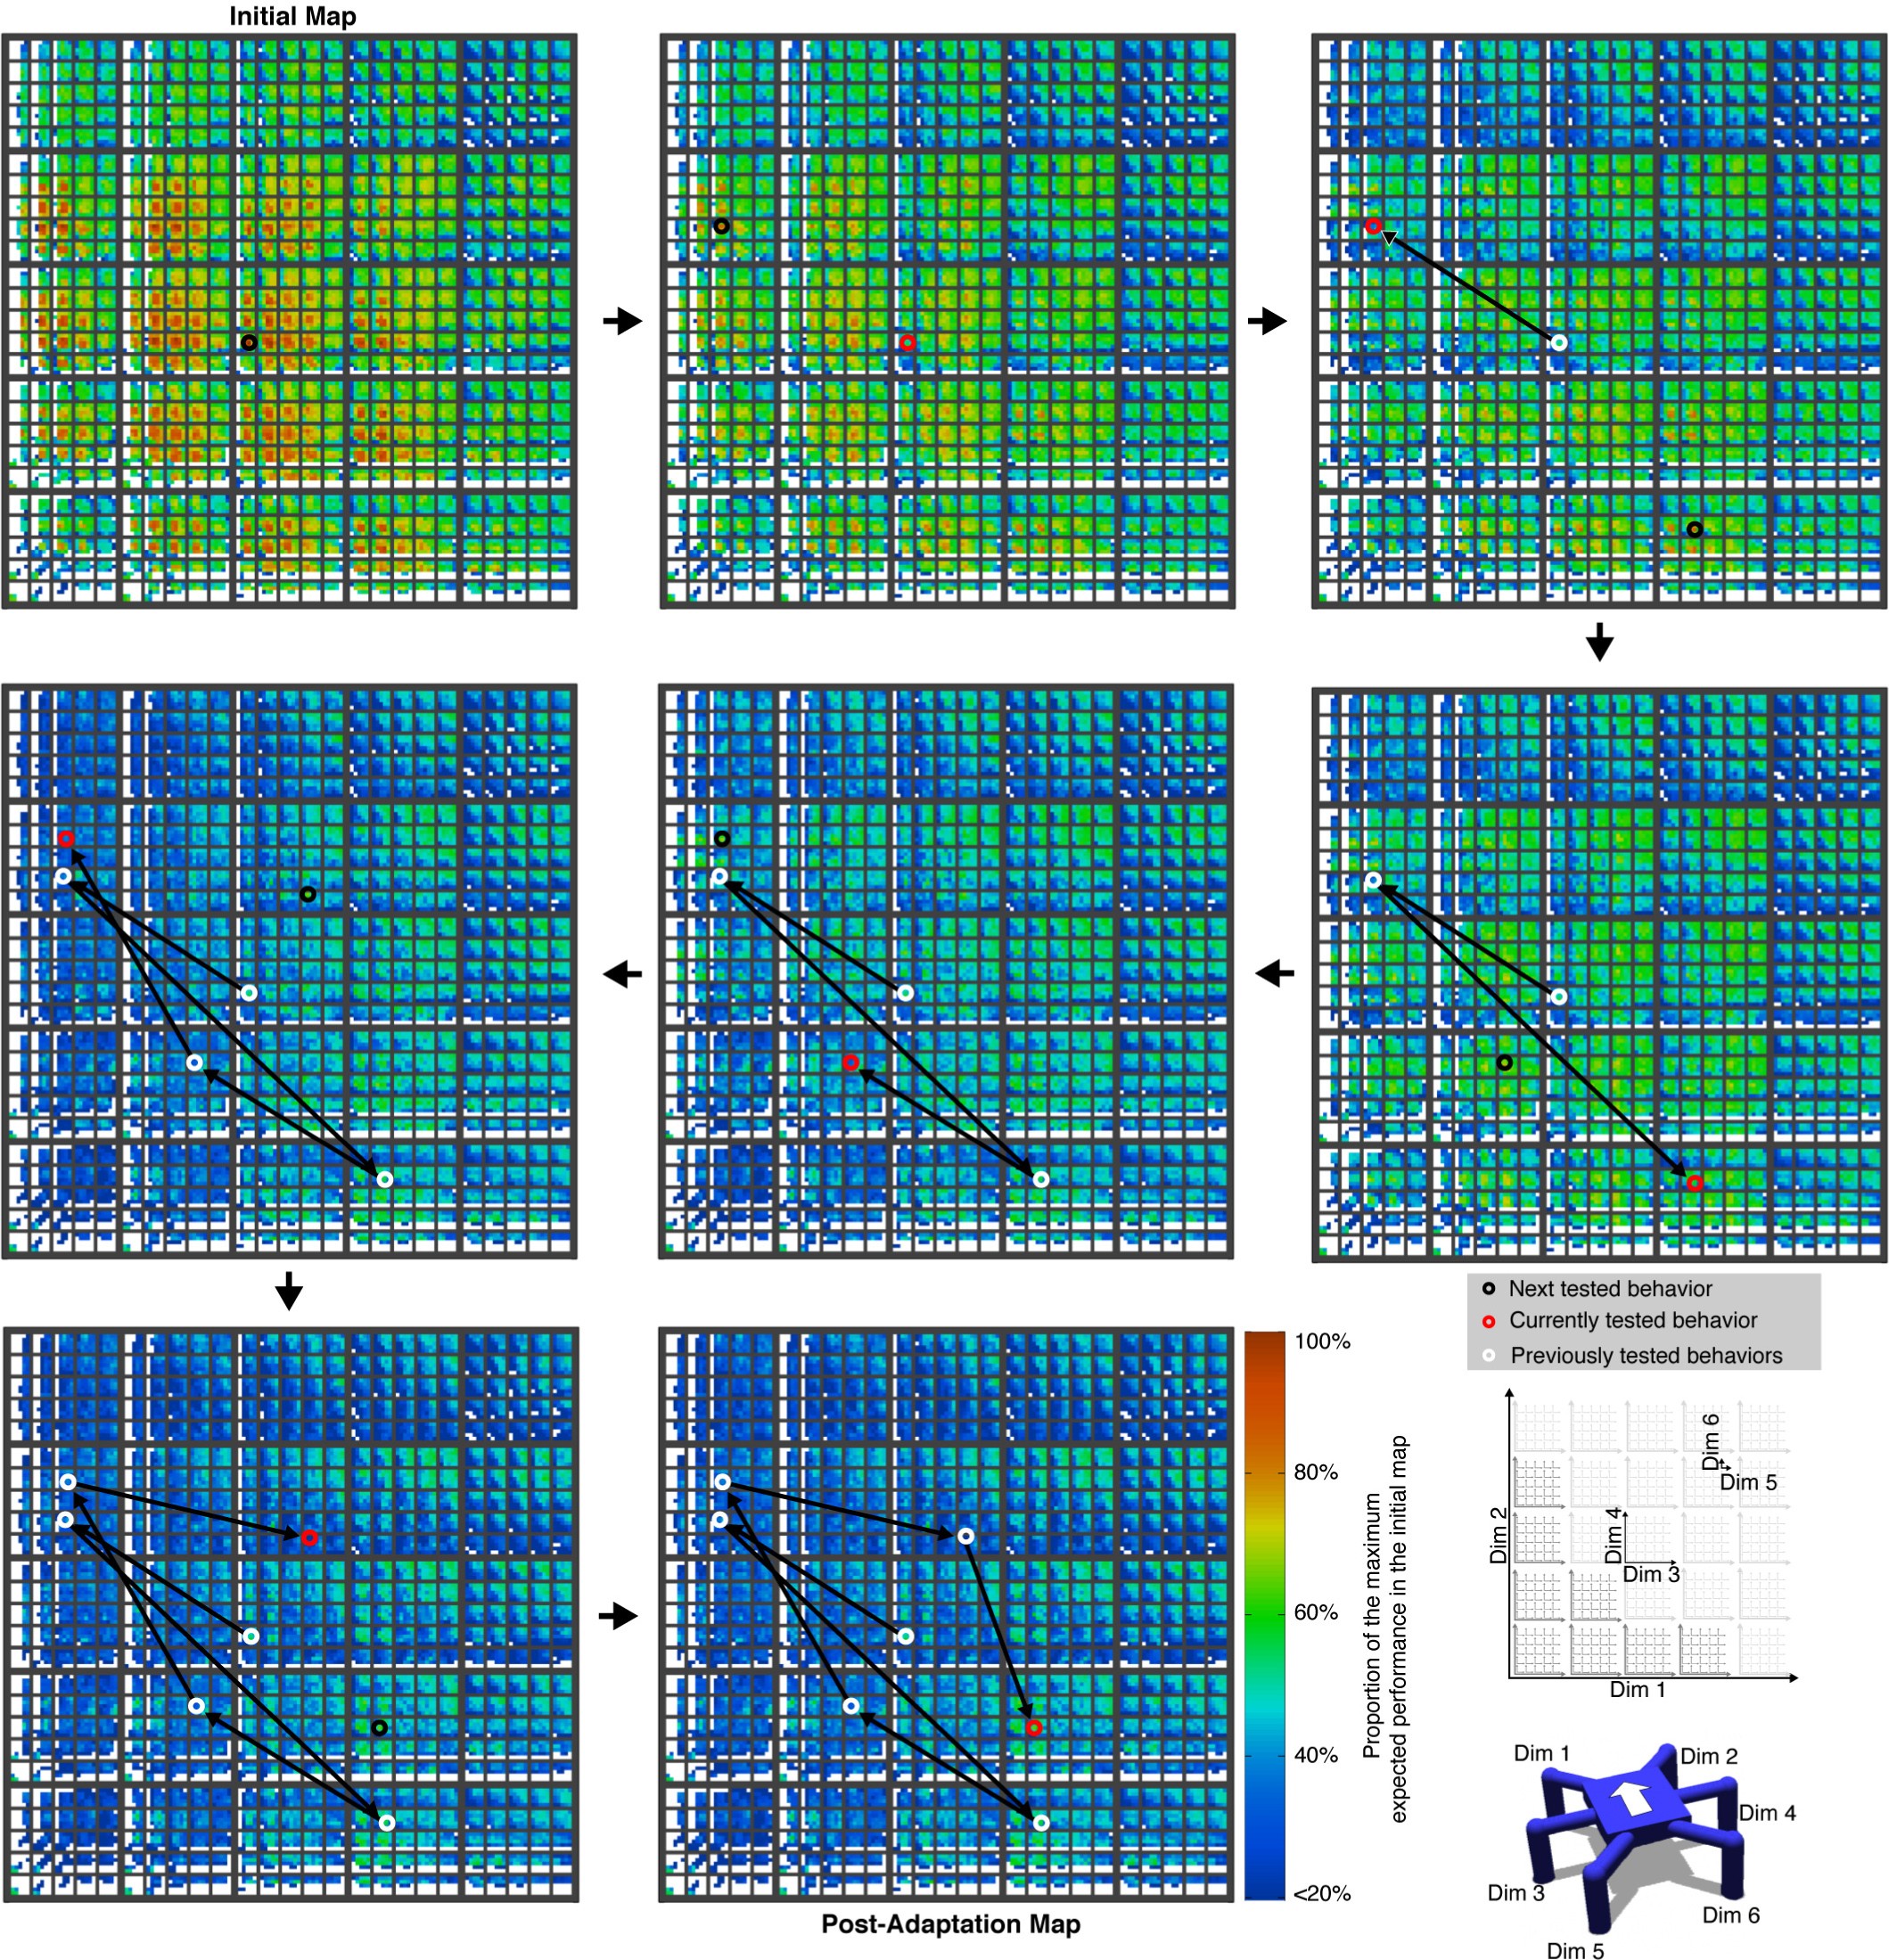
Extended Data Figure 6: How the behaviour performance map (data not normalized) is explored to discover a compensatory behaviour.

The data are not normalized in order to highlight that performance predictions decrease as it is discovered that predictions from the simulated, undamaged robot do not work well on the damaged robot. The robot is adapting to damage condition C4 (see Fig. 3a). Colours represent the performance prediction for each point in the map relative to the highest performing prediction in the first map. A black circle indicates the next behaviour to be tested on the physical robot. A red circle indicates the behaviour that was just tested (note that the performance predictions surrounding it have changed versus the previous panel). Arrows reveal the order that points have been explored. The red circle in the last map in the sequence is the final, selected, compensatory behaviour. In this scenario, the robot loses leg number 3. The six-dimensional space is visualized according to the inset legend. The data visualized in this figure are identical to those in the previous figure: the difference is simply whether the data are renormalized for each new map in the sequence.