Analysis of ratios
- 1. 1 REPORT ON FINANCIAL STRUCTURE OFRENATA LTD & SQUARE PHARMACEUTICALS LTD.
- 2. 2 Prepared For: SHANILA TANEEM (SNT) Prepared by: SUMAIYA KHAN ANHA - 1510260030 ALI ARFI SHAFAT CHOWDHURY - 1510376630 TARANNUM HAIDER MALIHA - 1511332630 DIPANNITA FARHAHA INITA - 1110533030 NAFIS JAWAD RAHMAN - 1311015630
- 3. 3 Table of Contents No. Contents Page Number 1 Description of Company 04 2 Solvency measures 05-13 3 Recommendation 14 4 Conclusion 14
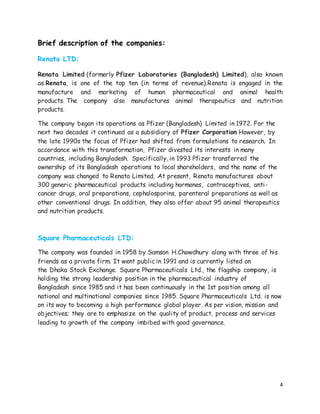
- 4. 4 Brief description of the companies: Renata LTD: Renata Limited (formerly Pfizer Laboratories (Bangladesh) Limited), also known as Renata, is one of the top ten (in terms of revenue).Renata is engaged in the manufacture and marketing of human pharmaceutical and animal health products. The company also manufactures animal therapeutics and nutrition products. The company began its operations as Pfizer (Bangladesh) Limited in 1972. For the next two decades it continued as a subsidiary of Pfizer Corporation However, by the late 1990s the focus of Pfizer had shifted from formulations to research. In accordance with this transformation, Pfizer divested its interests in many countries, including Bangladesh. Specifically, in 1993 Pfizer transferred the ownership of its Bangladesh operations to local shareholders, and the name of the company was changed to Renata Limited. At present, Renata manufactures about 300 generic pharmaceutical products including hormones, contraceptives, anti- cancer drugs, oral preparations, cephalosporins, parenteral preparations as well as other conventional drugs. In addition, they also offer about 95 animal therapeutics and nutrition products. Square Pharmaceuticals LTD: The company was founded in 1958 by Samson H.Chowdhury along with three of his friends as a private firm. It went public in 1991 and is currently listed on the Dhaka Stock Exchange. Square Pharmaceuticals Ltd., the flagship company, is holding the strong leadership position in the pharmaceutical industry of Bangladesh since 1985 and it has been continuously in the 1st position among all national and multinational companies since 1985. Square Pharmaceuticals Ltd. is now on its way to becoming a high performance global player. As per vision, mission and objectives; they are to emphasize on the quality of product, process and services leading to growth of the company imbibed with good governance.
- 5. 5 Solvency Measures Liquidity ratios Current ratio means the firm’s ability to meet its short-term obligations. Current ratio is always good when it is higher than 1 times. ‘ Square Pharmaceuticals LTD. is operating above the industry average whereas Renata LTD is operating below the industry average. As a result, the current ratio of Square is above 2, which is very good as it has the capacity to pay off its liability. Quick ratio is similar to current ratio, except that it excludes inventory, which is generally the least liquid current asset. Quick ratio is also good when it is greater than 1 times. Square Pharmaceuticals Ltd. has a fluctuating graph whereas it is still operating above the industry average. Despite of it, the quick ratio is falling below 1. On the contrary, Renata Ltd. has a very low quick ratio of 0.5 in 2014. However, it faced its trough in year 2013 when it had a quick ratio of below 0.5. 0 0.5 1 1.5 2 2.5 2011 2012 2013 2014 RENATA LTD SQUARE PHARMACEUTICALS LTD INDUSTRY AVERAGE 0 0.5 1 1.5 2 2011 2012 2013 2014 RENATA LTD SQUARE PHARMACEUTICALS LTD INDUSTRY AVERAGE Current ratio Quick ratio
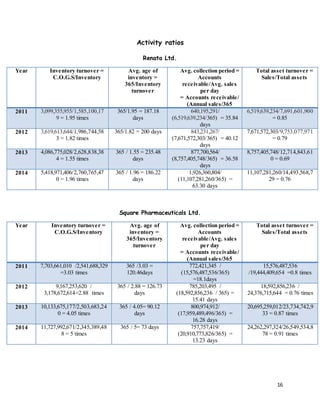
- 6. 6 Activity ratios Inventory turnover means the activity, or liquidity of a firm’s inventory. The higher the inventory turnover is, the better it is. The inventory turnover of square is above the industry average not only that it is still rising till date. It reached the peak in 2014 with an inventory turnover of 5 times. On the contrary, Renata has an inventory turnover below industry average and faced an all time low in around 2013. Avg. age of inventory means how many times are being used to sell the product. The lower the avg. age of inventory turnover is, the better it is. From the graph, we can depict that Square is in a better position than Renata as it has a value below industry average. Moreover, Renatahas a very high average age of inventory. Therefore in this particular case also square is performing better than Renata. Avg. collection period means the approximate amount of time that it takes for a business to receive payments owed. Every company wants to sell their products faster and get the payment faster. So the lower the avg. collection period is, the better it is. 0 1 2 3 4 5 6 2011 2012 2013 2014 RENATA LTD. SQUARE PHARMACEUTIC ALS LTD. INDUSTRY AVERAGE 0 50 100 150 200 250 2011 2012 2013 2014 RENATA LTD SQUARE PHARMACEUTICALS LTD INDUSTRY AVERAGE Inventory turnover Avg.age of inventory
- 7. 7 According to the graph, Renata LTD. has an upward sloping graph which means it takes a lot of time to receive payments from its accounts receivables. Whilst, Square has a very low avg. collection period and has faced a downfall in 2014 with almost a value of 10. Total asset turnover (T.A.T.O) means the efficiency with which the firm uses its assets to generate sales. The higher the T.A.T.O. is, the better it is. The graph illustrates two scenarios of Renata and Square- 1) Renata was operating above the industry average and Square was below the industry average from 2011 to somewhere around 2012. 2) After 2012, Square started operating above the industry average and Renata faced a trough at its worst in 2013 with almost a value of 0.69. As a result, from this particular graph we can assume Square is performing better than Renata and is using its assets more efficiently. Debt. Ratios Debt. Ratio means the proportion of total assets financed by the firm’s creditors. We know that, the lower the debt. Ratio is, the better it is. 0 10 20 30 40 50 60 70 2011 2012 2013 2014 RENATA LTD SQUARE PHARMACEUTICALS LTD INDUSTRY AVERAGE 0 0.2 0.4 0.6 0.8 1 2011 2012 2013 2014 RENATA LTD SQUARE PHARMACEUTICALS LTD INDUSTRY AVERAGE Avg. collection period Total asset turnover
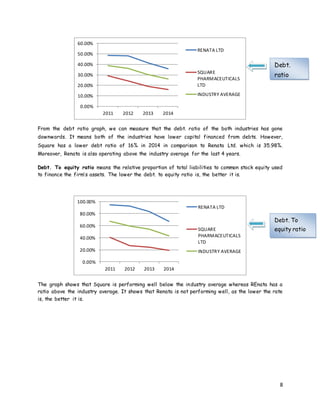
- 8. 8 From the debt ratio graph, we can measure that the debt. ratio of the both industries has gone downwards. It means both of the industries have lower capital financed from debts. However, Square has a lower debt ratio of 16% in 2014 in comparison to Renata Ltd. which is 35.98%. Moreover, Renata is also operating above the industry average for the last 4 years. Debt. To equity ratio means the relative proportion of total liabilities to common stock equity used to finance the firm’s assets. The lower the debt. to equity ratio is, the better it is. The graph shows that Square is performing well below the industry average whereas REnata has a ratio above the industry average. It shows that Renata is not performing well, as the lower the rate is, the better it is. 0.00% 10.00% 20.00% 30.00% 40.00% 50.00% 60.00% 2011 2012 2013 2014 RENATA LTD SQUARE PHARMACEUTICALS LTD INDUSTRY AVERAGE 0.00% 20.00% 40.00% 60.00% 80.00% 100.00% 2011 2012 2013 2014 RENATA LTD SQUARE PHARMACEUTICALS LTD INDUSTRY AVERAGE Debt. ratio Debt. To equity ratio
- 9. 9 The times interest earned ratio (TIE) means the firm’s ability to make contractual interest payments. It is better for the firm when the ratio is higher. The graph shows that square has been fluctuating in this case a lot in the last 4 years in contrast to Renata which had a relatively stable graph. However, Renata has a ratio below the industry average and hence increment in terms of this ratio is necessary. Despite of this, Square’s effort should be applauded because even after the fall in 2012 it still managed to raise a high of 29.6 times. Profitability ratios The gross profit margin (G.P.M) means the percentage of each sales dollar remaining after the firm has paid for its goods. The higher the gross profit is, the better it is. The GPM graph is showing that the industry has got an upward sloping curve. Renata’s curve though looks almost the same, it has gone little downfrom 52.46% to 51.21% in the given years. On the contrary, Square was operating above the industry average till the end of 2012. However, in 2013 it faced its worst trough which might be due to higher cost of goods sold. Despite of all these fluctuations, Square did manage to increase its profit all over again by 2014. 0 5 10 15 20 25 30 35 2011 2012 2013 2014 RENATA LTD SQUARE PHARMACEUTIC ALS LTD INDUSTRY AVERAGE 0.00% 100.00% 200.00% 300.00% 400.00% 500.00% 600.00% 2011 2012 2013 2014 RENATA LTD SQUARE PHARMACEUTICA LS LTD INDUSTRY AVERAGE Times interest earned ratio Gross profit margin
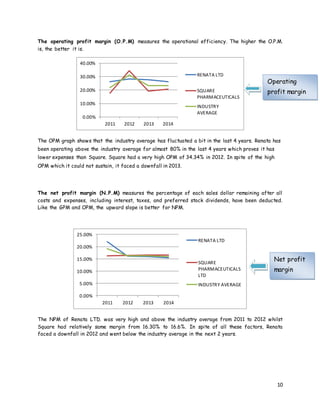
- 10. 10 The operating profit margin (O.P.M) measures the operational efficiency. The higher the O.P.M. is, the better it is. The OPM graph shows that the industry average has fluctuated a bit in the last 4 years. Renata has been operating above the industry average for almost 80% in the last 4 years which proves it has lower expenses than Square. Square had a very high OPM of 34.34% in 2012. In spite of the high OPM which it could not sustain, it faced a downfall in 2013. The net profit margin (N.P.M) measures the percentage of each sales dollar remaining after all costs and expenses, including interest, taxes, and preferred stock dividends, have been deducted. Like the GPM and OPM, the upward slope is better for NPM. The NPM of Renata LTD. was very high and above the industry average from 2011 to 2012 whilst Square had relatively same margin from 16.30% to 16.6%. In spite of all these factors, Renata faced a downfall in 2012 and went below the industry average in the next 2 years. 0.00% 10.00% 20.00% 30.00% 40.00% 2011 2012 2013 2014 RENATA LTD SQUARE PHARMACEUTICALS INDUSTRY AVERAGE 0.00% 5.00% 10.00% 15.00% 20.00% 25.00% 2011 2012 2013 2014 RENATA LTD SQUARE PHARMACEUTICALS LTD INDUSTRY AVERAGE Net profit margin Operating profit margin
- 11. 11 The earnings per share (EPS) of a company is generally of interest to present or prospective stockholders and management. The higher the ratio is, the better it is. From the graph we can depict that, Renata has an EPS above the industry average in 2014 with almost 40%. On the contrary, Square had EPS below the industry average which started from 9.56% to a lower value of 7.10%. EPS is very important for the company as it will help them to gain investors. The company’s return on assets (ROA) means the overall effectiveness of management in generating profits with its available assets. The higher the ROA is, the better it is. The ROA graph shows that Renata had a very high ROA of 18.71% which was w ell above the industry average in 2011. However, it reduced to 15.18% in the end with the worst fall in 2013 with a value of 10.93%. Square, on the other hand, started with a low value in 2011 well below the industry average and increased to 15.18% above the industry average. 0.00% 10.00% 20.00% 30.00% 40.00% 50.00% 60.00% 2011 2012 2013 2014 RENATA LTD SQUARE PHARMACEUTICALS LTD INDUSTRY AVERAGE 0.00% 5.00% 10.00% 15.00% 20.00% 2011 2012 2013 2014 RENATA LTD SQUARE PHARMACEUTICALS LTD INDUSTRY AVERAGE Earnings per share Return on assets
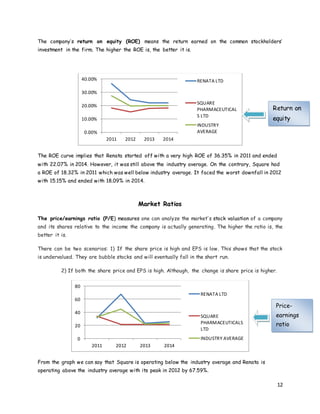
- 12. 12 The company’s return on equity (ROE) means the return earned on the common stockholders’ investment in the firm. The higher the ROE is, the better it is. The ROE curve implies that Renata started off with a very high ROE of 36.35% in 2011 and ended with 22.07% in 2014. However, it was still above the industry average. On the contrary, Square had a ROE of 18.32% in 2011 which was well below industry average. It faced the worst downfall in 2012 with 15.15% and ended with 18.09% in 2014. Market Ratios The price/earnings ratio (P/E) measures one can analyze the market's stock valuation of a company and its shares relative to the income the company is actually generating. The higher the ratio is, the better it is. There can be two scenarios: 1) If the share price is high and EPS is low. This shows that the stock is undervalued. They are bubble stocks and will eventually fall in the short run. 2) If both the share price and EPS is high. Although, the change is share price is higher. From the graph we can say that Square is operating below the industry average and Renata is operating above the industry average with its peak in 2012 by 67.59%. 0.00% 10.00% 20.00% 30.00% 40.00% 2011 2012 2013 2014 RENATA LTD SQUARE PHARMACEUTICAL S LTD INDUSTRY AVERAGE 0 20 40 60 80 2011 2012 2013 2014 RENATA LTD SQUARE PHARMACEUTICALS LTD INDUSTRY AVERAGE Return on equity Price- earnings ratio
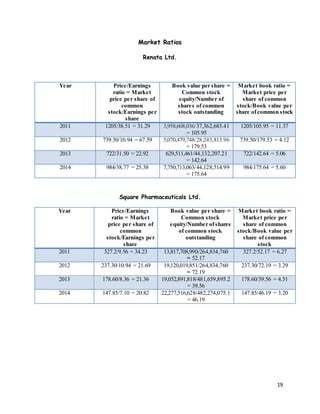
- 13. 13 The Book value per share (BVPS) compares the amount of stockholders' equity to the number of shares outstanding. The higher the BVPS is, the better it is. Renata has a higher book value per share which shows that people will have more confidence on the business. On the other hand, Square has lost some confidence from the people as they have got a downfall in 2013. The market/book ratio (M/B) is used to find the value of a company by comparing the book value of a firm to its market value. Book value is calculated by looking at the firm's historical cost, or accounting value. Market value is determined in the stock market through its market capitalization. The higher the ratio is, the better it is. According to the graph, The M/B ratio of Renata is very high compared to Square. Renata faced a peak in 2012 and so did Square. As a result it shows that the industry has also fluctuated. 0 50 100 150 200 2011 2012 2013 2014 RENATA LTD SQUARE PHARMACEUTICALS LTD INDUSTRY AVERAGE 0 50 100 150 200 2011 2012 2013 2014 RENATA LTD SQUARE PHARMACEUTICALS LTD. INDUSTRY AVERAGE Book value per share Market/Book ratio
- 14. 14 Recommendation From the entire report of Square Pharmaceuticals LTD. and Renata LTD. we can assume that Square is performing better than Renata in terms profitably, liquidity and debt ratio. However, in case of the P/E ratio, Square has a lower P/E than Renata. In our opinion, we would suggest investing in Square as the profits are higher and the upward trend is more sustainable than Renata LTD. Square has managed to perform well in almost all the sectors and dealt with their inefficiency efficiently. As a result, we believe investing in Square would have lower risk involved in comparison to the return. Conclusion After checking all the ratios of both the companies, we can conclude that both the companies are performing well and have their own share of respect in the market. Despite of all these, Renata has been underperforming in comparison to Square in almost all the aspect. On the contrary, Renata did manage to provide with a higher EPS than Square which might instigate investors to invest more due to higher return. But if we look at the long run prospective, Square has been outperforming Renata with better efficiency and will be a more sustainable one to invest.
- 15. 15 Appendix Liquidity Ratios Renata Ltd. Year Current ratio = Current assets/Current liabilities Quick ratio = (Current assets – Inventory)/ Current liabilities 2011 2,464,125,653/3,385,850,284= 0.73 times (2,464,125,653-1,585,100,179) / 3,385,850,284= 0.26 times 2012 3,310,220,716/2,876,857,184 = 1.15 times (3,310,220,716-1,986,744,883)/ 2,876,857,184 = 0.46 times 2013 4,137,379,000/5,266,051,481 = 0.79 times (4,137,379,000– 2,628,838,384)/ 5,266,051,481 = 0.29 times 2014 5,296,370,085/5,214,178,551 = 1.02 times (5,296,370,085 – 2,760,765,470)/ 5,214,178,551 = 0.49 times Square Pharmaceuticals Ltd. Year Current ratio = Current assets/Current liabilities Quick ratio = (Current assets – Inventory)/ Current liabilities 2011 7,022,213,840 /4,668,189,426 =1.5 times (7,022,213,840-2,541,688,329) /4,668,189,426 = 0.96 times 2012 8,248,571,022/4,315,390,359 = 1.91 times (8,248,571,022-3,178,672,614)/ 4,315,390,359 = 1.17 times 2013 7,768,068,298/3,416,619,593 = 1.58 times (7,768,068,298-2,345,389,488)/3,416,619,593 = 1.59 times 2014 5,996,697,544/3,792,438,255 = 2.27 times (5,996,697,544-2,503,683,240)/3,416,619,593 = 0.92 times
- 16. 16 Activity ratios Renata Ltd. Year Inventory turnover = C.O.G.S/Inventory Avg. age of inventory = 365/Inventory turnover Avg. collection period = Accounts receivable/Avg. sales per day = Accounts receivable/ (Annual sales/365 Total asset turnover = Sales/Total assets 2011 3,099,355,955/1,585,100,17 9 = 1.95 times 365/1.95 = 187.18 days 640,195,291/ (6,519,639,234/365) = 35.84 days 6,519,639,234/7,691,601,900 = 0.85 2012 3,619,613,644/1,986,744,58 3 = 1.82 times 365/1.82 = 200 days 843,231,267/ (7,671,572,303/365) = 40.12 days 7,671,572,303/9,753,077,971 = 0.79 2013 4,086,775,028/2,628,838,38 4 = 1.55 times 365 / 1.55 = 235.48 days 877,700,564/ (8,757,405,748/365) = 36.58 days 8,757,405,748/12,714,843,61 0 = 0.69 2014 5,418,971,406/2,760,765,47 0 = 1.96 times 365 / 1.96 = 186.22 days 1,926,360,804/ (11,107,281,260/365) = 63.30 days 11,107,281,260/14,493,568,7 29 = 0.76 Square Pharmaceuticals Ltd. Year Inventory turnover = C.O.G.S/Inventory Avg. age of inventory = 365/Inventory turnover Avg. collection period = Accounts receivable/Avg. sales per day = Accounts receivable/ (Annual sales/365 Total asset turnover = Sales/Total assets 2011 7,703,661,010 /2,541,688,329 =3.03 times 365 /3.03 = 120.46days 772,421,345 / (15,576,487,536/365) =18.1days 15,576,487,536 /19,444,409,654 =0.8 times 2012 9,167,253,620 / 3,178,672,614=2.88 times 365 / 2.88 = 126.73 days 785,203,495 / (18,592,856,236 / 365) = 15.41 days 18,592,856,236 / 24,376,715,644 = 0.76 times 2013 10,133,675,177/2,503,683,24 0 = 4.05 times 365 / 4.05= 90.12 days 800,974,912/ (17,959,489,496/365) = 16.28 days 20,695,259,012/23,734,742,9 33 = 0.87 times 2014 11,727,992,671/2,345,389,48 8 = 5 times 365 / 5= 73 days 757,757,419/ (20,910,773,826/365) = 13.23 days 24,262,297,324/26,549,534,8 78 = 0.91 times
- 17. 17 Debt. Ratio Renata Ltd. Year Debt. Ratio = Total liabilities/Total assets Debt. To equity ratio = Total liabilities/Common stock equity Times interest earned ratio = Operating profit/Interest 2011 3,732,993,864/7,691,601,900 = 48.53% 3,732,993,864/3,958,608,036 = 94.30% 1,087,719,131/215,315,416 = 5.05 times 2012 4,682,598,223/9,753,077,971 = 48.01% 4,682,598,223/5,070,479,748 = 92.35% 1,237,926,366/370,881,897 = 3.33 times 2013 5,266,051,481/12,714,843,610 = 41.40% 5,266,051,481/6,295,114,611 = 83.65% 2,429,127,137/449,500,132 = 5.40 times 2014 5,214,178,551/14,493,568,729 = 35.98% 5,214,178,551/7,750,713,063 = 67.27% 2,910,940,303/463,471,214 = 6.28 times Square Pharmaceuticals Ltd. Year Debt. Ratio = Total liabilities/Total assets Debt. To equity ratio = Total liabilities/Common stock equity Times interest earned ratio = Operating profit/Interest 2011 5,626,700,666/19,444,409,654 =28.93% 5,626,700,666/13,817,708,990 = 40.72% 3,585,489,925/170,737,615 = 21 times 2012 5,186,900,507 / 21,453,784,762 = 24.17% 5,186,900,507/ 19,120,019,851 = 27.12% 1,783,055,287/433,581,036 = 4.11times 2013 4,681,851,115/23,734,742,933 = 19% 4,681,851,115/19,052,891,818 = 24.5% 3,956,139,219/325,281,016 = 12.16 times 2014 4,272,018,250/26,549,534,878 = 16% 4,272,018,250/22,277,516,628 = 19% 5,008,816,403/169,180,826 = 29.6 times
- 18. 18 Profitability Ratios Renata Ltd. Square Pharmaceuticals Ltd. Year Gross profit margin = Gross profit/Sales Operating profit margin = Operating profit/Sales Net profit margin = Earnings available for common stockholders/Sal es Earnings per share = Net income/Com mon stock outstanding Return on assets = Net income/Tota l assets Return on equity = Net income/Commo n stock equity 2011 3,420,283,279/ 6,519,639,234 = 52.46% 1,708,135,175/ 6,519,639,234 = 26.19% 1,438,836,938/6,519, 639,234 = 22.07% 1,438,836,938/29, 888,594.47 = 48.14% 1,438,836,938/7, 691,601,900 = 18.71% 1,438,836,938/3,958 ,608,036 = 36.35% 2012 4,051,958,659/ 7,671,572,303 = 52.82% 2,161,099,398/ 7,671,572,303 = 28.17% 1,237,926,366/7,671, 572,303 = 16.14% 1,237,926,366/282 43813.96 = 43.83% 1,237,926,366/9, 753,077,971 = 12.69% 1,237,926,366/5,070 ,479,748 = 24.41% 2013 4,670,630,720/ 8,757,405,748 = 53.33% 2,429,127,137/ 8,757,405,748 = 27.74% 1,390,164,527/8,757, 405,748 = 15.87% 1,390,164,527/44, 132,207.21 = 31.50% 1,390,164,527/12 ,714,843,610 = 10.93% 1,391,064,527/6,295 ,114,611 = 22.09% 2014 5,688,309,854/ 11,107,281,260 = 51.21% 2,910,940,303/ 11,107,281,260 = 26.21% 1,710,862,526/11,107 ,281,260 = 15.40% 1,710,862,526/44, 128,514.99 = 38.77% 1,710,862,526/14 ,493,568,729 = 11.80% 1,710,862,526/7,750 ,713,063 = 22.07% Year Gross profit margin = Gross profit/Sales Operating profit margin = Operating profit/Sales Net profit margin = Earnings available for common stockholders/Sal es Earnings per share = Net income/Com mon stock outstanding Return on assets = Net income/Tota l assets Return on equity = Net income/Commo n stock equity 2011 5,767,763,459/ 15,576,487,536 =37.02% 2,751,605,397/ 15,576,487,536 = 17.70% 2,532,054,550 /15,576,487,536 =16.30% 2,532,054,550/26 4,834,760 = 9.56% 2,532,054,550 /19,444,409,654 =13.02% 2,532,054,550 / 13,817,708,990= 18.32% 2012 6,887,171,623/ 18,592,856,236 = 37.04% 6,386,171,623/ 18,592,856,236 = 34.34% 3,037,696,965/18,592 ,856,236 = 16.34% 2,897,710,641/264 ,834,760 = 10.94% 2,897,710,641/24 ,376,715,644 = 11.88% 2897710641/191200 19851 = 15.15% 2013 7,825,814,319/ 20,695,259,012 = 37.81% 3,956,139,219/ 20,695,259,012 = 19.10% 3,419,785,256/20,695 ,259,012 = 16.5% 3,419,785,256/409 ,065,222 = 8.36% 3,419,785,256/23 ,734,742,933 = 14.40% 3,419,785,256/19,05 2,891,818 = 17.94% 2014 9,182,781,155/ 24,262,297,324 = 37.84% 5,008,816,403/ 24,262,297,324 = 20.60% 4,031,811,268/24,262 ,297,324 = 16.6% 4,031,811,268/567 ,860,742 = 7.10% 4,031,811,268/26 ,549,534,878 = 15.18% 4,031,811,268/22,27 7,516,628 = 18.09%
- 19. 19 Market Ratios Renata Ltd. Year Price/Earnings ratio = Market price per share of common stock/Earnings per share Book value per share = Common stock equity/Number of shares of common stock outstanding Market book ratio = Market price per share of common stock/Book value per share ofcommon stock 2011 1205/38.51 = 31.29 3,958,608,036/37,362,683.41 = 105.95 1205/105.95 = 11.37 2012 739.50/10.94 = 67.59 5,070,479,748/28,243,813.96 = 179.53 739.50/179.53 = 4.12 2013 722/31.50 = 22.92 629,511,461/44,132,207.21 = 142.64 722/142.64 = 5.06 2014 984/38.77 = 25.38 7,750,713,063/44,128,514.99 = 175.64 984/175.64 = 5.60 Square Pharmaceuticals Ltd. Year Price/Earnings ratio = Market price per share of common stock/Earnings per share Book value per share = Common stock equity/Number ofshares of common stock outstanding Market book ratio = Market price per share of common stock/Book value per share of common stock 2011 327.2/9.56 = 34.23 13,817,708,990/264,834,760 = 52.17 327.2/52.17 = 6.27 2012 237.30/10.94 = 21.69 19,120,019,851/264,834,760 = 72.19 237.30/72.19 = 3.29 2013 178.60/8.36 = 21.36 19,052,891,818/481,659,895.2 = 39.56 178.60/39.56 = 4.51 2014 147.85/7.10 = 20.82 22,277,516,628/482,274,075.1 = 46.19 147.85/46.19 = 3.20


