Location via proxy:   [ UP ]  
[Report a bug]   [Manage cookies]                
SlideShare a Scribd company logo
RANDOLPH D. CARREON
DONNA LOU O. MOSCARE-CARREON
                    with generous support from
Objectives
 This Study sought to understand the nature of the transport
  needs, accessibility, mobility and transport costs of the
  poor and vulnerable groups.

Specifically, this aimed to:

    establish the travel demand patterns of the poor and vulnerable groups;
    look qualitatively into the efficiency of the public transport system vis-
     à-vis the needs of the poor and the vulnerable groups;
    estimate the cost of transport of the poor;
    estimate the actual and desired cost of transport of those within the
     vulnerable groups; and
    examine other non–quantifiable costs, if any, incurred by the
     vulnerable groups.
Study Areas/Groups
 Poor Communities
    Purok Centro, Barangay Old Balara (414 Households)
    Area H, Barangay Bagong Pag-asa (1,415 Households)
    Purok 13, Barangay Payatas (197 Households)
 Vulnerable Groups
    Senior Citizens
    Persons With Disabilities
    Women
    BPO Workers
Summary of Findings
Poor Communities
                       Vehicle Ownership Rate

                                 Motorized          Non–Motorized

          Study Area

                            4W               2W    Bike       Other


 Area H                   3.03%         3.03%     0.00%      1.01%

 Purok Centro             5.43%         9.30%     6.98%      0.78%

 Purok 13                 1.02%         8.16%     3.06%      0.00%
Summary of Findings
Poor Communities
    Person Trip Generation Rate Per Household

                                                   Total Person
                Home-Generated   Person Trip per
   Study Area                                        Trips per
                  (HG) Trips         HG Trip
                                                    Household


   Area H           1.58             4.09             6.44

 Purok Centro       1.90             4.06             7.70

  Purok 13          1.89             3.66             6.90
Summary of Findings
Poor Communities
            Person Trip Generation Per Area

                              Daily                      Annual

    Study Area
                   Home-                          Home-        Home-
                                  Total Person
                  Generated                      Generated    Generated
                                     Trips
                    Trips                          Trips        Trips


 Area H              2,205             9,014     529,315 2,163,288

 Purok Centro           786            3,189     188,600          765,440

 Purok 13               372            1,360       89,307         326,457
Summary of Findings
Poor Communities
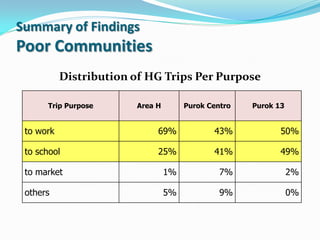
           Distribution of HG Trips Per Purpose

      Trip Purpose      Area H        Purok Centro   Purok 13


 to work                     69%             43%            50%

 to school                   25%             41%            49%

 to market                       1%            7%               2%

 others                          5%            9%               0%
Summary of Findings
 Poor Communities
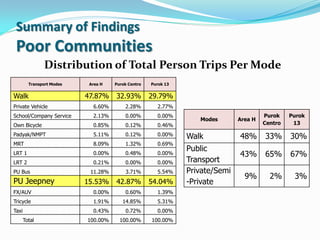
                Distribution of Total Person Trips Per Mode
         Transport Modes    Area H   Purok Centro   Purok 13


Walk                       47.87%    32.93%         29.79%
Private Vehicle              6.60%       2.28%        2.77%
School/Company Service       2.13%       0.00%        0.00%                            Purok    Purok
                                                                  Modes       Area H
Own Bicycle                  0.85%       0.12%        0.46%                            Centro    13

Padyak/NMPT                  5.11%       0.12%        0.00%    Walk           48%      33%      30%
MRT                          8.09%       1.32%        0.69%
                                                               Public
LRT 1                        0.00%       0.48%        0.00%                   43%      65%      67%
LRT 2                        0.21%       0.00%        0.00%    Transport
PU Bus                      11.28%       3.71%        5.54%    Private/Semi
                                                                                9%       2%      3%
PU Jeepney                 15.53%    42.87%         54.04%     -Private
FX/AUV                       0.00%       0.60%        1.39%
Tricycle                     1.91%      14.85%        5.31%
Taxi                         0.43%       0.72%        0.00%
       Total               100.00%     100.00%      100.00%
Summary of Findings
Poor Communities
          Factors Considered in Mode Choice
  Rank          Area H        Purok Centro         Purok 13

   1     Affordability     Affordability     Affordability
         Short Travel      Short Travel      Short Travel
   2
         Duration          Duration          Duration /
   3     Cleanliness       Convenience       Driving Style
         Availability of                     Availability of
   4                       Cleanliness
         Mode                                Mode
   5     Driving Style     Driving Style     Convenience
Summary of Findings
Poor Communities
  Percentage Share of Transport Cost to Total Expenses
                                        Rent-Free                 Renter
          Ownership
                                                 Annual Average
                      Area H (Barangay Bagong Pag-asa)
 Non Vehicle Owner                             4.66%                   5.75%
 Motor Vehicle Owner                          10.97%                   9.62%
                      Purok Centro (Barangay Old Balara)
 Non Vehicle Owner                             4.23%                   6.39%
 Motor Vehicle Owner                          12.24%                  11.53%
                         Purok 13 (Barangay Payatas)
 Non Vehicle Owner                              7.67%                      -
 Motor Vehicle Owner                            7.01%                      -
Summary of Findings
Poor Communities
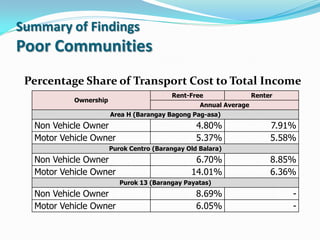
 Percentage Share of Transport Cost to Total Income
                                         Rent-Free                 Renter
           Ownership
                                                  Annual Average
                       Area H (Barangay Bagong Pag-asa)
  Non Vehicle Owner                              4.80%                  7.91%
  Motor Vehicle Owner                            5.37%                  5.58%
                       Purok Centro (Barangay Old Balara)
  Non Vehicle Owner                             6.70%                   8.85%
  Motor Vehicle Owner                          14.01%                   6.36%
                          Purok 13 (Barangay Payatas)
  Non Vehicle Owner                              8.69%                      -
  Motor Vehicle Owner                            6.05%                      -
Summary of Findings
Poor Communities
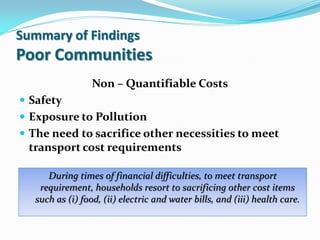
                  Non – Quantifiable Costs
 Safety
 Exposure to Pollution
 The need to sacrifice other necessities to meet
 transport cost requirements

      During times of financial difficulties, to meet transport
    requirement, households resort to sacrificing other cost items
   such as (i) food, (ii) electric and water bills, and (iii) health care.
Summary of Findings
Poor Communities
                          Primary Mobility Problems
                                                               Purok
                      Mobility Problems              Area H              Purok 13
                                                               Centro
 high transport cost                                 75.00% 97.35% 74.49%
 insufficient supply of public transport/MRT           2.00%     0.00%      2.04%
 lack of pedestrian facilities/sidewalks               1.00%     0.00%      1.02%
 non-operational stoplights                            1.00%     0.00%      1.02%
 pollution                                             1.00%     0.88%      1.02%
 poorly maintained vehicles                            3.00%     0.00%      3.06%
 traffic congestion                                   10.00%     1.77%     10.20%
 undisciplined loading and unloading of passengers     2.00%     0.00%      2.04%
 vehicle accidents                                     5.00%     0.00%      5.10%
Summary of Findings
Poor Communities
                        Proposed Solutions
                                                Purok    Purok
             Proposed Solutions        Area H
                                                Centro    13
work for additional income            28.57% 54.29% 29.41%
borrow money                           1.43% 11.43%      1.47%
lower fare                            14.29%    5.71% 11.76%
proper budgeting                       0.00% 11.43%      0.00%
reduce other expenses                  4.29%    4.76%    4.41%
salary increase                        2.86%    0.95%    2.94%
save money                             5.71%    2.86%    5.88%
walk                                   5.71%    0.00%    5.88%
Summary of Findings
Vulnerable Groups – BPO Workers
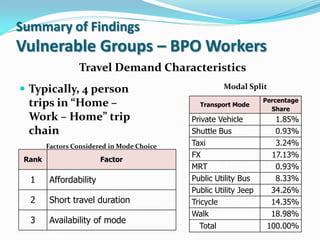
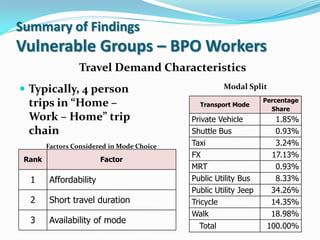
                 Travel Demand Characteristics
 Typically, 4 person                                 Modal Split
                                                                  Percentage
  trips in “Home –                            Transport Mode
                                                                    Share
  Work – Home” trip                         Private Vehicle          1.85%
  chain                                     Shuttle Bus              0.93%
        Factors Considered in Mode Choice   Taxi                     3.24%
                                            FX                      17.13%
 Rank                    Factor
                                            MRT                      0.93%
  1      Affordability                      Public Utility Bus       8.33%
                                            Public Utility Jeep     34.26%
  2      Short travel duration              Tricycle                14.35%
                                            Walk                    18.98%
  3      Availability of mode
                                              Total                100.00%
Summary of Findings
Vulnerable Groups – BPO Workers
                   Direct Costs
 Share of Transport Cost to Total Income
    Vehicle Owners: 5%
    Non Vehicle Owners: 13%

             Non – Quantifiable Costs
 Safety
 Exposure to Pollution
Summary of Findings
    Vulnerable Groups – PWDs

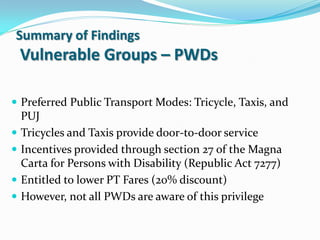
 Preferred Public Transport Modes: Tricycle, Taxis, and
    PUJ
   Tricycles and Taxis provide door-to-door service
   Incentives provided through section 27 of the Magna
    Carta for Persons with Disability (Republic Act 7277)
   Entitled to lower PT Fares (20% discount)
   However, not all PWDs are aware of this privilege
Summary of Findings
 Vulnerable Groups – PWDs
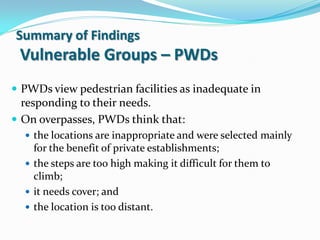
 PWDs view pedestrian facilities as inadequate in
  responding to their needs.
 On overpasses, PWDs think that:
   the locations are inappropriate and were selected mainly
    for the benefit of private establishments;
   the steps are too high making it difficult for them to
    climb;
   it needs cover; and
   the location is too distant.
Summary of Findings
 Vulnerable Groups – Senior Citizens

 Preferred Public Transport Modes: Tricycle, Taxis, and
  PUJ
 Tricycles and Taxis provide door-to-door service
 Incentives provided through Section 2 of the
  Expanded Senior Citizens Act of 2010 (Republic Act
  9994)
 Entitled to lower PT Fares (20% discount)
Summary of Findings
 Vulnerable Groups – Senior Citizens

 They stated that it is hard to go up overpasses and it is
  not easy to walk along narrow sidewalks
 The law providing 20% discount to senior citizens is
  highly appreciated.
 However, concerns are raised on the implementation
  of the discount as some drivers refuse to accept the
  discounted fare.
Summary of Findings
 Vulnerable Groups – Women
 Preferred Public Transport Modes: Tricycle, PUJs, and
  walking
 Women are subject to the same cost of transport as any
  other regular commuter
 Issues on pedestrian facilities especially overpasses:
   height and steepness,
   location,
   condition and need for repair,
   lack of cover, and
   lack of lights at night
Summary of Findings
 Qualitative Assessment of Public
 Transport - Poor
 The residents on the three (3) study areas find the present
    public transport system as “somehow satisfactory”.
   PT terminals are generally regarded as accessible, clean,
    safe, and comfortable.
   There is, however, a general perception of lack of facilities
    in the PT terminals
   in terms of the inter–modal network, there is much to be
    desired.
   Based on these factors, walkability is viewed as “somehow
    satisfactory”
Summary of Findings
 Qualitative Assessment of Public
 Transport – BPO Workers
 BPO Workers generally view public transport as “just right” to
    “good”.
   Taxis and FX received the highest ratings.
   Public transport efficiency with consideration on the (i) fare, (ii)
    availability of mode, and (iii) travel time is generally regarded as
    “just right”
   PT terminals are generally regarded as accessible, clean, safe,
    and comfortable.
   There is a general perception of lack of facilities in the
    terminals
   In terms of connectivity, the public transport network is
    satisfactory
   Walkability is viewed as “generally satisfactory”.
Summary of Findings
Qualitative Assessment of Public Transport
– PWDs, Senior Citizens and Women
 PWDs, SCs, and Women generally view public
    transport modes as acceptable and ‘just right’
   Some units, however, are already dilapidated, worn
    out and are in poor condition.
   The tricycles and taxis are the most preferred because
    these modes enable them to travel faster and offer
    door to door service.
   PUJs are also preferred due to the relatively low fare.
   PT terminals lack facilities except for terminals of
    mass transit systems such as the MRT and LRT.
Recommended Next Step

 further researches
    to expand the scope of this Study to other areas in Metro
     Manila
    to come up with a more comprehensive understanding
     of the mobility of the urban poor
    to address the mobility issues of the urban poor and the
     vulnerable groups
Mobility characteristics, costs, and issues of the poor and vulnerable groups

More Related Content

Mobility characteristics, costs, and issues of the poor and vulnerable groups

  • 1. RANDOLPH D. CARREON DONNA LOU O. MOSCARE-CARREON with generous support from
  • 2. Objectives  This Study sought to understand the nature of the transport needs, accessibility, mobility and transport costs of the poor and vulnerable groups. Specifically, this aimed to:  establish the travel demand patterns of the poor and vulnerable groups;  look qualitatively into the efficiency of the public transport system vis- à-vis the needs of the poor and the vulnerable groups;  estimate the cost of transport of the poor;  estimate the actual and desired cost of transport of those within the vulnerable groups; and  examine other non–quantifiable costs, if any, incurred by the vulnerable groups.
  • 3. Study Areas/Groups  Poor Communities  Purok Centro, Barangay Old Balara (414 Households)  Area H, Barangay Bagong Pag-asa (1,415 Households)  Purok 13, Barangay Payatas (197 Households)  Vulnerable Groups  Senior Citizens  Persons With Disabilities  Women  BPO Workers
  • 4. Summary of Findings Poor Communities Vehicle Ownership Rate Motorized Non–Motorized Study Area 4W 2W Bike Other Area H 3.03% 3.03% 0.00% 1.01% Purok Centro 5.43% 9.30% 6.98% 0.78% Purok 13 1.02% 8.16% 3.06% 0.00%
  • 5. Summary of Findings Poor Communities Person Trip Generation Rate Per Household Total Person Home-Generated Person Trip per Study Area Trips per (HG) Trips HG Trip Household Area H 1.58 4.09 6.44 Purok Centro 1.90 4.06 7.70 Purok 13 1.89 3.66 6.90
  • 6. Summary of Findings Poor Communities Person Trip Generation Per Area Daily Annual Study Area Home- Home- Home- Total Person Generated Generated Generated Trips Trips Trips Trips Area H 2,205 9,014 529,315 2,163,288 Purok Centro 786 3,189 188,600 765,440 Purok 13 372 1,360 89,307 326,457
  • 7. Summary of Findings Poor Communities Distribution of HG Trips Per Purpose Trip Purpose Area H Purok Centro Purok 13 to work 69% 43% 50% to school 25% 41% 49% to market 1% 7% 2% others 5% 9% 0%
  • 8. Summary of Findings Poor Communities Distribution of Total Person Trips Per Mode Transport Modes Area H Purok Centro Purok 13 Walk 47.87% 32.93% 29.79% Private Vehicle 6.60% 2.28% 2.77% School/Company Service 2.13% 0.00% 0.00% Purok Purok Modes Area H Own Bicycle 0.85% 0.12% 0.46% Centro 13 Padyak/NMPT 5.11% 0.12% 0.00% Walk 48% 33% 30% MRT 8.09% 1.32% 0.69% Public LRT 1 0.00% 0.48% 0.00% 43% 65% 67% LRT 2 0.21% 0.00% 0.00% Transport PU Bus 11.28% 3.71% 5.54% Private/Semi 9% 2% 3% PU Jeepney 15.53% 42.87% 54.04% -Private FX/AUV 0.00% 0.60% 1.39% Tricycle 1.91% 14.85% 5.31% Taxi 0.43% 0.72% 0.00% Total 100.00% 100.00% 100.00%
  • 9. Summary of Findings Poor Communities Factors Considered in Mode Choice Rank Area H Purok Centro Purok 13 1 Affordability Affordability Affordability Short Travel Short Travel Short Travel 2 Duration Duration Duration / 3 Cleanliness Convenience Driving Style Availability of Availability of 4 Cleanliness Mode Mode 5 Driving Style Driving Style Convenience
  • 10. Summary of Findings Poor Communities Percentage Share of Transport Cost to Total Expenses Rent-Free Renter Ownership Annual Average Area H (Barangay Bagong Pag-asa) Non Vehicle Owner 4.66% 5.75% Motor Vehicle Owner 10.97% 9.62% Purok Centro (Barangay Old Balara) Non Vehicle Owner 4.23% 6.39% Motor Vehicle Owner 12.24% 11.53% Purok 13 (Barangay Payatas) Non Vehicle Owner 7.67% - Motor Vehicle Owner 7.01% -
  • 11. Summary of Findings Poor Communities Percentage Share of Transport Cost to Total Income Rent-Free Renter Ownership Annual Average Area H (Barangay Bagong Pag-asa) Non Vehicle Owner 4.80% 7.91% Motor Vehicle Owner 5.37% 5.58% Purok Centro (Barangay Old Balara) Non Vehicle Owner 6.70% 8.85% Motor Vehicle Owner 14.01% 6.36% Purok 13 (Barangay Payatas) Non Vehicle Owner 8.69% - Motor Vehicle Owner 6.05% -
  • 12. Summary of Findings Poor Communities Non – Quantifiable Costs  Safety  Exposure to Pollution  The need to sacrifice other necessities to meet transport cost requirements During times of financial difficulties, to meet transport requirement, households resort to sacrificing other cost items such as (i) food, (ii) electric and water bills, and (iii) health care.
  • 13. Summary of Findings Poor Communities Primary Mobility Problems Purok Mobility Problems Area H Purok 13 Centro high transport cost 75.00% 97.35% 74.49% insufficient supply of public transport/MRT 2.00% 0.00% 2.04% lack of pedestrian facilities/sidewalks 1.00% 0.00% 1.02% non-operational stoplights 1.00% 0.00% 1.02% pollution 1.00% 0.88% 1.02% poorly maintained vehicles 3.00% 0.00% 3.06% traffic congestion 10.00% 1.77% 10.20% undisciplined loading and unloading of passengers 2.00% 0.00% 2.04% vehicle accidents 5.00% 0.00% 5.10%
  • 14. Summary of Findings Poor Communities Proposed Solutions Purok Purok Proposed Solutions Area H Centro 13 work for additional income 28.57% 54.29% 29.41% borrow money 1.43% 11.43% 1.47% lower fare 14.29% 5.71% 11.76% proper budgeting 0.00% 11.43% 0.00% reduce other expenses 4.29% 4.76% 4.41% salary increase 2.86% 0.95% 2.94% save money 5.71% 2.86% 5.88% walk 5.71% 0.00% 5.88%
  • 15. Summary of Findings Vulnerable Groups – BPO Workers Travel Demand Characteristics  Typically, 4 person Modal Split Percentage trips in “Home – Transport Mode Share Work – Home” trip Private Vehicle 1.85% chain Shuttle Bus 0.93% Factors Considered in Mode Choice Taxi 3.24% FX 17.13% Rank Factor MRT 0.93% 1 Affordability Public Utility Bus 8.33% Public Utility Jeep 34.26% 2 Short travel duration Tricycle 14.35% Walk 18.98% 3 Availability of mode Total 100.00%
  • 16. Summary of Findings Vulnerable Groups – BPO Workers Travel Demand Characteristics  Typically, 4 person Modal Split Percentage trips in “Home – Transport Mode Share Work – Home” trip Private Vehicle 1.85% chain Shuttle Bus 0.93% Factors Considered in Mode Choice Taxi 3.24% FX 17.13% Rank Factor MRT 0.93% 1 Affordability Public Utility Bus 8.33% Public Utility Jeep 34.26% 2 Short travel duration Tricycle 14.35% Walk 18.98% 3 Availability of mode Total 100.00%
  • 17. Summary of Findings Vulnerable Groups – BPO Workers Direct Costs  Share of Transport Cost to Total Income  Vehicle Owners: 5%  Non Vehicle Owners: 13% Non – Quantifiable Costs  Safety  Exposure to Pollution
  • 18. Summary of Findings Vulnerable Groups – PWDs  Preferred Public Transport Modes: Tricycle, Taxis, and PUJ  Tricycles and Taxis provide door-to-door service  Incentives provided through section 27 of the Magna Carta for Persons with Disability (Republic Act 7277)  Entitled to lower PT Fares (20% discount)  However, not all PWDs are aware of this privilege
  • 19. Summary of Findings Vulnerable Groups – PWDs  PWDs view pedestrian facilities as inadequate in responding to their needs.  On overpasses, PWDs think that:  the locations are inappropriate and were selected mainly for the benefit of private establishments;  the steps are too high making it difficult for them to climb;  it needs cover; and  the location is too distant.
  • 20. Summary of Findings Vulnerable Groups – Senior Citizens  Preferred Public Transport Modes: Tricycle, Taxis, and PUJ  Tricycles and Taxis provide door-to-door service  Incentives provided through Section 2 of the Expanded Senior Citizens Act of 2010 (Republic Act 9994)  Entitled to lower PT Fares (20% discount)
  • 21. Summary of Findings Vulnerable Groups – Senior Citizens  They stated that it is hard to go up overpasses and it is not easy to walk along narrow sidewalks  The law providing 20% discount to senior citizens is highly appreciated.  However, concerns are raised on the implementation of the discount as some drivers refuse to accept the discounted fare.
  • 22. Summary of Findings Vulnerable Groups – Women  Preferred Public Transport Modes: Tricycle, PUJs, and walking  Women are subject to the same cost of transport as any other regular commuter  Issues on pedestrian facilities especially overpasses:  height and steepness,  location,  condition and need for repair,  lack of cover, and  lack of lights at night
  • 23. Summary of Findings Qualitative Assessment of Public Transport - Poor  The residents on the three (3) study areas find the present public transport system as “somehow satisfactory”.  PT terminals are generally regarded as accessible, clean, safe, and comfortable.  There is, however, a general perception of lack of facilities in the PT terminals  in terms of the inter–modal network, there is much to be desired.  Based on these factors, walkability is viewed as “somehow satisfactory”
  • 24. Summary of Findings Qualitative Assessment of Public Transport – BPO Workers  BPO Workers generally view public transport as “just right” to “good”.  Taxis and FX received the highest ratings.  Public transport efficiency with consideration on the (i) fare, (ii) availability of mode, and (iii) travel time is generally regarded as “just right”  PT terminals are generally regarded as accessible, clean, safe, and comfortable.  There is a general perception of lack of facilities in the terminals  In terms of connectivity, the public transport network is satisfactory  Walkability is viewed as “generally satisfactory”.
  • 25. Summary of Findings Qualitative Assessment of Public Transport – PWDs, Senior Citizens and Women  PWDs, SCs, and Women generally view public transport modes as acceptable and ‘just right’  Some units, however, are already dilapidated, worn out and are in poor condition.  The tricycles and taxis are the most preferred because these modes enable them to travel faster and offer door to door service.  PUJs are also preferred due to the relatively low fare.  PT terminals lack facilities except for terminals of mass transit systems such as the MRT and LRT.
  • 26. Recommended Next Step  further researches  to expand the scope of this Study to other areas in Metro Manila  to come up with a more comprehensive understanding of the mobility of the urban poor  to address the mobility issues of the urban poor and the vulnerable groups