Roll Pass Design strategy
•Download as PPT, PDF•
29 likes•8,216 views

1) Roll pass design (RPD) is an important factor for process efficiency, product quality, and resource consumption in hot steel rolling mills. Optimizing RPD can help reduce costs and improve productivity. 2) Scientists analyze large databases of RPDs and rolling parameters to find statistical patterns and relationships hidden within. Generic mathematical functions can be used to define roll groove geometries to aid analysis. 3) The paper presents examples of using generic functions to analyze RPD cases for symmetrical sections. Statistical analysis of past RPD data using the functions can provide insights to optimize existing RPDs and aid in developing new improved RPDs.
Report
Share
Related slideshows


Roll Pass Design strategy
- 1. 1
- 2. A Contribution to Rolling Mill Technology _ Roll Pass Design Strategy for Symmetrical Sections by Sead Spuzic and Kazem Abhary University of South Australia School of Engineering 2
- 3. Keywords • roll pass design (RPD) • statistical analysis • roll wear • generic function • optimisation 3
- 4. Intro • Depreciations caused by large-scale industrial processes call for technological improvements. • Hot steel rolling mills belong to this class of industry. • Here, a key for further optimisation must be sought in the roll pass design (RPD), a principal factor that delimits process efficiency, product quality and resource consumption. 4
- 5. Intro • Scientists and engineers search for statistical patterns hidden within the growing databases. • A prerequisite for understanding the patterns of rolling passes is to intelligently translate the process parameters into appropriate mathematical forms. • Presently, a variety of RPD algorithms offer differing predictions, and the practice of RPD continues to outstrip our theoretical understanding of it. 5
- 6. Intro • Even when the process is developed to a stage when it delivers acceptable products, roll wear still can undermine the rationality of full scale industrial runs. • Rolling substantially depends on the geometry of the deformation zone, which, in turn, depends on the geometries of subsequent grooves. • The whole spectrum of methods (stochastic models, FEM, slip-line-fields, genetic algorithms etc.) relate to some mathematical definition of rolling passes. 6
- 7. Intro • This discussion presents examples of generic functions used to define roll grooves, and the applications of these analytical forms in RPD for symmetrical long products. 7
- 8. Allow me to start by listing a few well known aspects. 8
- 9. Problem specification • Roll pass design is defined by the pass geometry and a range of chemo-physical parameters such as roll speed, bar temperature, chemical composition, cooling rate… • At the start of the rolling sequence, grooves are newly dressed and each point along the groove contour has nearly identical attributes. • As the series of bars continue to be rolled through, the grooves wear unevenly and this causes the changes in 9 pressure and plastic flow distribution.
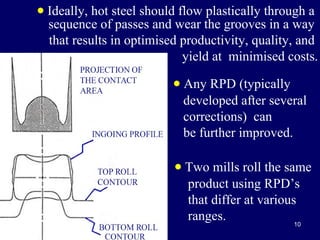
- 10. • Ideally, hot steel should flow plastically through a sequence of passes and wear the grooves in a way that results in optimised productivity, quality, and yield at minimised costs. • Any RPD (typically developed after several corrections) can be further improved. • Two mills roll the same product using RPD’s that differ at various ranges. 10
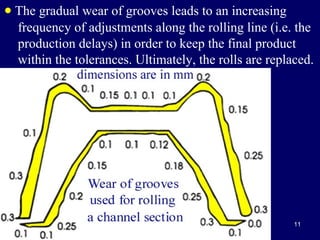
- 11. • The gradual wear of grooves leads to an increasing frequency of adjustments along the rolling line (i.e. the production delays) in order to keep the final product within the tolerances. Ultimately, the rolls are replaced. 11
- 12. Problem specification • Given other the same, grooves can be cut in the rolls in several ways, without increasing the roll cutting costs. • In addition, the nowadays capabilities allow for improving both precision and tolerances in manufacturing the rolls. • Previously, RPD was restricted by a motivation to rationalise the numeric results - round them to less decimal places and avoid complex curves. 12
- 13. Problem specification • This is in obvious contrast with the modern tertiary industry standards, where for example the strict requirements are posed on manufacturing components such as the mass of rear mirrors on passenger cars. • In order to extract knowledge from large RPD data bases (which includes the records addressing the performance), the roll passes should be translated into some convenient mathematical form. 13
- 14. Problem specification • As a first approach, a number of candidate functions were analysed to select a generic function that satisfies very wide range of simple symmetrical grooves. • A focus on the cases that have at least two mutually perpendicular planes of symmetry allows for reducing the groove meridian to the first quadrant of the Cartesian coordinate system. 14
- 15. Problem specification • There is a number of possible solutions to this problem, and a suitable option depends on the type of analysed rolling series and the purpose of investigation. • Such generic functions are convenient for a range of mathematical & computerised analyses, e.g. the function parameters can be treated as vectors where the components are extendible to include further parameters of the rolling process (bar velocity, roll hardness, chem. compositions, mechanical attributes etc). 15
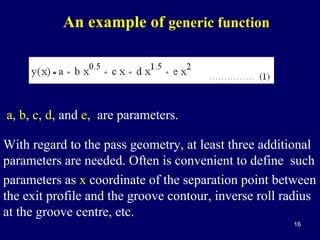
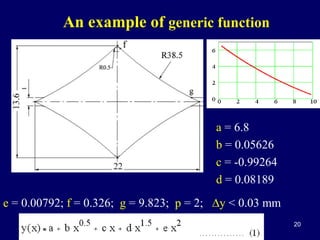
- 16. An example of generic function a, b, c, d, and e, are parameters. With regard to the pass geometry, at least three additional parameters are needed. Often is convenient to define such parameters as x coordinate of the separation point between the exit profile and the groove contour, inverse roll radius at the groove centre, etc. 16
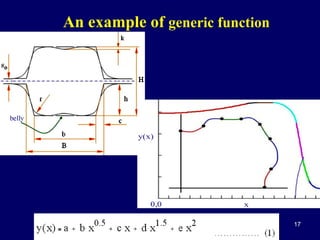
- 17. An example of generic function 17
- 18. An example of generic function 18
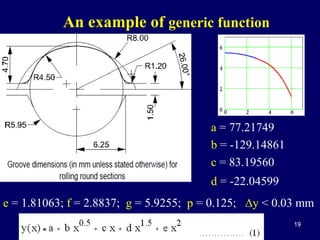
- 19. An example of generic function a = 77.21749 b = -129.14861 c = 83.19560 d = -22.04599 e = 1.81063; f = 2.8837; g = 5.9255; p = 0.125; ∆y < 0.03 mm 19
- 20. An example of generic function a = 6.8 b = 0.05626 c = -0.99264 d = 0.08189 e = 0.00792; f = 0.326; g = 9.823; p = 2; ∆y < 0.03 mm 20
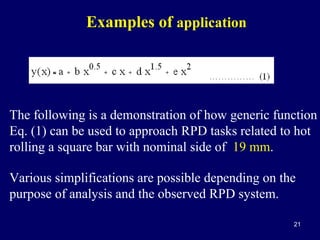
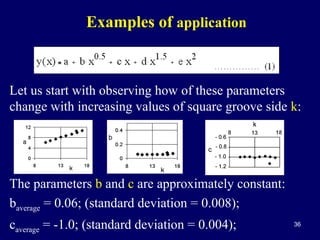
- 21. Examples of application The following is a demonstration of how generic function Eq. (1) can be used to approach RPD tasks related to hot rolling a square bar with nominal side of 19 mm. Various simplifications are possible depending on the purpose of analysis and the observed RPD system. 21
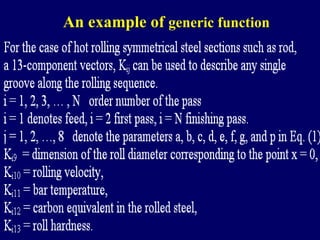
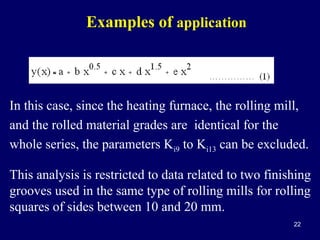
- 22. Examples of application In this case, since the heating furnace, the rolling mill, and the rolled material grades are identical for the whole series, the parameters Ki9 to Ki13 can be excluded. This analysis is restricted to data related to two finishing grooves used in the same type of rolling mills for rolling squares of sides between 10 and 20 mm. 22
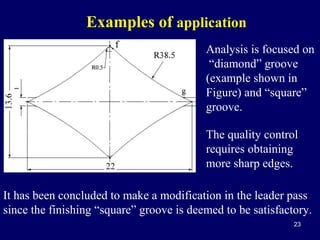
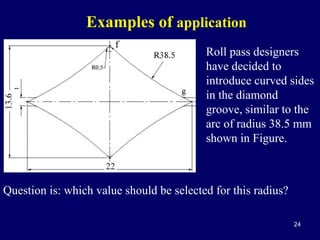
- 23. Examples of application Analysis is focused on “diamond” groove (example shown in Figure) and “square” groove. The quality control requires obtaining more sharp edges. It has been concluded to make a modification in the leader pass since the finishing “square” groove is deemed to be satisfactory. 23
- 24. Examples of application Roll pass designers have decided to introduce curved sides in the diamond groove, similar to the arc of radius 38.5 mm shown in Figure. Question is: which value should be selected for this radius? 24
- 25. Examples of application Bearing in mind the sharp edge requirement, the parameter f can be taken to be approximately equal to zero, while the parameter p can be excluded from this analysis. The fillet radius at the roll collar (at the point g) is calculated as 0.2W , where W = theoretical width at the level of roll gap (at y = 0). 25
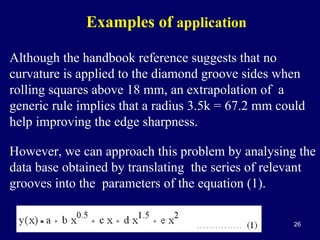
- 26. Examples of application Although the handbook reference suggests that no curvature is applied to the diamond groove sides when rolling squares above 18 mm, an extrapolation of a generic rule implies that a radius 3.5k = 67.2 mm could help improving the edge sharpness. However, we can approach this problem by analysing the data base obtained by translating the series of relevant grooves into the parameters of the equation (1). 26
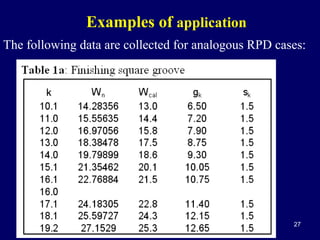
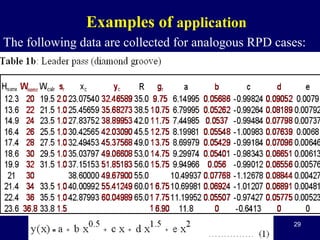
- 27. Examples of application The following data are collected for analogous RPD cases: 27
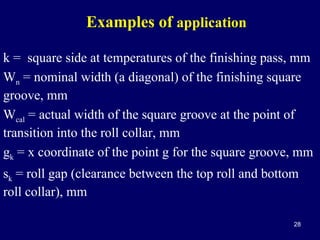
- 28. Examples of application k = square side at temperatures of the finishing pass, mm Wn = nominal width (a diagonal) of the finishing square groove, mm Wcal = actual width of the square groove at the point of transition into the roll collar, mm gk = x coordinate of the point g for the square groove, mm sk = roll gap (clearance between the top roll and bottom roll collar), mm 28
- 29. Examples of application The following data are collected for analogous RPD cases: 29
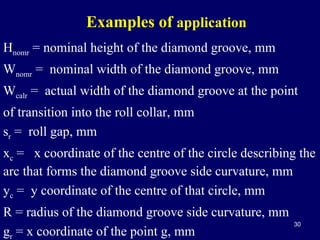
- 30. Examples of application Hnomr = nominal height of the diamond groove, mm Wnomr = nominal width of the diamond groove, mm Wcalr = actual width of the diamond groove at the point of transition into the roll collar, mm sr = roll gap, mm xc = x coordinate of the centre of the circle describing the arc that forms the diamond groove side curvature, mm yc = y coordinate of the centre of that circle, mm R = radius of the diamond groove side curvature, mm gr = x coordinate of the point g, mm 30
- 31. Examples of application A simple correlation with the square side k, based on the regression analysis of the data in Table 1 R = regression function (k), confirms the value of 67.2 mm, the same as suggested by the generic rule R = 3.5k = 3.5 ·19.2 = 67.2 mm. However, the data in Table 1 indicate that for k = 19 mm the curvature of the diamond groove side disappears. 31
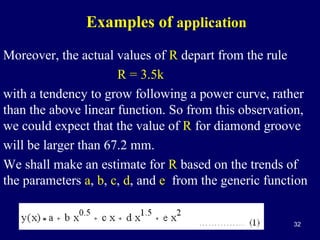
- 32. Examples of application Moreover, the actual values of R depart from the rule R = 3.5k with a tendency to grow following a power curve, rather than the above linear function. So from this observation, we could expect that the value of R for diamond groove will be larger than 67.2 mm. We shall make an estimate for R based on the trends of the parameters a, b, c, d, and e from the generic function 32
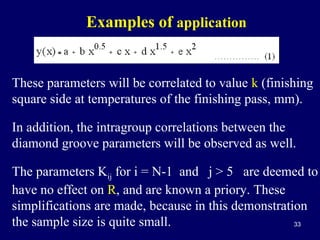
- 33. Examples of application These parameters will be correlated to value k (finishing square side at temperatures of the finishing pass, mm). In addition, the intragroup correlations between the diamond groove parameters will be observed as well. The parameters Kij for i = N-1 and j > 5 are deemed to have no effect on R, and are known a priory. These simplifications are made, because in this demonstration the sample size is quite small. 33
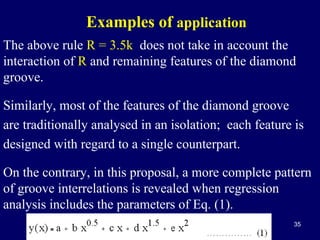
- 35. Examples of application The above rule R = 3.5k does not take in account the interaction of R and remaining features of the diamond groove. Similarly, most of the features of the diamond groove are traditionally analysed in an isolation; each feature is designed with regard to a single counterpart. On the contrary, in this proposal, a more complete pattern of groove interrelations is revealed when regression analysis includes the parameters of Eq. (1). 35
- 36. Examples of application Let us start with observing how of these parameters change with increasing values of square groove side k: The parameters b and c are approximately constant: baverage = 0.06; (standard deviation = 0.008); caverage = -1.0; (standard deviation = 0.004); 36
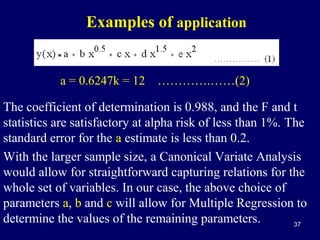
- 37. Examples of application a = 0.6247k = 12 ………….……(2) The coefficient of determination is 0.988, and the F and t statistics are satisfactory at alpha risk of less than 1%. The standard error for the a estimate is less than 0.2. With the larger sample size, a Canonical Variate Analysis would allow for straightforward capturing relations for the whole set of variables. In our case, the above choice of parameters a, b and c will allow for Multiple Regression to determine the values of the remaining parameters. 37
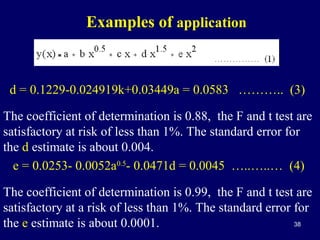
- 38. Examples of application d = 0.1229-0.024919k+0.03449a = 0.0583 ……….. (3) The coefficient of determination is 0.88, the F and t test are satisfactory at risk of less than 1%. The standard error for the d estimate is about 0.004. e = 0.0253- 0.0052a0.5- 0.0471d = 0.0045 …..…..… (4) The coefficient of determination is 0.99, the F and t test are satisfactory at a risk of less than 1%. The standard error for 38 the e estimate is about 0.0001.
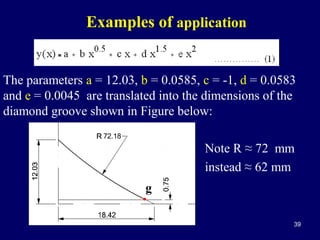
- 39. Examples of application The parameters a = 12.03, b = 0.0585, c = -1, d = 0.0583 and e = 0.0045 are translated into the dimensions of the diamond groove shown in Figure below: Note R ≈ 72 mm instead ≈ 62 mm g ● 39
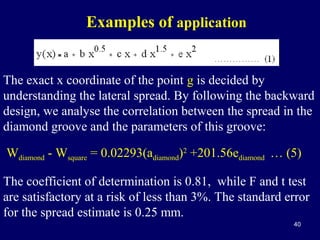
- 40. Examples of application The exact x coordinate of the point g is decided by understanding the lateral spread. By following the backward design, we analyse the correlation between the spread in the diamond groove and the parameters of this groove: Wdiamond - Wsquare = 0.02293(adiamond)2 +201.56ediamond … (5) The coefficient of determination is 0.81, while F and t test are satisfactory at a risk of less than 3%. The standard error for the spread estimate is 0.25 mm. 40
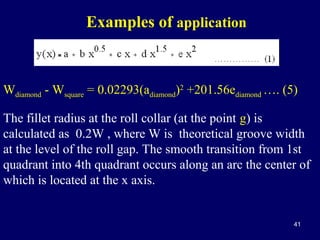
- 41. Examples of application Wdiamond - Wsquare = 0.02293(adiamond)2 +201.56ediamond …. (5) The fillet radius at the roll collar (at the point g) is calculated as 0.2W , where W is theoretical groove width at the level of the roll gap. The smooth transition from 1st quadrant into 4th quadrant occurs along an arc the center of which is located at the x axis. 41
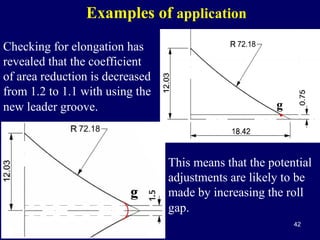
- 42. Examples of application Checking for elongation has revealed that the coefficient of area reduction is decreased from 1.2 to 1.1 with using the new leader groove. g ● This means that the potential adjustments are likely to be made by increasing the roll gap. 42
- 43. Examples of application Also, since it should be anticipated that the wear in the diamond groove is allowed to proceed faster than the wear in the finishing square groove, the space is made available for such increases in the diamond grove area. Finally, if a groove geometry correction by grinding will become inevitable, the space is made available for the consequent increases in the diamond grove area. 43
- 44. Examples of application As another example, let us consider a situation when a manufacturer produces a whole series of square sections shown in Table 1. In the industrial practice, the members of the series rarely show mutually equal level of performance indicators. Frequently, one or several members are difficult to control or otherwise show a poor performance. 44
- 45. Examples of application The following data are collected for analogous RPD cases: 45
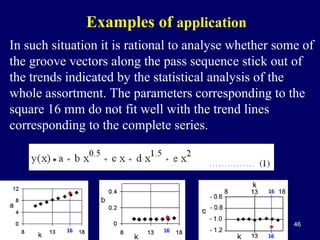
- 46. Examples of application In such situation it is rational to analyse whether some of the groove vectors along the pass sequence stick out of the trends indicated by the statistical analysis of the whole assortment. The parameters corresponding to the square 16 mm do not fit well with the trend lines corresponding to the complete series. 46
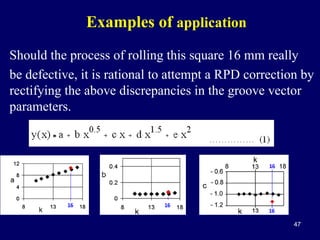
- 47. Examples of application Should the process of rolling this square 16 mm really be defective, it is rational to attempt a RPD correction by rectifying the above discrepancies in the groove vector parameters. 47
- 48. Examples of application The above case analyses provide supporting evidence in favour of the proposed RPD strategy. These analyses present the models, while finding the more reliable estimates must be founded on a larger data base. An approximate rule for the recommended count of observations is shown in Eq. (6): N ≥ 50 + 8z …….. (6) N = the count of samples, z = the count of the involved variables. 48
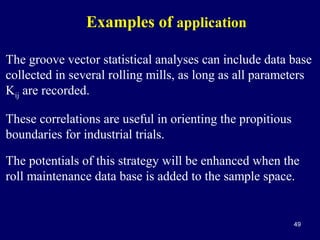
- 49. Examples of application The groove vector statistical analyses can include data base collected in several rolling mills, as long as all parameters Kij are recorded. These correlations are useful in orienting the propitious boundaries for industrial trials. The potentials of this strategy will be enhanced when the roll maintenance data base is added to the sample space. 49
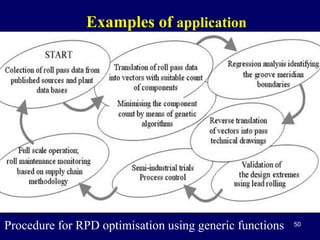
- 50. Examples of application Procedure for RPD optimisation using generic functions 50
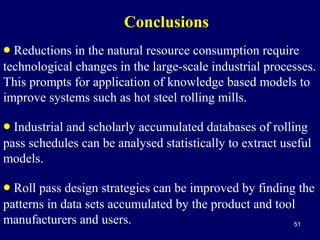
- 51. Conclusions • Reductions in the natural resource consumption require technological changes in the large-scale industrial processes. This prompts for application of knowledge based models to improve systems such as hot steel rolling mills. • Industrial and scholarly accumulated databases of rolling pass schedules can be analysed statistically to extract useful models. • Roll pass design strategies can be improved by finding the patterns in data sets accumulated by the product and tool manufacturers and users. 51
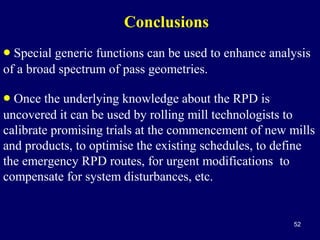
- 52. Conclusions • Special generic functions can be used to enhance analysis of a broad spectrum of pass geometries. • Once the underlying knowledge about the RPD is uncovered it can be used by rolling mill technologists to calibrate promising trials at the commencement of new mills and products, to optimise the existing schedules, to define the emergency RPD routes, for urgent modifications to compensate for system disturbances, etc. 52
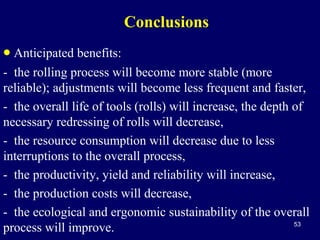
- 53. Conclusions • Anticipated benefits: - the rolling process will become more stable (more reliable); adjustments will become less frequent and faster, - the overall life of tools (rolls) will increase, the depth of necessary redressing of rolls will decrease, - the resource consumption will decrease due to less interruptions to the overall process, - the productivity, yield and reliability will increase, - the production costs will decrease, - the ecological and ergonomic sustainability of the overall 53 process will improve.
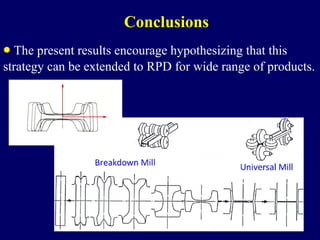
- 54. Conclusions • The present results encourage hypothesizing that this strategy can be extended to RPD for wide range of products. 54
- 55. Conclusions • An industrial application of the proposed strategy requires collaboration of the academic and engineering systems with other institutions responsible for recovering the sustainable balance. • Further research is recommended to explore the possibility of a minimising the count of parameters of the proposed generic functions and to explore the broader potentials for RPD optimisations by using the parametric models. 55
- 56. I shall be available at the booth in the foyer during the breaks. Ich werde auf dem Stand im Foyer erhältlich in den Pausen. Je serai disponible sur le stand dans le hall pendant les pauses. Sarò a disposizione presso lo stand nel foyer durante le pause. I deverão estar disponíveis no estande no foyer durante os intervalos. Jag ska vara tillgänglig i montern i foajén under pauserna. 我将在休息大厅展位。 56
- 57. Thank you for your patience. Questions please? 57
- 58. I shall be available at the booth in the foyer during the breaks. Ich werde auf dem Stand im Foyer erhältlich in den Pausen. Je serai disponible sur le stand dans le hall pendant les pauses. Sarò a disposizione presso lo stand nel foyer durante le pause. I deverão estar disponíveis no estande no foyer durante os intervalos. Jag ska vara tillgänglig i montern i foajén under pauserna. 我将在休息大厅展位。 58