Abstract
Arctic stream biofilm responses to ongoing climate-related changes in physical and chemical conditions have major implications for stream food webs and biogeochemical cycles. Yet, such effects have rarely been studied outside summer months or at sub-catchment scales in the Arctic. We used deployments of nutrient diffusing substrates (NDS) to assess the spatial (20 deployments) and seasonal patterns (10 deployments) and physical and chemical drivers of nutrient limitation within an Arctic stream catchment. Results show that nutrient limitation of autotrophic processes was common during summer, but that light inhibited biomass accrual under the ice in winter. Alongside single N, P and C responses, co-limitation dominated the overall pattern of limitation over time and across the catchment. However, the primary limiting nutrient to autotrophs changed from N to P in parts of the catchment with higher N concentrations. As Arctic studies are often conducted at individual sites during summer, these may miss shifts in the drivers of stream productivity that arise from variable nutrient, temperature, and light regimes. Our results caution against focusing on one single most important limiting nutrient, as we found that this can shift seasonally and over small spatial scales in this Arctic catchment.
Introduction
Increasing temperatures and altered precipitation regimes are expected to have pronounced seasonal influences on Arctic ecosystems. Indeed, climate change-driven warming of the Arctic is predicted to be strongest during shoulder seasons (spring and autumn, Xu et al., 2013), accompanied by shifting precipitation regimes that could drastically alter hydrological patterns in the Arctic (ACIA, 2004). Together, these trends are responsible for changing the spatial distribution and productivity of Arctic vegetation (Mao et al., 2016), and reshaping the hydrological export of nutrients from soils (Abbott et al., 2015). Such changes are also likely to have consequences for the productivity of Arctic streams and rivers, either directly through effects on habitat condition (e.g., temperature; Hood et al., 2018) or indirectly through effects on inputs of terrestrial resources (e.g. Kendrick et al., 2018a; Myrstener et al., 2018). Predicting the consequences of a warmer, wetter Arctic for streams and rivers thus requires a better understanding of how multiple physical and chemical factors interact over space and time to regulate biological processes.
For Arctic streams and rivers, future shifts in productivity will likely be determined by how biofilm communities respond to changing environmental conditions. Biofilms regulate a range of biogeochemical processes in streams (Battin et al., 2016) and represent a critical base for aquatic food webs (Kendrick et al., 2018b). Both autotrophic and heterotrophic biofilm communities are sensitive to thermal regimes (Welter et al., 2015), and autotrophs are additionally influenced by incident light (e.g., Hill et al., 2009). Furthermore, low supplies of essential resources (e.g. nitrogen: N, phosphorus: P, and organic carbon: C) may also limit the growth of autotrophic and/or heterotrophic biofilms, even during unfavorable light and/or temperature conditions (Myrstener et al., 2018). Because aquatic ecosystems in the Arctic are often strongly oligotrophic (Kling et al., 1990), even small changes in the supply of these resources from soils could have important consequences for aquatic productivity (Levine & Whalen, 2001; Myrstener et al., 2021a).
A common shortcoming of many studies addressing nutrient limitation in Arctic aquatic ecosystems has been a limited spatial and temporal scope (e.g. Fridberg et al., 2009; Kendrick & Huryn 2015; Myrstener et al., 2018). Most studies assess resource limitation as snapshots in time, most often during summer, when both light and temperature are elevated. In addition, most studies in running waters have focused on a single study system (e.g., Peterson et al., 1985), or have contrasted systems of similar drainage size (e.g., Myrstener et al., 2018). Together, these approaches might fail to account for important variation in limiting factors that are ultimately important for regulating annual productivity of river networks. For example, inorganic N is often highest in autumn and throughout the winter and decreases over the summer (Holmes et al., 2000; Bergström et al., 2013; Khosh et al., 2017). Phosphorous concentrations are less studied, and less predictable, but in Sweden they followed an opposing trend, compared to dissolved inorganic nitrogen (DIN), with highest concentrations in summer. This suggests important seasonal changes in the relative availability of N and P that likely interact with thermal and light regimes to regulate stream productivity throughout the year. Similarly, variation in topography, soil structure, hydrological routing, and vegetation cover in Arctic catchments (e.g., Weih 1998; Humborg et al., 2004; Björk et al., 2007) may generate considerable variability in the factors regulating biofilm production within the same drainage system. Overall, a deeper understanding of what regulates biofilm productivity in Arctic rivers requires that we account for this temporal and spatial heterogeneity.
In this paper, we evaluate spatial and temporal patterns of resource limitation to stream biofilms in an Arctic landscape. We ask how physical (light, temperature) and chemical (nutrients and organic carbon) factors interact with the nutrient regime to regulate biofilm growth across seasons and across streams within one catchment. First, we test for the persistence of N-limitation in the Abisko region described by Bergström et al. (2013) and Myrstener et al., (2018). In particular, we did this by expanding the temporal window of assessment to include late winter, and spring and fall “shoulder seasons” (Kendrick and Huryn 2015), which are periods of elevated light and N early and late in the growing season. We addressed this question through continuous deployments of nutrient diffusing substrates (NDS) at a single stream in the Miellajokka catchment of northern Sweden from winter (March) to autumn (September). We hypothesized that during winter, light and temperature would be main limiting factors for both heterotrophic and autotrophic activity while during shoulder seasons, increases in inorganic N concentrations might lead to P limitation. Finally, to ask how the factors regulating autotrophic biofilm growth may vary spatially, we conducted a study of nutrient limitation at 20 locations distributed across the Miellajokka stream network during three weeks in summer. For this, we selected stream reaches with different size and sub-catchment characteristics (e.g. tundra versus mountain birch forest) to encompass a broad gradient of physical and chemical conditions. Here, we hypothesized that the headwaters in the birch forest which have higher concentrations of inorganic N would display more P limitation compared to the tundra streams (Myrstener et al., 2021a).
Materials and methods
Study sites
The study was conducted in the Miellajokka catchment (Fig. 1; Tab. S1), close to Abisko (68°19′23″N, 18°51′57″E) northern Sweden. The catchment is 52.5 km2 and ranges from 1731 m.a.s.l., to the outlet approx. 340 m.a.s.l with the tree line around 700 m.a.s.l (Rocher-Ros et al., 2019). Total annual nitrogen deposition (wet + dry) is lower than 1 kg N ha−1 yr−1 (Bergström et al., 2013). Mean annual temperature is 0.7 °C and annual precipitation 310 mm at the closest weather station (Kohler et al., 2006; 1913–2000).

Map showing the location of the field sites within Sweden and within the catchment of the Miellajokka River. A is an underwater picture of NDS at the end of deployment AugD2 (08/09/2021). Frame B and C zoom in on the birch forest + mixed sites and the tundra sites. Sites noted with a circle were used in the spatial study and the star shows the site used for the seasonal survey
The vegetation in riparian zones of the tundra streams is predominantly characterized by meadow and heath with willow (Salix ssp.), whereas mountain birch forest [Betula pubescens spp. czerepanovii (N.I.Orlova) Hämet-Ahti] dominates riparian zones below the tree line, resulting in greater canopy cover after leaf out. The tundra streams are sustained by snowfields, two small lakes, and precipitation while headwater streams in the birch forest are mostly groundwater fed and have comparatively stable flow throughout the season. The nitrate concentrations in the headwaters of the birch forest are higher compared to other lakes and streams in this area (Bergström et al., 2013; Myrstener et al., 2018). The larger birch forest streams (M2, M3 and M19) integrate these different water sources.
Seasonal survey of resource limitation
We conducted a seasonal survey to assess biofilm resource limitation at one of the small birch forest streams, site M18 (Fig. 1, Fig. S7) aiming to test for temporal differences in temperature, light, and resources (C, N and P). In March, most streams are fully ice covered and there is snow on the ground for all of April. The spring flood usually occurs in late May to June and the streams freeze-up again in October. We deployed 10 continuous nutrient-diffusing substrata (NDS) from March to October with each individual deployment being three weeks (Tab. S2). The first two deployments were conducted during ice cover in the stream, NDS were placed under ice. Terrestrial snow cover was still present during the 3rd deployment, but the stream was open. NDS were deployed in combination with HOBO pendant loggers (Onset Computer Corporation, Borne, USA) to measure light (lux) and temperature. Preparation of the NDS followed Tank, Reisinger and Rosi, (2017) using 30 ml Poly-Cons® -cups (Madan Plastics Inc., Cranford, USA) filled with 2% agar solution and capped with a lid with a 25 mm hole. We used fritted ceramic discs (inorganic surface) to target autotrophs, and cellulose sponges (organic surface) to target heterotrophic microorganisms (Johnson et al., 2009). Agar solutions were prepared with 0.5 M NaNO3 (N-Treatment), 0.5 M KH2PO4 and from mid-April (April deployment 2; AprilD2) 0.5 M K2HPO4 (P-treatment), a combination of both (NP-treatment) and unamended agar, serving as controls (A-treatment) for autotrophic NDS. For the heterotrophic NDS, we also added a carbon treatment using 0.5 M CH3COONa (C-treatment) and C + N + P (CNP-treatment). Each treatment was replicated five times. To prevent possible formation of peroxides and resulting inhibition effects (Tanaka et al., 2014) agar and P-salt were boiled separately and combined after cooling. The P-salt was exchanged after two deployment periods, from the mono-basic (KH2PO4) to the di-basic form (K2HPO4) salt, to prevent lowering the pH, which could affect biofilm composition (Lear et al., 2009). The cups were placed randomly on L-bars and attached with re-bars to the stream bottom, in the flow direction of the stream. Upon retrieval, NDS surfaces were placed in individual 50 ml Falcon tubes (Sarstedt, Nümbrecht, Germany) filled with stream water. Samples and stream water were stored at 4 °C until further analysis.
Incubations of NDS surfaces for gross primary production (GPP) and community respiration (CR) were analyzed within 24 h after collection, using the modified dark bottle method (Johnson et al., 2009). The falcon tubes were filled with oxygen saturated stream water and closed under water to avoid bubbles or headspace. Dissolved oxygen (DO) saturation was measured pre and post- incubation using a handheld DO meter (YSI Pro ODO, Yellow Springs, USA) to measure oxygen production and consumption. Fritted ceramic surfaces were incubated in both light and dark (for GPP), while cellulose surfaces were only incubated in dark (for CR). For GPP, NDS were first incubated for 3 h in light (150 µmol m−2 s−1, Sanyo Versatile environmental chamber MLR-351, SANYO Electric Co., Ltd., Osaka, Japan) at 20 °C. Following the light incubation, we measured DO concentrations, replaced the water in the tubes, and directly incubated in the dark at 20 °C for 3 h. After that, final DO was measured. During both incubations, three blanks, treated the same way as the NDS samples, were used to correct for any water column changes in DO. For CR, only dark incubations were conducted. GPP (µg O2 cm−2 h−1) was calculated as the sum of the background corrected DO increase during light incubation and the oxygen consumption during dark incubations.
where ΔDO is the difference in DO concentration before and after incubation, V the volume of the falcon tubes, t the exact incubation time and A the area of the surface (\({A}_{F}\) = area fritted ceramic disc, \({A}_{C}\) = area cellulose sponges). Similarly, CR (µg O2 cm−2 h−1) was calculated as the background corrected consumption of DO in dark incubations.
Following incubations, the ceramic surfaces were stored at 4 °C until extraction for chlorophyll-a (Chl-a) analysis. The analysis was done following Steinman et al., (2017), using 20 ml 90% acetone dark extraction for 24 h extraction until analysis on a JASCO UV spectrophotometer (model V-650, JASCO Corporation, Tokyo, Japan). Chl-a was corrected for the degradation product pheophytin (Steinman et al., 2017) and presented per surface area (µg cm−2).
Spatial survey of resource limitation
In contrast to the seasonal survey, which targeted environmental changes over time, the spatial survey addresses spatial variability among streams of variable size and sub-catchment properties. The three-week survey was initiated in July and was conducted using the same NDS method as described above. However, in this case only ceramic surfaces were used with four treatments (A, N, P and NP) and four replicates each. 20 sites were picked of which 9 were located in the tundra headwaters, 8 in birch forest headwaters and 3 in the larger streams within the birch forest (mixed, M2, M3 and M19, Tab. S1, Fig. 1, Fig. S8). Sites were chosen to keep an in-stream distance of at least 500 m in the tundra and 150 m in the birch forest. NDS for the spatial survey were stored at − 80 °C until spectrophotometrical analysis for Chl-a as described above.
Environmental variables
Filtered water samples (0.45 µm Millex HA filter; Millipore, Burlington, USA) were taken for dissolved organic carbon (DOC, acidified with 250 µl 8 M HCl) and dissolved nutrients (DIN: dissolved inorganic nitrogen; SRP: soluble reactive phosphorous) at the start and end of each deployment. Water samples for total phosphorous (TP) were left unfiltered. Samples were stored in the fridge (DOC) and freezer (DIN, SRP, TP) until analysis at the Biogeochemical Analytical Facility (BAF), Umeå University. NO3-N (Method No. Q-126–12 Rev. 1), NH4-N (Method No. Q-033–04 Rev. 8), SRP (Method No. Q-125–12 Rev 1) and TP (Method No. Q-115–10 Rev. 4) were analyzed using SEAL Analytical QuAAtro 39 (SEAL Analytical, Mequon, WI, USA) and DOC was analyzed on a FormacsHT (Skalar, Inc., Buford USA) total organic carbon analyzer. All data analyses use the average of the two sampling points (start and end). Dissolved inorganic nitrogen (DIN) represents the sum of NO3-N and NH4-N.
Light and temperature data from the HOBO pendant loggers were used to calculate mean temperature and mean total incident light per day, expressed as daily photon flux (DPF, mol m−2 d−1) per deployment. DPF and temperature represent mean values over a 19-day period per deployment. Daily photon flux was calculated by converting light data from lux to photosynthetically active radiation (PAR) using the conversion factor 0.0185 (Thimijan & Heins, 1983).
Statistical analyses
We addressed nutrient limitation and co-limitation according to Tank et al. (2017, Tab. S3). Here, single N or P limitation represents a significant treatment effect from either N or P alone with no additional effect of adding them in combination. Co-limitation is represented by multiple outcomes, including when both individual N and P treatments are greater than controls, when there is only an effect of adding NP in combination, or when all three (N, P, and NP) are significantly greater than controls. In addition to this, we use the terms ‘primary’ and ‘secondary’ limitation to represent the case when one nutrient (N or P) has a significant effect when added alone, but there is an additive effect of adding NP in combination. In this case, the nutrient that induces a response by itself is the primary limiting nutrient and the other is the secondary limiting nutrient. Finally, to display the extent of treatment effects, we report the log10 transformed response ratios (RRTreatment) for Chl-a accrual, GPP and CR. To do this, each treatment replicate was divided by the mean of control Chl-a, GPP and CR, resulting in five individual RR per treatment. If the logRR was > 0 there was a treatment effect, i.e. nutrient limitation of the corresponding nutrient addition. LogRR = 0 indicates no effect of nutrient addition, logRR < 0 indicates nutrient inhibition and logRR = 0.3 is a twofold increase.
Seasonal survey
To assess resource limitation from the seasonal survey we used a linear mixed-effects model (LMM) from the “lme4” R package (version 1.1–28) to determine how and if time and treatment significantly influenced response variables (i.e. Chl-a, GPP and CR). Here, treatment and date (i.e. deployment) were used as fixed factors and date was further included as a nested random factor. Bonferroni-corrected (α = n/p with n = 10 deployments, P = 0.05) one-way ANOVA was used to assess the treatment effect. Post hoc TukeyHSD (Honestly Significant Difference) was finally used to show significant treatments.
Temporal changes of the response variables Chl-a, GPP and CR against water chemistry, light, temperature and depth were explored with partial least squares regression (PLSR). For this analysis we used the R package “pls” (version 2.7–3) and leave-one-out cross-validation. PLSR summarizes linear, multivariate correlations between independent and response variables by producing latent variables which maximize the explained variability in Y and reduce the original multidimensionality (Carrascal et al., 2009). We identified the most important predictors based on VIP scores (variables important in projection) above 1 (Mehmood et al., 2012). Presented in the PLSR figures are correlations between independent variables and the response variable (Chl-a RRNP or CR RRCNP) and the model scores of each NDS. All analyses were performed using R Statistical Software Version 4.1.0 (www.r-project.org).
Spatial survey
A Bonferroni-corrected (α = n/p with n = 20 sites, P = 0.05) one-way ANOVA was used with data from all 20 sites to test for significant differences in Chl-a accumulation across treatments. Post-hoc Fisher’s-LSD was used to explore specific differences between treatments. In addition, the results of the spatial survey were assessed with partial least squares (PLS) regression in the same way as for the seasonal survey to analyze potential drivers of Chl-a RRNP, including temperature, light and water chemistry. All analyses were performed using R Statistical Software Version 4.1.0 (www.r-project.org).
Results
Seasonal survey
Seasonal water chemistry, temperature and light
In-stream temperatures and light intensity underwent drastic changes during the study period (Table 1). Stream temperature was low (0.3–2.2 °C) until June and peaked at 8.9 °C in August. Light increased from 2.0 to 9.3 mol m−2 d−1 between March and May as the ice thawed (Table 1), and then decreased again to 2.9 mol m−2 d−1 by the end of September.
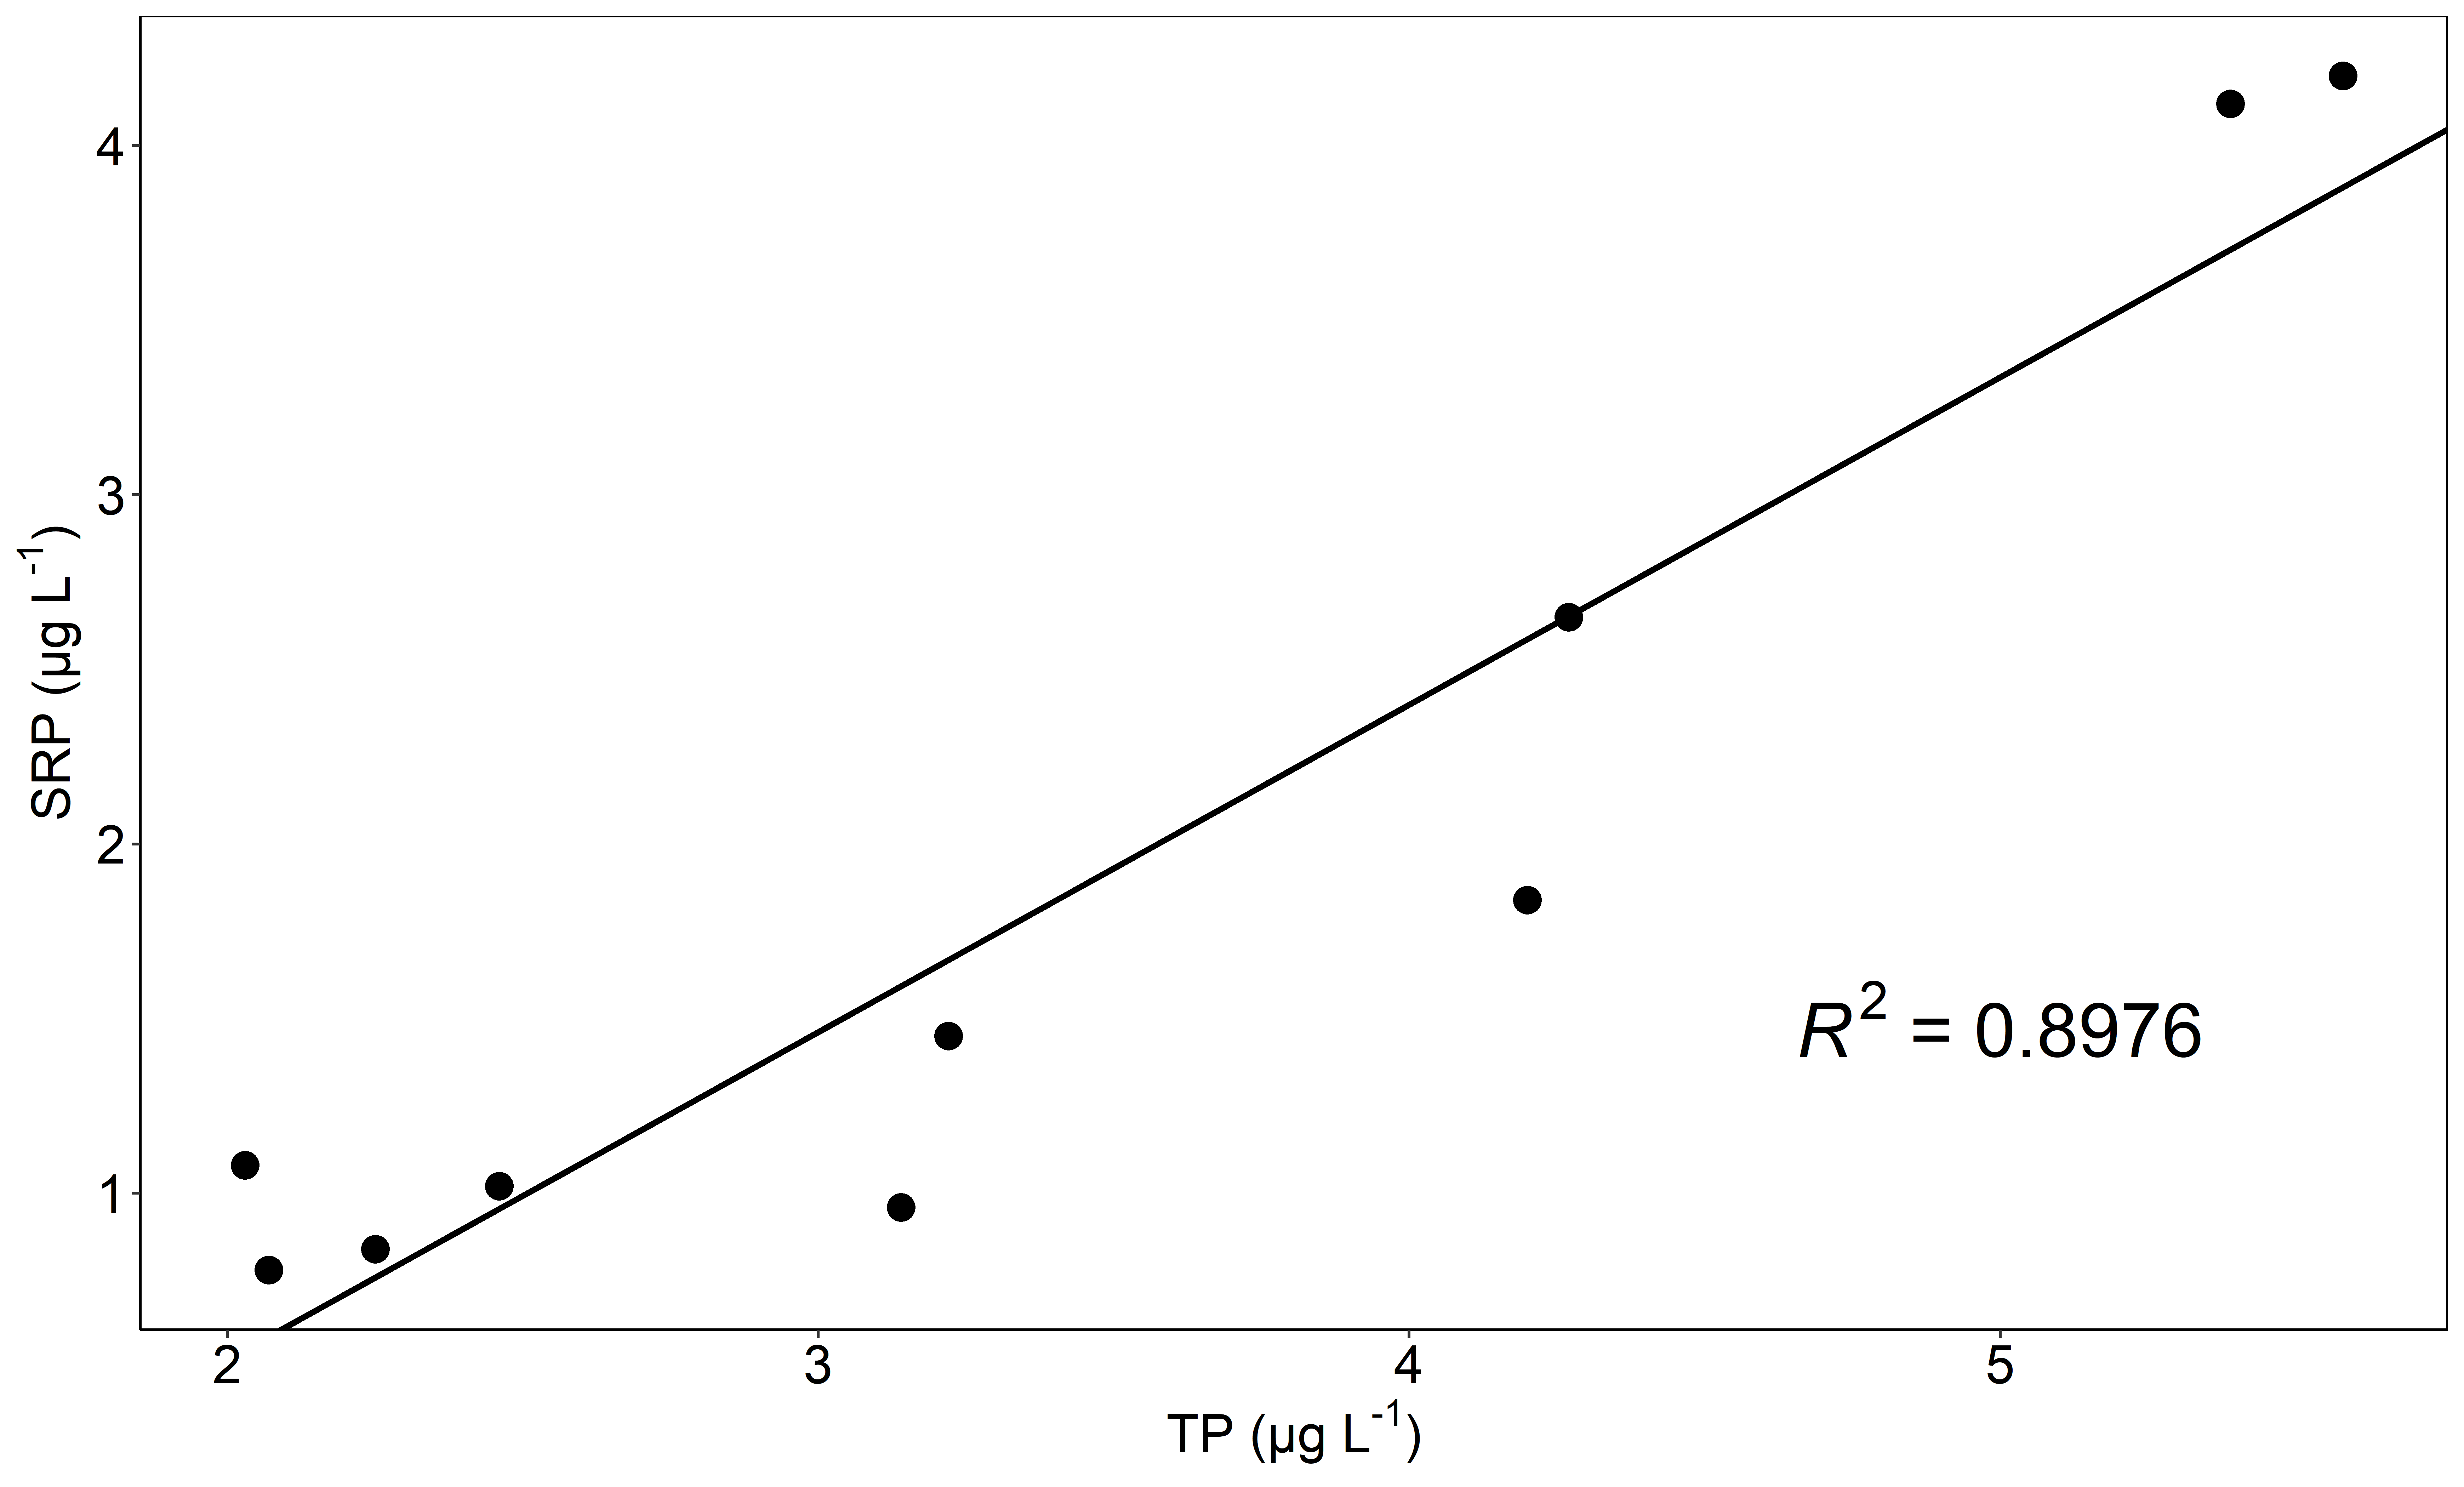
Similarly, DIN concentrations were greater than 200 µg l−1 in early spring and decreased fourfold during summer (52.7 µg l−1 in early August, Fig. 2C), before increasing again in September (83.5 µg l−1). TP concentrations were > 5.0 µg l−1 in early spring, and decreased throughout the summer to 2.0 µg l−1 (Table 1). TP was well correlated with SRP (R2 = 0.90, Fig. S1) but was on average twofold greater. By contrast to the nutrients, DOC (Table 1) was less variable and lowest in early spring (1.2 mg l−1 during AprilD1), peaked during the spring snow melt at 2.3 mg l−1 and then remained around 1.6 mg l−1 throughout the summer.

A, Averaged and log transformed response ratio for Chl-a accumulation of inorganic surfaces for N (RRN, dark blue), P (RRP, light brown) and NP (RRNP, dark brown) per deployment. The dashed line represents the threshold of log(1) = 0, points above indicate limitation and below inhibition or other effects. Error bars denote standard error. The x-axis denotes the dates (mid-deployment) as mentioned in Table 1. B, Results from partial least square regression (PLSR) using RRNP (Chl-a RRNP). Plotted are correlations between predictors (black) and the response variable (Chl-a RRNP, red) and the model scores of each deployment (as the average of deployment days per month). Model score on the two components is normalized to fit the − 1 to 1 axes. If VIP score of predictor (black) was > 1 on component 1 and or 2, we added those numbers in superscript
Seasonal autotrophic biofilm responses
Both Chl-a and GPP were lowest in March and increased throughout the study, with a different magnitude of slope for each treatment (Fig. S2 + S3). Chl-a accumulation ranged from 0.09 (P, March) to 7.52 µg cm−2 (NP, AugD2) while GPP ranged from 2.1 to 10.3 µg O2 cm−2 h−1 (Fig. S2). Chl-a was not nutrient limited during the first five deployments (March-June1, P > 0.005), even though elevated N treatment during May could indicate a treatment effect (one-way ANOVA with Bonferroni correction, α = 0.005, Fig. 2A). From July to early September, we found true NP co-limitation (no effect of N or P treatment alone, Fig. 2A) and in the last deployment, the system shifted to primary N- and secondary P-limitation (one-way ANOVA with Bonferroni correction, P = 0.006). In contrast to Chl-a, N- and P-co-limitation occurred already in June for GPP. Similar to Chl-a, GPP show a shift to primary N- and secondary P-limitation, in the last deployment.
Overall Chl-a and GPP were highly correlated (R2 > 0.75–0.91, Fig. S4) and they show similar patterns in controls and responses to nutrient additions in the seasonal study. Therefore only Chl-a was used as a response variable when assessing how autotrophic nutrient limitation interacted with water chemistry, light and temperature seasonally (with PLSR). We chose to analyzed the response ratios from the NP treatment (RRNP) because it was the most prevalent state of nutrient limitation for this site which is also reflected in that the model had a very high level of explained variance (90.7% in two components, 83.5% on the first component) (Carrascal et al., 2009). Temperature increased treatment responses for summer to autumn deployments (VIP 1.15, correlation scores 0.94, Fig. 2B) while high nutrient concentrations decreased treatment responses in spring (VIP DIN: 1.29, TP: 1.21, correlation score DIN: − 0.88 and TP: − 0.86, Fig. 2B). Low levels of light during the first two deployments (> 2.03 mol m−2 d−1) when temperature was very low and nutrients high, had a negative effect on treatment response and were likely not a direct effect and is therefore hard to interpret.
Seasonal heterotrophic biofilm response
Community respiration rates (CR) on organic surfaces did not show the same clear seasonality as autotrophic biofilm responses (Fig. S5), but had overall higher treatment responses (Fig. 3A). Controls had a relatively stable CR at around 3 µg O2 cm−2 h−1 throughout the study period and the stream was primarily C limited from April to June (5.5 µg O2 cm−2 h−1, Fig. S5) and showed true co-limitation of CNP at an average respiration rate of 14.3 µg O2 cm−2 h−1 from July until the end of September (one-way ANOVA with Bonferroni correction, α = 0.005, Fig. 3A).

A, Averaged and log transformed response ratio for community respiration organic surfaces for N (RRN, dark blue), P (RRP, light brown), NP (RRNP, dark brown), C (RRC, light green) and CNP (RRCNP, dark green) per deployment. The dashed line represents the threshold of log(1) = 0, points above indicate limitation and below inhibition or other effects. Error bars denote standard error with confidence interval (ci = 0.95). The x-axis denotes the dates (mid-deployment) as mentioned in Table 1. Data for AprilD1 is missing because we changed the growing surface from cellulose sponge to birch veneer, but yielded incomparable results and hence decided to swap back to cellulose sponge. B, Results from partial least square regression (PLSR) using RRCNP of community respiration (CR RRCNP). Plotted are correlations between predictors (black) and the response variable (CR RRCNP, red) against the model scores of each deployment (as the average of deployment days per month). Model score on the two components is normalized to fit the − 1 to 1 axes. If VIP score of predictor (black) was > 1 on component 1 and or 2, we added those numbers in superscript
Interactions between CR resource limitation (RRCNP) and seasonal environmental variables (water chemistry, light, temperature and depth) were assessed using PLSR. Resource limitation of CR was mainly controlled by DIN, DOC and depth where high DIN concentrations decreased resource limitation (VIP 1.13, correlation score − 0.83, Fig. 3B) and higher DOC (although always relatively low, VIP 1.07, correlation score 0.63) and depth increased resource limitation (VIP 1.29, correlation score 0.83). Temperature further separated autumn deployments from spring deployments but was not an important variable for the model (VIP for component 1 and 2 = 0.77).
Spatial survey
Water chemistry, temperature and light
While the seasonal study integrated changes of chemistry and physical parameters over a season, the spatial survey assessed differences across streams in this network. Headwater tundra locations and the three larger birch forest streams (M2, M3 and M19, Fig. 4), were warmer compared to birch forest streams (average 12.6 °C vs. 6.9 °C). Incoming light was high in all sites across the catchment (> 7.2 µmol m−2 day−1) and likely not a primary limiting factor for Chl-a. DIN ranged 14-fold across locations, from 6.0 (M10A) to 86.8 (M16A) µg l−1, and tended to be higher in the birch forest streams (average DIN) compared to mixed forest streams (average DIN), and tundra streams (average = 65.7 vs 31.0 µg l−1, respectively). The median SRP was 0.8 µg l−1 and it did not show systematic differences across streams draining different vegetation types. Site M6C was an outlier with an SRP concentration of 13.2 µg l−1 (Fig. 4). DOC concentrations were similar across the catchment and ranged from 1.1 mg l−1 (M18B) to 2.4 (M16B) mg l−1, with the highest concentration in a site that drains a small mire.
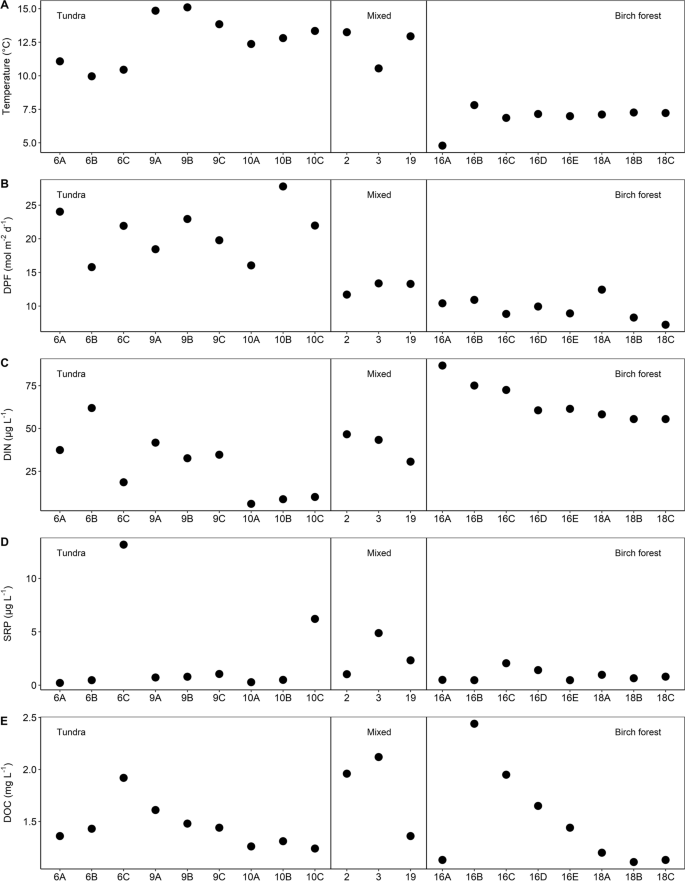
Mean stream water temperature (A), daily photon flux (B) and water chemistry (C: DIN; D: SRP; E: DOC; F: TP) for each site, separated by landscape feature (solid lines)
Autotrophic biofilm responses
Chl-a accumulation ranged up to 65-fold across locations and treatments, from 0.109 (A, M10C) to 7.321 (NP, M2) µg cm−2 (Fig. S6), spanning a similar range as could be seen in the seasonal survey (see 3.1.2). Notably, the nutrient limitation status in this catchment ranged from primary N limitation (with no effect of P alone) in one of the tundra streams, to primary P limitation in some of the headwater birch forest streams, while the majority of streams showed true co-limitation of NP (One-way ANOVA with TukeyHSD, Fig. 5A).

A, Averaged (per site) and log transformed response ratio for spatial Chl-a accumulation of inorganic surfaces for N (RRN, dark blue), P (RRP, light brown) and NP (RRNP, dark brown) per deployment.). The dashed line represents the threshold of log(1) = 0, points above indicate limitation and below inhibition or other effects. Error bars denote standard error with confidence interval (ci = 0.95). The x-axis denotes the dates (mid-deployment) as mentioned in Table 1. B, Results from partial least square regression (PLSR) using RRNP (Chl-a RRNP). Plotted are correlations between predictors (black) and the response variable (Chl-a RRNP, red) against the model scores of each site (8 birch forest = green, 3 mixed = blue and 9 tundra = yellow). Model score on the two components is normalized to fit the − 1 to 1 axes. If VIP score of predictor (black) was > 1 on component 1 and or 2, we added those numbers in superscript
To resolve the physical and chemical factors that may underlie the spatial variation in primary N vs primary P limitation we used PLSR. Overall, this analysis suggested that background DIN concentration was the most important variable driving the response ratios to N + P. Specifically, Chl-a RRNP decreased across sites with greater DIN concentration (VIP 1.32, correlation score − 0.91; Fig. 5B). This pattern was strengthened by responses to single N addition being highest at sites with low DIN concentration (Sites 10A–C, Fig. 5A). Light and temperature added additional explanatory power to this model, where both light and temperature increased RRNP (light VIP: 1.4, temp VIP:1.1, correlation score light and temp: 0.9).
4 Discussion
4.1 Seasonal survey
4.1.1 Autotrophic biofilm responses
One major objective was to evaluate how physical and chemical properties, including water chemistry, light, and temperature shape stream biofilm growth at seasonal scales in the Arctic. Our results show that nearly all deployments, except those under ice, had some degree of nutrient limitation, with N + NP co-limitation being the most common. Yet, the magnitude in response to single N and P additions varied over the season. When exploring the drivers among deployment times, our results confirm that shifts in DIN concentrations have important effects on biofilm growth and limitation status, during the full open water season when light and temperature levels were elevated across the drainage system (Myrstener et al., 2018). However, variation in SRP concentration was equally important at this site. The seasonal changes in N versus P responses in this stream reflect small fluctuations in concentrations that influenced rates of biological processes at time scales much smaller than previously reported for NDS studies. Indeed, our results highlight how week-to-week changes in the availability of resources can shift biofilms from N to P limitation.
While experimental nutrient addition frequently elevated rates of biofilm response, the temporal scope of this study also captured time periods where physical factors overwhelmed resource supply as drivers of biological activity. For example, the first three deployments were installed during cold and dark conditions which constrained autotrophic processes, despite high concentrations of both N and P. Certainly, the annual light regime is extreme in the Arctic, and serves as first order control over seasonal changes in aquatic primary production (Huryn et al., 2014; Myrstener et al., 2021a). Further, the seasonal shifts from extreme light to extreme dark are out of phase with temporal patterns of nutrient concentrations, such that the co-occurrence of high light/high resource availability is restricted to relatively small windows of time during spring and autumn (Shogren et al., 2020; Myrstener et al., 2021a). Such conditions were captured during the fourth deployment (May) when incident light was increasing rapidly, yet nutrient concentrations were still relatively high (Table 1). During this period, we observed no significant effects of nutrient addition for GPP or Chl-a, but rates and biomass on control disks peaked. Altogether, our results suggest that autotrophic processes in these streams shift rapidly from light to nutrient limitation around spring melt (Myrstener et al., 2021b).
In addition to light and nutrients, our results highlighted the role of temperature as a secondary driver of autotrophic activity, in that it increased the responses to nutrient additions for both Chl-a and GPP, as has been described elsewhere (e.g., Friberg et al., 2009; Myrstener et al., 2018). This result is also consistent with Hood et al. (2018), who used a whole-stream warming experiment to show that a 3.3 °C temperature increase resulted in higher biomass and net primary production (NPP), but which required a simultaneous upregulation of internal N turnover and supply. Overall, these results highlight the potential for Arctic aquatic ecosystems to respond to climate change if both temperature and nutrient supply increase, but also that temperature alone did not affect the identity of N vs P limitation across seasons.
Results from the seasonal analysis did not support clear results for the hypothesis of temporal P-limitation of autotrophs, as suggested for high alpine lakes in this region (Bergström et al., 2013). The most probable reason for this is that the trends in N and P did not follow the opposing seasonal patterns that have been described for other northern Swedish rivers, where P concentrations increase relative to N throughout the summer (Bergström et al., 2013). Instead, both nutrients were relatively elevated in the spring and declined throughout the growing season. Yet, even though true P limitation was not observed, there was variation in the response to single P additions over time, connected to small changes in P availability (PLS results not shown). Increasing biofilm activity from P fertilization of Arctic autotrophic biofilms have previously been found in the Kuparuk River, Alaska (Lock et al., 1990; Kendrick & Huryn, 2015) and is possibly as common as N limitation across Arctic landscapes globally (Schade et al., 2016; Myrstener et al., 2018; Pastor et al., 2020). Here we suggest that this variation likely comes from interactions between N and P concentrations that are not fixed either to regions or certain times of the year but rather that Arctic streams often reside close to co-limitation and can therefore shift from N to P limitation even within the same stream (Docherty et al., 2018). This means Arctic streams might be less sensitive to increases in a single nutrient, as the increase in one quickly leads to limitation by the other.
Heterotrophic biofilm responses
Similar to autotrophic biofilms, seasonal heterotrophic productivity did not follow hypothesized patterns in nutrient limitation. Further, heterotrophs did not show strong primary limitation of any resource but were mainly co-limited by CNP. C limitation of heterotrophs was however pronounced under ice, similar to that observed in boreal streams (Burrows et al., 2016). Seasonality in heterotrophic resource limitation was clearly controlled by the combination of DIN, TP and DOC concentrations, indicating that supply of all resources was insufficient relative to heterotrophic growth potential. This observation generally supports findings for heterotrophic biofilm enzyme activity in high Arctic streams, which were mainly controlled by DOC and DIN availability (Pastor et al., 2019), and lakes (P and DOM, Burpee et al., 2016). Noticeably, water temperature during deployments was not an important variable even in controlling responses to C + N + P additions. Similarly, CR on control surfaces was highest during winter, positively related to high DIN and P, once again supporting the notion that resource availability displayed a stronger control on productivity patterns compared to changes in temperature (Myrstener et al., 2018).
Spatial patterns in nutrient limitation
The spatial survey confirmed the hypothesis that the identity of the primary limiting nutrient shifted between N and P across the catchment and was driven by DIN concentrations for autotrophs. Even though light and temperature differed across locations (Fig. 4A + B), stream DIN was mainly responsible for these patterns of algal growth and nutrient responses, as has been found on Greenland (Pastor et al., 2020). Small-scale heterogeneity in catchment structure is best illustrated by how the different nutrient assays responded at particular tundra sites (e.g. Figure 1 and 5A, M10A-M10C). For example, low DIN concentrations at M10 led to a higher response in N-treatments, whereas several of the birch forest sites were characterized by greater P-responses, due to high DIN concentration. These results support the inference that spatial autotrophic biomass accrual and limitation is controlled by background nutrient levels and that changes in DIN concentration from ~ 20 µg l−1 to 50 µg l−1 can shift the relative importance of the nutrient N to P and in some cases even from N to P limitation. Though we found mainly NP co-limitation throughout the catchment, in line with global nutrient limitation surveys (Elser et al., 2007), we also show primary P limitation in a system where we expected primary N limitation (Myrstener et al., 2018).
The shifts from N to P limitation status in this catchment reflect the importance of small-scale difference in catchment properties that can influence stream chemistry. This may be related to vegetation type and density, height of the riparian zone, channel morphology, and hydrology (Björk et al., 2007; Weih, 1998). Overall, this result reinforces the importance of considering the heterogeneity of the Arctic landscape when assessing stream ecosystem properties (Docherty et al., 2018; Huryn et al., 1995). Even though similar landscape features shape physical and chemical stream variables that allow drawing a broader conclusion about processes in lotic systems in the Arctic, uniqueness of site characteristics is key to assess the functionality of in-stream environments (Pastor et al., 2019). This is reflected in how birch forest sites show similarities in temperature and light, but differences in water chemistry (Fig. 5C: DIN; Fig. 5E: DOC), possibly mediated by a mire that drains into those streams (M16B-M16E). With increasing distance from the mire and branching of the stream network, DIN and DOC notably decrease due to mixing and dilution. Similarly, the tundra sites were distributed across three major sub-catchments (Fig. 1) that differ in the presence/absence of lakes and wetlands and are characterized by different morphologies, including substrate size and slope. This variation both between and within vegetation zones (i.e., tundra vs. mountain birch forest) showed even more heterogeneity than was expected and highlights how important it is to consider small-scale characteristics when drawing conclusive statements about the nutrient limitation of Arctic ecosystems.
Conclusion
The present study reveals the importance of temporal and spatial patterns of physical and chemical conditions for assessing resource limitation in Arctic stream networks. While we have greatly increased our understanding of nutrient-biofilm interactions at daily time scales (e.g., Heffernan and Cohen, 2010; Lupon et al., 2016), dramatic seasonal transitions that characterize high latitude landscapes receive less attention, in part because they are logistically challenging to study (Shogren et al., 2019). Our work integrates spatial and temporal variables over a seven-month period to capture major shifts in resource limitation, including the identity of the primary limiting nutrient within a single catchment. One clear implication of our results is that a single nutrient should not be assumed to limit aquatic productivity in these landscapes, even though the field has seemingly done so for P (Kendrik & Huryn, 2015) and N (Myrstener et al., 2018). This widespread occurrence of co-limitation opens further questions about limitation by macro-nutrients such as iron (see e.g. Levine & Whalen, 2001). We show that this issue is more complex, with widespread co-limitation, and with small-scale changes in the identity of the most important nutrient. This spatial and temporal variation is likely to lead to differential biofilm responses to climatically driven habitat changes and complicates future predictions in Arctic stream productivity.
Data availability
All data generated or analyzed during this study are available upon request to the authors.
References
Abbott, B. W., J. B. Jones, Godsey, S. E. Larouche & W. B. Bowden, 2015. Patterns and persistence of hydrologic carbon and nutrient export from collapsing upland permafrost. Biogeosciences 12(12): 3725–3740. https://doi.org/10.5194/bg-12-3725-2015.
Arctic Climate Impact Assessment (ACIA), 2004. Impacts of a warming arctic, Cambridge University Press, New York, NY:
Battin, T. J., K. Besemer, M. M. Bengtsson, A. M. Romani & A. I. Packmann, 2016. The ecology and biogeochemistry of stream biofilms. Nature Reviews Microbiology 14: 251–263. https://doi.org/10.1038/nrmicro.2016.15.
Bergström, A. K., C. Faithfull, D. Karlsson & J. Karlsson, 2013. Nitrogen deposition and warming - effects on phytoplankton nutrient limitation in subarctic lakes. Global Change Biology 19(8): 2557–2568. https://doi.org/10.1111/gcb.12234.
Björk, R. G., L. Klemedtsson, U. Molau, J. Harndorf, A. Ödman & R. Giesler, 2007. Linkages between N turnover and plant community structure in a tundra landscape. Plant Soil 294: 247–261. https://doi.org/10.1007/s11104-007-9250-4.
Burpee, B., J. E. Saros, R. M. Northington & K. S. Simon, 2016. Microbial nutrient limitation in Arctic lakes in a permafrost landscape of southwest Greenland. Biogeosciences 13: 365–374. https://doi.org/10.5194/bg-13-365-2016.
Burrows, R. M., H. Laudon, B. G. McKie & R. A. Sponseller, 2016. Seasonal resource limitation of heterotrophic biofilms in boreal streams. Limnology and Oceanography 62(1): 164–176. https://doi.org/10.1002/lno.10383.
Carrascal, L. M., I. Galván & O. Gordo, 2009. Partial least squares regression as an alternative to current regression methods used in ecology. Oikos 118(5): 681–690. https://doi.org/10.1111/j.1600-0706.2008.16881.x.
Docherty, C. L., T. Riis, D. M. Hannah, S. Rosenhøj Leth & A. M. Milner, 2018. Nutrient uptake controls and limitation dynamics in north-east Greenland streams. Polar Research. https://doi.org/10.1080/17518369.2018.1440107.
Elser, J. J., M. E. S. Bracken, E. E. Cleland, D. S. Gruner, W. S. Harpole, H. Hillebrand, J. T. Ngai, E. W. Seabloom, J. B. Shurin & J. E. Smith, 2007. Global analysis of nitrogen and phosphorus limitation of primary producers in freshwater, marine and terrestrial ecosystems. Ecology Letters 10(12): 1135–1142. https://doi.org/10.1111/j.1461-0248.2007.01113.x.
Friberg, N., J. B. Dybkjær, J. S. Olafsson, G. M. Gislason, S. E. Larsen & T. L. Lauridsen, 2009. Relationships between structure and function in streams contrasting in temperature. Freshwater Biology 54(10): 2051–2068. https://doi.org/10.1111/j.1365-2427.2009.02234.x.
Heffernan, J. B. & M. J. Cohen, 2010. Direct and indirect coupling of primary production and diel nitrate dynamics in a subtropical spring-fed river. Limnology and Oceanography 55(2): 677–688. https://doi.org/10.4319/lo.2009.55.2.0677.
Hill, W. R., S. E. Fanta & B. J. Roberts, 2009. Quantifying phosphorus and light effects in stream algae. Limnology and Oceanography 54(1): 368–380. https://doi.org/10.4319/lo.2009.54.1.0368.
Holmes, R. M., B. J. Peterson, V. V. Gordeev, A. V. Zhulidov, M. Meybeck, R. B. Lammers & C. J. Vörösmarty, 2000. Flux of nutrients from Russian rivers to the Arctic Ocean: Can we establish a baseline against which to judge future changes? Water Resour. Res. 36(8): 2309–2320. https://doi.org/10.1029/2000WR900099.
Hood, J. M., J. P. Benstead, W. F. Cross, A. D. Huryn, P. W. Johnson, G. M. Gíslason, J. R. Junker, D. Nelson, J. S. Ólafsson & T. Chau, 2018. Increased resource use efficiency amplifies positive response of aquatic primary production to experimental warming. Global Change Biology 24(3): 1069–1084. https://doi.org/10.1111/gcb.13912.
Humborg, C., E. Smedberg, S. Blomqvist, C.-M. Mörth, J. Brink, L. Rahm, Å. Danielsson & J. Sahlberg, 2004. Nutrient variations in boreal and subarctic Swedish rivers: Landscape control of land-sea fluxes. Limnology and Oceanography 49(5): 1871–1883. https://doi.org/10.4319/lo.2004.49.5.1871.
Huryn, A. D., A. C. Benke & G. M. Ward, 1995. Direct and indirect effects of geology on the distribution, biomass, and production of the freshwater snail Elimia. Journal of North American Benthological Society 14(4): 519–534. https://doi.org/10.2307/1467538.
Huryn, A. D., J. P. Benstead & S. M. Parker, 2014. Seasonal changes in light availability modify the temperature dependence of ecosystem metabolism in an arctic stream. Ecology 95(10): 2826–2839. https://doi.org/10.1890/13-1963.1.
Johnson, L. T., J. L. Tank & W. K. Dodds, 2009. The influence of land use on stream biofilm nutrient limitation across eight North American ecoregions. Canadian Journal of Fisheries and Aquatic Sciences 66(7): 1081–1094. https://doi.org/10.1139/F09-065.
Kendrick, M. R. & A. D. Huryn, 2015. Discharge, legacy effects and nutrient availability as determinants of temporal patterns in biofilm metabolism and accrual in an arctic river. Freshwater Biology 60(11): 2323–2336. https://doi.org/10.1111/fwb.12659.
Kendrick, M. R., A. D. Huryn, W. B. Bowden, L. A. Deegan, R. H. Findlay, A. E. Hershey, B. J. Peterson, J. P. Beneš & E. B. Schuett, 2018a. Linking permafrost thaw to shifting biogeochemistry and food web resources in an arctic river. Global Change Biology 24(12): 5738–5750. https://doi.org/10.1111/gcb.14448.
Kendrick, M. R., A. E. Hershey & A. D. Huryn, 2018b. Disturbance, nutrients, and antecedent flow conditions affect macroinvertebrate community structure and productivity in an Arctic river. Limnology and Oceanography 61(S1): 93–104. https://doi.org/10.1002/lno.10942.
Khosh, M. S., J. W. McClelland, A. D. Jacobson, T. A. Douglas, A. J. Barker & G. O. Lehn, 2017. Seasonality of dissolved nitrogen from spring melt to fall freezeup in Alaskan Arctic tundra and mountain streams. Journal of Geophysical Research: Biogeosciences 122(7): 1718–1737. https://doi.org/10.1002/2016JG003377.
Kling, G. W., G. W. Kipphut & M. C. Miller, 1990. Arctic lakes and streams as gas conduits to the atmosphere : Implications for tundra carbon budgets. Science 251(4991): 298–301.
Kohler, J., O. Brandt, M. Johansson & T. Callaghan, 2006. A long-term Arctic snow depth record from Abisko, northern Sweden, 1913–2004. Polar Research 25(2): 91–113. https://doi.org/10.3402/polar.v25i2.6240.
Lear, G., D. Niyogi, J. Harding, Y. Dong & G. Lewis, 2009. Biofilm bacterial community structure in streams affected by acid mine drainage. Applied and Environmental Microbiology 75(11): 3455–3460. https://doi.org/10.1128/AEM.00274-09.
Levine, M. A. & S. C. Whalen, 2001. Nutrient limitation of phytoplankton production in Alaskan Arctic foothill lakes. Hydrobiologia 455(1–3): 189–201. https://doi.org/10.1023/A:1011954221491.
Lock, M. A., T. E. Ford, M. A. J. Hullar, M. Kaufmann, J. R. Vestal, G. S. Volk & R. M. Ventullo, 1990. Phosphorous limitation in an arctic river biofilm – A whole ecosystem experiment. Water Research 24(12): 1545–1549. https://doi.org/10.1016/0043-1354(90)90089-O.
Lupon, A., E. Martí, F. Sabater & S. Bernal, 2016. Green light: gross primary production influences seasonal N export by controlling fine-scale N dynamics. Ecology 97(1): 133–144. https://doi.org/10.1890/14-2296.1.
Mao, J., A. Ribes, B. Yan, X. Shi, P. E. Thornton, R. Séférian, P. Ciais, R. B. Myneni, H. Douville, S. Piao, et al., 2016. Human-induced greening of the northern extratropical land surface. Nature Climate Change 6: 959–963. https://doi.org/10.1038/nclimate3056.
Mehmood, T., K. H. Liland, L. Snipen & S. Sæbø, 2012. A review of variable selection methods in partial least squares regression. Chemometrics and Intelligent Laboratory System 118: 62–69. https://doi.org/10.1016/j.chemolab.2012.07.010.
Myrstener, M., G. Rocher-Ros, R. M. Burrows, A.-K. Bergström, R. Giesler & R. A. Sponseller, 2018. Persistent nitrogen limitation of stream biofilm communities along climate gradients in the Arctic. Global Change Biology 24(8): 3680–3691. https://doi.org/10.1111/gcb.14117.
Myrstener, M., L. Gómez-Gener, G. Rocher-Ros, R. Giesler & R. A. Sponseller, 2021a. Nutrients influence seasonal metabolic patterns and total productivity of Arctic streams. Limnology and Oceanography 66(S1): 182–196. https://doi.org/10.1002/lno.11614.
Myrstener, M., S. A. Thomas, R. Giesler & R. A. Sponseller, 2021b. Nitrogen supply and physical disturbance shapes Arctic stream nitrogen uptake through effects on metabolic activity. Freshwater Biology 66(8): 1502–1514. https://doi.org/10.1111/fwb.13734.
Pastor, A., A. Freixa, L. J. Skovsholt, N. Wu, A. M. Romaní & T. Riis, 2019. Microbial organic atter utilization in high-Arctic streams: Key enzymatic controls. Microbial Ecology. 78(3): 539–554. https://doi.org/10.1007/s00248-019-01330-w.
Pastor, A., N. Wu, L. J. Skovsholt & T. Riis, 2020. Biofilm browth in two streams draining mountainous permafrost catchments in NE Greenland. Journal of Geophysical Research. https://doi.org/10.1029/2019JG005557.
Peterson, B. J., J. E. Hobbie, A. E. Hershey, M. A. Lock, T. E. Ford, J. R. Vestal, V. L. McKinley, M. A. J. Hullar, M. C. Miller, R. M. Ventullo & G. S. Volk, 1985. Transformation of a tundra river from heterotrophy to autotrophy by addition of phosphorus. Science 229(4720): 1383–1386. https://doi.org/10.1126/science.229.4720.1383.
Rocher-Ros, G., R. A. Sponseller, W. Lidberg, C.-M. Mörth & R. Giesler, 2019. Landscape process domains drive patterns of CO2 evasion from river networks. Limnology and Oceanography 4(4): 87–95. https://doi.org/10.1002/lol2.10108.
Schade, J. D., E. C. Seybold, T. Drake, S. Spawn, W. V. Sobczak, K. E. Frey, R. M. Holmes & N. Zimov, 2016. Variation in summer nitrogen and phosphorus uptake among Siberian headwater streams. Polar Research. https://doi.org/10.3402/polar.v35.24571.
Shogren, A. J., J. P. Zarnetske, B. W. Abbott, F. Iannucci, R. J. Frei, N. A. Griffin & W. B. Bowden, 2019. Revealing biogeochemical signatures of Arctic landscapes with river chemistry. Scientific Reports 9(12894): 1–11. https://doi.org/10.1038/s41598-019-49296-6.
Shogren, A. J., J. P. Zarnetske, B. W. Abbott, F. Iannucci & W. B. Bowden, 2020. We cannot shrug off the shoulder seasons: addressing knowledge and data gaps in an Arctic headwater. Environmental Research Letters. https://doi.org/10.1088/1748-9326/ab9d3c.
Steinman, A. D., G. A. Lamberti, P. R. Leavitt & D. G. Uzarski, 2017. Biomass and pigments of benthic algae. In Hauer, F. R. & G. A. Lamberti (eds), Methods in stream ecology Elsevier, Oxford, UK: 223–241.
Tanaka, T., K. Kawasaki, S. Daimon, W. Kitagawa, K. Yamamoto, H. Tamaki, M. Tanaka, C. H. Nakatsu & Y. Kamagata, 2014. A hidden pitfall in the preparation of agar media undermines microorganism cultivability. Applied and Environmental Microbiology 80(24): 7659–7666. https://doi.org/10.1128/AEM.02741-14.
Tank, J. L., A. J. Reisinger & E. J. Rosi, 2017. Nutrient limitation and uptake. In Hauer, F. R. & G. A. Lamberti (eds), Methods in stream ecology Elsevier, Oxford: 147–171.
Thimijan, R. W. & R. D. Heins, 1983. Photometric, radiometric, and quantum light units of measure: a review. HortScience 18(6): 818–822.
Weih, M., 1998. Seasonality of nutrient availability in soils of subarctic mountain birch woodlands Swedish Lapland. Arctic and Alpine Research 30(1): 19–25. https://doi.org/10.2307/1551741.
Welter, J., J. P. Benstead, W. F. Cross, J. M. Hood, A. D. Huryn, P. W. Johnson & T. J. Williamson, 2015. Does N2 fixation amplify the temperature dependence of ecosystem metabolism? Ecology 96(3): 603–610. https://doi.org/10.1890/14-1667.1.
Xu, L., R. B. Myneni, F. S. Chapin III., T. V. Callaghan, J. E. Pinzon, C. J. Tucker, Z. Zhu, J. Bi, P. Ciais, H. Tømmervik, et al., 2013. Temperature and vegetation seasonality diminishment over northern lands. Nature Climate Change 3: 581–586. https://doi.org/10.1038/nclimate1836.
Acknowledgements
We thank BAF (Biogeochemical Analytical Facility) Umeå University for running water chemistry analysis. We thank Ada Pastor and the anonymous reviewer as well as Ryan Sponseller and Gerard Rocher-Ros for giving helpful comments on early manuscript versions. Lastly, we want to thank ANS (Abisko Research Station) for hosting and providing the research environment necessary to conduct the study.
Funding
Open access funding provided by Umea University. This study was supported by the Swedish Research Council for Environment, Agricultural Sciences, and Spatial Planning (FORMAS, 217-2012-1418) to Ryan Sponseller.
Author information
Authors and Affiliations
Corresponding author
Ethics declarations
Conflict of interest
The authors have no relevant financial or non-financial interests to disclose.
Additional information
Handling editor: Judit Padisák
Publisher's Note
Springer Nature remains neutral with regard to jurisdictional claims in published maps and institutional affiliations.
Supplementary Information
Below is the link to the electronic supplementary material.
10750_2023_5178_MOESM1_ESM.png
Supplementary file1 Bivariate plot of SRP and TP for seasonal data with regression line and corresponding R2 (PNG 90 KB)
10750_2023_5178_MOESM2_ESM.png
Supplementary file2 Average Chl-a accumulation on inorganic surfaces with four treatments (A, light blue; N, dark blue; P, light brown and NP, dark brown). Error bars denote standard error with confidence interval (ci=0.95). The x-axis shows the day in the middle of the deployment and the name based on the majority of deployment days per respective month (see Tab. 1). Average seasonal Chl-a accrual per treatment was: A=1.295 μg cm-2, N=2.014 μg cm-2, P=1.534 μg cm-2 and NP=3.011 μg cm-2 (PNG 151 KB)
10750_2023_5178_MOESM3_ESM.png
Supplementary file3 Average GPP rates on inorganic surfaces with four treatments (A, light blue; N, dark blue; P, light brown and NP, dark brown). Error bars denote standard error with confidence interval (ci=0.95). The x-axis shows the day in the middle of the deployment and the name based on the majority of deployment days per respective month (see Tab. 1). Average seasonal GPP accrual per treatment was: A=4.656 μg cm-2, N=5.521 μg cm-2, P=5.056 μg cm-2 and NP=6.642 μg cm-2 (PNG 174 KB)
10750_2023_5178_MOESM4_ESM.png
Supplementary file4 Bivariate plots of autotrophic Chl-a accumulation and GPP for each treatment (A, light blue; N, dark blue; P, light brown and NP, dark brown) with linear regression and the corresponding R2 values. (PNG 208 KB)
10750_2023_5178_MOESM5_ESM.png
Supplementary file5 Respiration rates on organic surfaces (μg O2 cm-2 h-1). Error bars denote standard error with confidence interval (ci=0.95). Data for AprilD1 are missing because we changed the growing surface from cellulose sponge to birch veneer, but yielded incomparable results and hence decided to swap back to cellulose sponge. A=3.218 μg O2 cm-2 h-1, N=4.427 μg O2 cm-2 h-1, P=4.208 μg O2 cm-2 h-1, NP=9.498 μg O2 cm-2 h-1, C=4.995 μg O2 cm-2 h-1 and CNP=11.577 μg O2 cm-2 h-1. (PNG 162 KB)
10750_2023_5178_MOESM6_ESM.png
Supplementary file6 Chl-a accumulation on inorganic surfaces (μg cm-2) separated by site and treatment treatments. Lines separate vegetation/landscape features that are mentioned in Tab. S1, Fig. 1 in 2.1. Mixed sites are also located in the birch forest. Averaged (20 sites) Chl-a accumulation: A=0.662 μg cm-2, N=1.229 μg cm-2, P=1.387 μg cm-2, NP=5.026 μg cm-2. (PNG 230 KB)
10750_2023_5178_MOESM7_ESM.png
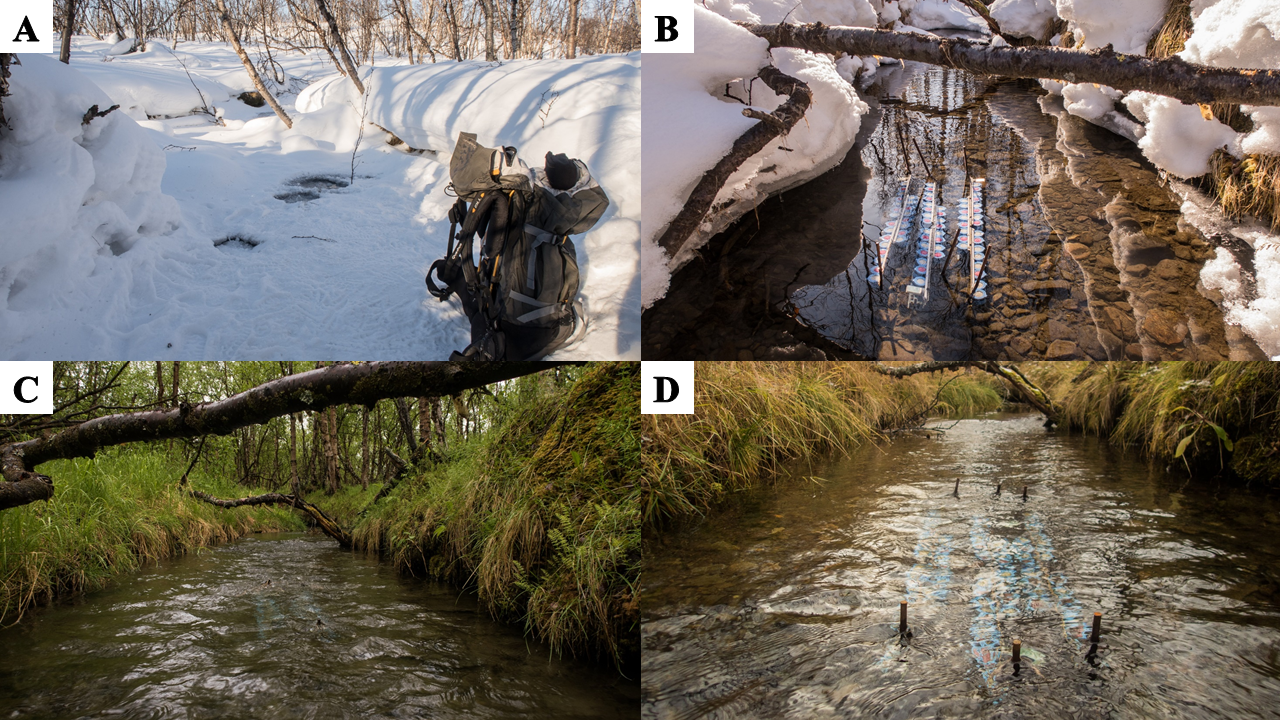
Supplementary file7 Images of seasonal changes of ice- and snow-cover as well as vegetation at site M18. A: D1, 08.03.2018; B: D3, 17.04.2018; C: D6, 20.06.2018; D: D10, 28.09.2018. (PNG 2388 KB)
10750_2023_5178_MOESM8_ESM.png
Supplementary file8 Spatial survey sites displaying the difference in riparian vegetation and morphology. A: M18C, Birch forest; B: M2, Birch forest/Main stem; C: M10A, Tundra; D: M9B, Tundra. (PNG 2375 KB)
Rights and permissions
Open Access This article is licensed under a Creative Commons Attribution 4.0 International License, which permits use, sharing, adaptation, distribution and reproduction in any medium or format, as long as you give appropriate credit to the original author(s) and the source, provide a link to the Creative Commons licence, and indicate if changes were made. The images or other third party material in this article are included in the article's Creative Commons licence, unless indicated otherwise in a credit line to the material. If material is not included in the article's Creative Commons licence and your intended use is not permitted by statutory regulation or exceeds the permitted use, you will need to obtain permission directly from the copyright holder. To view a copy of this licence, visit http://creativecommons.org/licenses/by/4.0/.
About this article

Cite this article
Hauptmann, D., Myrstener, M. Spatial and temporal patterns of stream nutrient limitation in an Arctic catchment. Hydrobiologia 850, 1699–1713 (2023). https://doi.org/10.1007/s10750-023-05178-7
Received:
Revised:
Accepted:
Published:
Issue Date:
DOI: https://doi.org/10.1007/s10750-023-05178-7