1. Introduction
Cyclic steam stimulation and steam circulation are commonly used as SAGD preheating methods. Compared to cyclic steam stimulation preheating, steam circulation preheating heats the formation relatively uniformly and has better connectivity, so steam circulation preheating is the most widely used preheating technology. Although the preheating effect of the steam cycle is better, its long preheating time not only leads to huge steam consumption but also produces a large amount of difficult-to-treat oil residue during the circulation process. These problems increase the development cost of SAGD technology to some extent and have a negative impact on the improvement of economic benefits. In order to solve the problem of the long preheating time, the BitCan Company in Canada proposed the use of SAGD rapid preheating technology in 2015 and it has been adopted rapidly both domestically and internationally. The SAGD rapid preheating technology utilizes the stress dilatation principle in rock mechanics to expand the rock of the reservoir near the wellbore before preheating, causing changes in the rock particle structure of the reservoir, forming a dilatation area with roughly the same increase in permeability and porosity. This allows the steam to develop thermal connectivity between the two wells more quickly, achieving the goal of shortening the preheating time. During the rapid preheating process of SAGD, parameters such as reservoir porosity, oil-water saturation, and temperature will change, all of which will cause changes in the thermal properties of the reservoir, thereby affecting the application of the heat transfer law in the reservoir. The thermal properties of reservoir rocks mainly include thermal conductivity, specific heat capacity, and the thermal diffusion coefficient. There are many factors that can affect the thermal properties of reservoir rocks, including their petrological characteristics, porosity, oil-water saturation, pressure, and temperature. Xu Zhenzhang from China [
1] systematically elaborated on the factors affecting the thermal properties of reservoir rocks in 1992 and analyzed the mechanisms of changes in reservoir rock thermal properties under the influence of various factors based on research data at that time. However, due to the limited testing technology and instrument conditions of early rock thermal properties testing, testing could only be conducted at room temperature and pressure, which cannot effectively simulate geological conditions. Therefore, the accuracy of rock thermal property testing results is poor [
2]. In recent years, there has been significant development in testing technology and instruments, with significantly improved accuracy of test results and the ability to effectively simulate various temperature and pressure conditions for determining rock thermal properties.
Considering the influence of temperature on the thermal properties of rocks, Sun et al. [
3] measured the thermal properties of dry sandstone under different temperature conditions and described the changes in thermal properties of the sandstone under conditions of 25 °C to 900 °C in four stages, based on the measurement results. The thermal conductivity of the rock showed an overall decreasing trend, while the specific heat capacity was proportional to temperature before 200 °C, fluctuating between 200 °C and 400 °C, and was inversely proportional to temperature after 600 °C. Abdulagaov [
4] and Emirov [
5] also reached similar research conclusions. Geng et al. [
6] investigated the effect of temperature on the thermal diffusion coefficient through experimental measurements and found that the thermal diffusion coefficient of sandstone is inversely proportional to temperature and tends to stabilize when the temperature reaches 600 °C or above. As a result of such analysis, it is believed that the decrease in thermal diffusion coefficient from 25 °C to 300 °C is mainly due to the escape of attached water, bound water, and structural water. Between 300 and 600 °C, the thermal response of minerals in sandstone increases the development of microcracks and weakens the thermal diffusion coefficient of sandstone. Unlike in previous research, Liu et al. [
7] conducted experimental and modeling studies on heat transfer in sandstone under low-temperature conditions, and conducted thermal property tests on saturated water, saturated oil, and dry sandstone under low-temperature conditions (−196.13–19.85 °C). The test results show that the thermal conductivity of dry sandstone under low-temperature conditions increases with an increase in temperature, which is different from the situation where the thermal conductivity decreases with an increase in temperature under high-temperature conditions. Analysis suggests that this is mainly related to the strong phase transition, which absorbs a large amount of latent heat.
Considering the influence of oil-water saturation on the thermal properties of rocks, Guo Yeping et al. [
8] measured the thermal conductivity of sandstone under different temperature and water-content conditions. The analysis showed that the thermal conductivity of sandstone is inversely proportional to temperature, and the thermal conductivity of sandstone in a saturated state will undergo a sudden change near 0 °C due to the influence of the water phase change. However, under a constant temperature, the thermal conductivity of sandstone is directly proportional to the water content, and the growth rate of thermal conductivity is inversely proportional to the ambient temperature. Hu Rong et al. [
9] conducted a measurement study on the thermal properties of rocks in the Chunguang Oilfield, analyzing the effects of oil-water saturation and rock density on thermal properties. The study found that the thermal conductivity and specific heat capacity of rocks are directly proportional to their water saturation and density, and are inversely proportional to their oil saturation. In addition, by regressing the results of thermal property testing, a regression relationship equation was obtained for calculating rock thermal properties through the difference in logging acoustic time. Song Xiaoqing et al. [
10] conducted a study on the thermal properties of the main rocks in Guizhou, and the results showed that the thermal conductivity of rocks under saturated water conditions increased by 2–17% compared to those under dry conditions, the thermal diffusion coefficient increased by 1–16%, and the specific heat capacity decreased by 3.08–21.79%. Analysis suggests that in addition to the petrological characteristics, the water content of rocks is the main factor affecting their thermal properties. Zhen Zuolin et al. [
11] conducted experiments to determine the thermal properties of underground transportation surrounding certain rocks in Lanzhou. The experimental results showed that the thermal conductivity of the surrounding soil samples increased linearly with the increase in water content; the volumetric specific heat capacity decreased first and then increased with the increase in water content, and the thermal diffusion coefficient increased first and then slowly decreased with the increase in water content.
In terms of the impact of changes in pore permeability on the thermal properties of rocks, Scharli et al. [
12] and Sayed et al. [
13] conducted studies on the influence of rock porosity on rock thermal properties in 1984 and 2011, respectively. The results showed that the porosity of rocks was inversely proportional to their thermal conductivity, but this result was only based on data analysis and did not provide empirical evidence. In 2020, Zhu et al. [
14] used scanning electron microscopy to obtain images of rock samples, analyzed the microstructure of different rock types, and studied the relationship between thermal conductivity and porosity using eight different thermal conductivity porosity models. The results indicate that the thermal conductivity decreases with an increase in porosity, confirming the previous research findings.
Given the impact of changes in pore permeability on the thermal properties of rocks, studies by Scharli et al. [
12] in 1984 and Sayed et al. [
13] in 2011 investigated the relationship between rock porosity and thermal properties. These findings indicated that the porosity of rocks is inversely proportional to their thermal conductivity, though these results were solely based on data analysis and were not empirical. In 2020, Zhu et al. [
14] utilized scanning electron microscopy to capture images of rock samples and examined the microstructure of various rock types. They further examined the correlation between thermal conductivity and porosity using eight distinct thermal conductivity-porosity models. Their results suggest that thermal conductivity decreases as porosity increases, corroborating the previous research findings.
In predicting the thermal properties of rocks, various models have been proposed [
15,
16,
17,
18,
19,
20,
21], all of which are obtained through regression methods based on a large amount of experimental data, and these models only consider the influence of single factors for thermal property prediction. However, there are many factors that affect the thermal properties of reservoir rocks, and the direction of their influence is also different. Therefore, many prediction models that only consider the influence of single factors have significant limitations.
Overall, there is currently a wealth of research on changes in reservoir thermal properties, and scholars have conducted quantitative or qualitative studies on the various factors that affect reservoir rock thermal properties. They have summarized the mechanisms and predictive models of reservoir thermal property changes under the influence of corresponding factors. However, the shortcomings are that currently, most research conclusions are obtained through experimental analysis under the control of single-factor variables, and there is no research on the changes in reservoir thermal properties under the joint influence of multiple factors. For the rapid preheating process of SAGD in the F reservoir studied in this study, factors affecting the thermal properties of reservoir rocks include increased local reservoir porosity and permeability after expansion, as well as changes in oil-water saturation and temperature that are caused by steam entering the formation. From previous research, it can be seen that the influence of these factors on thermal properties, especially thermal conductivity, is not consistent. Therefore, the changes in rock thermal properties under the combined action of multiple factors is a problem worthy of in-depth research, and it is also the basis for conducting subsequent research on heat transfer laws in reservoirs.
3. Results and Discussion
The experimental results for the samples’ thermal properties obtained from the LFA thermal conductivity tester are shown in
Table 4.
3.1. Intuitive Analysis and Analysis of Variance
3.1.1. Intuitive Analysis
Based on the orthogonal experimental factor level table and experimental results, a visual analysis is conducted on the test results for the thermal diffusion coefficient, thermal conductivity coefficient, and specific heat. The vacant columns (D, E, F) are used as error columns and have no practical significance. In the intuitive analysis table (
Table 5,
Table 6 and
Table 7), Ki is the sum of the experimental values of the level i of the corresponding factors in the column; ki is the average experimental value of the level i of the corresponding factors in the column, ki = Ki/number of levels; R is the range of the mean values at each level.
From the data in the table above, it can be seen that the range values RA, RB, and RC, corresponding to the amplitude of pore permeability change (A), water saturation (B), and temperature (C), are arranged in descending order: RC > RA > RB. This indicates that the change in temperature (C) has the greatest impact on the thermal diffusion coefficient of the reservoir among the three factors studied in this article and is the main factor affecting changes in the thermal diffusion coefficient. Therefore, the order of the degree of influence on the thermal diffusion coefficient of the reservoir among the three factors is: temperature (C) > amplitude of pore permeability change (A) > water saturation (B). Similarly, the range of factors that affect the thermal conductivity of reservoirs is ranked as follows: RA > RC > RB, and the amplitude of pore permeability change (A) is the main factor affecting the thermal conductivity of reservoir rocks. The order of magnitude of the impact of the three factors on the thermal conductivity of reservoir rocks is: pore permeability change amplitude (A) > temperature (C) > water saturation (B). The range order of factors affecting the specific heat of reservoir rocks is RB > RC > RA, and the water saturation (B) is the main factor affecting the specific heat of reservoir rocks. The order of the degree of influence of the three factors on the specific heat of reservoir rocks is: water saturation (B) > temperature (C) > pore permeability change amplitude (A).
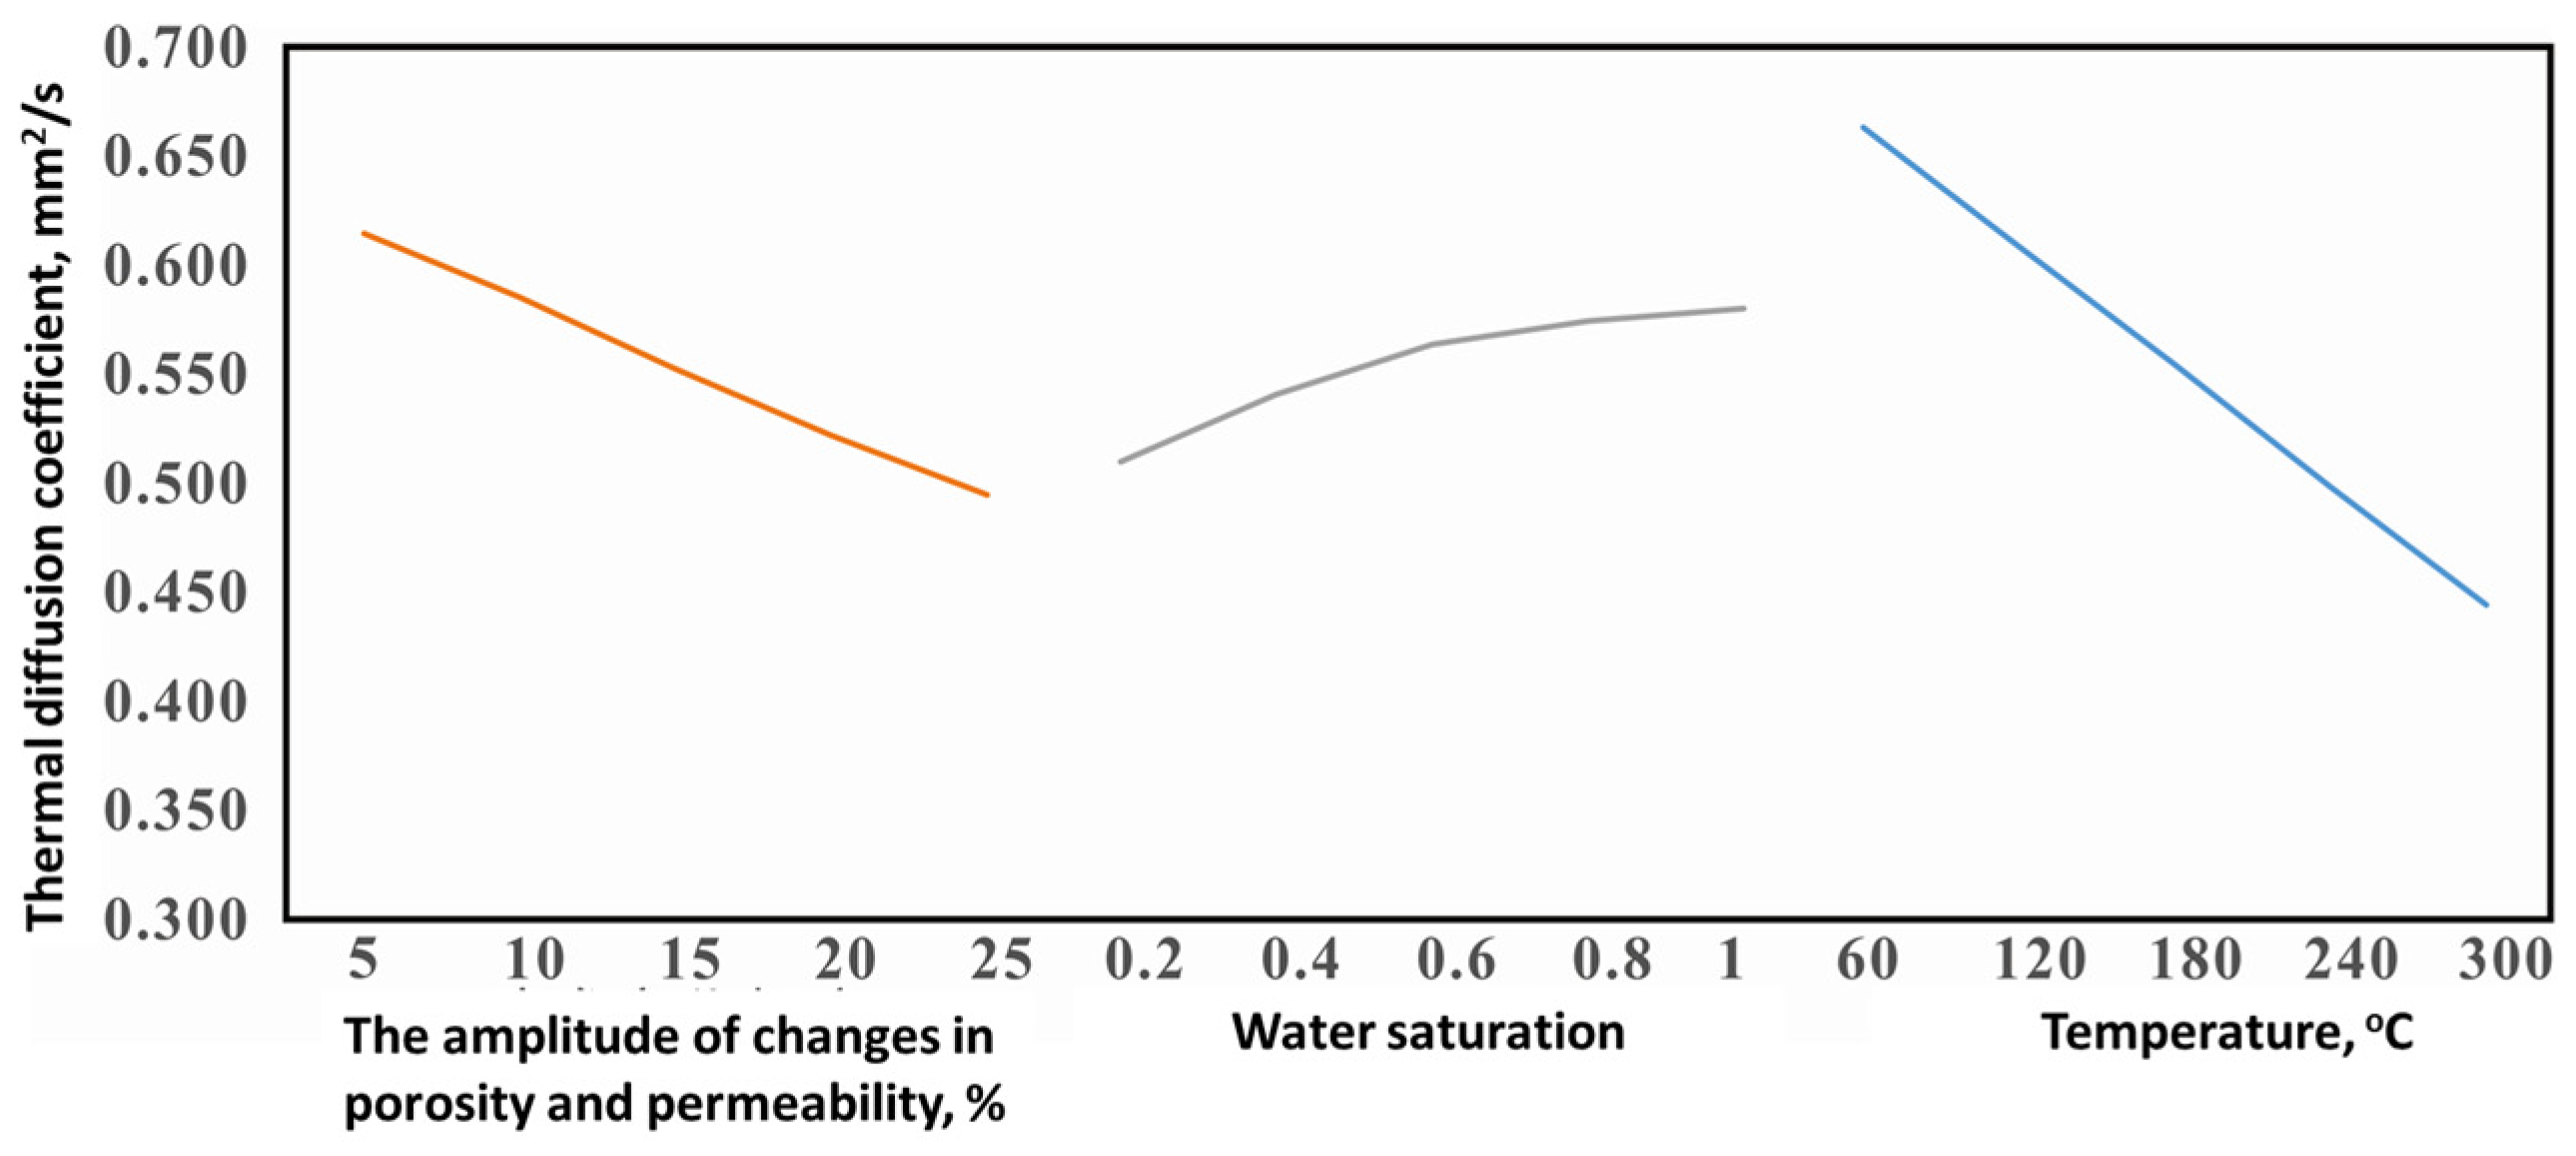
We can map the effect curves of each indicator based on the data in the table as follows.
According to
Figure 8,
Figure 9 and
Figure 10, it can be seen that within the parameter range studied in this article, the thermal diffusion coefficient is negatively correlated with the amplitude of pore permeability changes, positively correlated with water saturation, and negatively correlated with temperature. The thermal conductivity is negatively correlated with the amplitude of pore permeability changes, positively correlated with water saturation, and negatively correlated with temperature. The specific heat is negatively correlated with the amplitude of pore permeability changes, positively correlated with water saturation, and positively correlated with temperature. The variation trends of the thermal diffusion coefficient, thermal conductivity coefficient, and specific heat obtained from orthogonal experiments with respect to each factor are consistent with the research results for single-factor influences in References [
6,
7,
8], indicating that the results of this study are consistent with those in previous studies.
3.1.2. Variance Analysis
The main influencing factors of each indicator and the changing trends of the three indicators with each factor were determined through intuitive analysis in the previous section. However, intuitive analysis can only determine the magnitude of the impact of different factors on the indicators and cannot quantify the degree of impact. Therefore, an analysis of variance was chosen to determine the significance of the impact of each factor on different indicators. For this, we calculate the sum of squared deviations, degrees of freedom, and mean square of each factor that affects the thermal diffusion coefficient, thermal conductivity coefficient, and specific heat, based on the intuitive analysis table’s F-value. The F-critical value and
p-value were used for the analysis of variance, and the calculation results are shown in
Table 8,
Table 9 and
Table 10 below.
In the above analysis of variance table, the significance level is α = 0.05 (confidence level of 95%), and the calculated F-critical value at F0.05 is 3.260.
According to
Table 8, if the F-means of the pore permeability variation amplitude (A) and temperature (C) factors are greater than F
0.05, then the pore permeability variation amplitude (A) and temperature (C) have a significant impact on the thermal diffusion coefficient of reservoir rocks at a confidence level of 95%. According to
Table 9, the F-values of the pore permeability variation amplitude (A), water saturation (B), and temperature (C) factors are all greater than F
0.05. Therefore, at a confidence level of 95%, the pore permeability variation amplitude (A), water saturation (B), and temperature (C) have a significant impact on the thermal conductivity of reservoir rocks. According to
Table 10, if the F-values of water saturation (B) and temperature (C) factors are greater than F
0.05, this indicates that water saturation (B) and temperature (C) have a significant impact on the specific heat of reservoir rocks at a confidence level of 95%.
Based on the experimental results and literature research results, we analyzed the mechanism of changes in reservoir rock thermal properties under the influence of multiple factors. The amplitude of pore permeability changes has a significant impact on the thermal diffusion coefficient and thermal conductivity of reservoir rocks. This is mainly because when there are more pores in the reservoir rocks, the fluid in the pores will occupy a larger proportion of space and form a continuous phase. At this point, more resistance and dispersion effects need to be overcome when transferring energy inside the medium, thereby slowing down the speed of heat transfer. Therefore, as the porosity and permeability increase, the thermal diffusion coefficient and thermal conductivity of reservoir rocks will decrease. Water saturation has a significant impact on the thermal conductivity and specific heat of reservoir rocks, mainly because water has a higher specific heat and thermal conductivity. As the water saturation of reservoir rocks increases, their average thermal conductivity and specific heat will gradually increase. It should be noted that in practical situations, the influence of water saturation on the thermal conductivity and specific heat of reservoir rocks of different types, pore structures, and permeability may also vary. For example, when the pore connectivity of reservoir rocks is good and the morphology is regular, the fluid flow in them is better, and the thermal conductivity of reservoir rocks is also better. When the pores of reservoir rocks are small, dispersed, or fractured, this will affect the contact area between liquid water and solid rocks, thereby reducing the total specific heat of reservoir rocks. Temperature has a significant impact on the thermal diffusion coefficient, thermal conductivity, and specific heat of reservoir rocks, mainly because as the temperature increases, the internal microstructure and oil-water saturation of the rocks change. Firstly, as the temperature increases, the vibration frequency of molecules and atoms inside the rock increases, which enhances the rate of energy transfer and diffusion. In theory, the thermal conductivity and thermal diffusion coefficient should increase with the increase in temperature. However, in reality, the small pores and cracks inside the rock can form thermal barriers, hindering the transfer and diffusion of heat. Therefore, the thermal conductivity and thermal diffusion coefficient will actually decrease with the increase in temperature. In addition, as the temperature increases, atoms and molecules in the rock begin to vibrate more violently, leading to an increase in the interaction force between atoms and molecules in the reservoir rock. This interaction force creates a tendency in the rock to resist external changes; that is, the specific heat of the reservoir rock increases.
3.2. Regression Analysis
After determining the impact trend and significance of each factor on different indicators through intuitive analysis and an analysis of variance, regression analysis of experimental data is also necessary to establish regression equations to characterize the quantitative relationship between each factor and different indicators. When conducting regression analysis on experimental data, multiple regression is used to characterize the relationship between each variable and the dependent variable, with the dependent variables being Y1 (thermal diffusion coefficient), Y2 (thermal conductivity), and Y3 (specific heat), while the independent variables are XA (pore permeability change amplitude), XB (water saturation), and XC (temperature).
3.2.1. Multiple Linear Regression
A multiple linear regression method was used to perform regression analysis on the data, and the regression results analysis table is as follows.
According to
Table 11, the fitting degree of the regression equations for the thermal diffusion coefficient and thermal conductivity coefficient obtained by the multiple linear regression method is relatively low (below 0.9). Although their
p-values meet the significance test requirements, the fitting degree of the regression equation is poor and cannot meet the accuracy requirements of the prediction results. The regression equation of specific heat obtained from multiple linear regressions has a high degree of fit (greater than 0.95), and the
p-value meets the significance test requirements. This indicates that the linear regression equation has a good fit and can meet the accuracy requirements of the prediction results.
The results of multiple linear regressions indicate that there is no non-linear relationship between the three factors involved in this article and the thermal diffusion coefficient and thermal conductivity coefficient, and that linear regression cannot be used for quantitative analysis. The regression equation of specific heat obtained from multiple linear regression meets the requirements of fitting and significance, and a linear relationship can be considered to characterize the quantitative relationship between specific heat and the three factors involved in this article.
3.2.2. Multiple Nonlinear Regression
The multiple nonlinear regression method used in References [
22,
23] was used to perform multiple nonlinear regression on the experimental results. The Levenberg–Marquardt method was chosen as the estimation method, and the regression results are shown below (
Table 12).
According to
Table 13, the fitting degree of the multiple nonlinear regression equations for the three indicators is relatively high (greater than 0.99), and their
p-values are far less than 0.05. This indicates that the results of multiple nonlinear regressions are superior to those of multiple linear regression in terms of fitting degree and significance.
From the analysis results, it can be seen that the influence direction and significance of the three factors of pore permeability change amplitude, water saturation, and temperature on the thermal diffusion coefficient, thermal conductivity coefficient, and specific heat of reservoir rocks are different. Moreover, during the rapid preheating process of SAGD, reservoir expansion and the steam circulation process will cause simultaneous changes in pore permeability, oil-water saturation, and the temperature of reservoir rocks. Therefore, it is only by analyzing the changes in thermal properties of reservoir rocks and establishing corresponding multiple nonlinear regression equations to characterize them before conducting SAGD rapid preheating operations that we can more accurately predict the changes in reservoir rocks during production and construction and can further evaluate the effectiveness of SAGD rapid preheating construction more accurately.
3.3. Prediction Model for the Thermal Properties of Reservoir Rocks
The main controlling factors, significance, and regression equations affecting the thermal diffusion coefficient, thermal conductivity coefficient, and specific heat of reservoir rocks have been determined through intuitive analysis, variance analysis, and regression analysis in the previous section. Taking into account the accuracy and significance of the regression results, a multiple nonlinear regression equation was ultimately chosen to characterize the quantitative relationship between the thermal diffusion coefficient, thermal conductivity coefficient, and specific heat indicators and the changes in porosity and permeability, water saturation, and temperature.
The regression equation for thermal diffusion coefficient is as follows:
The regression equation for thermal conductivity is as follows:
The regression equation for specific heat is as follows:
α—Thermal diffusion coefficient of reservoir rocks, mm2/s
x—Increase in pore permeability, %
SW—Reservoir rock water saturation, dimensionless
Tf—Reservoir rock temperature, °C
λF—Thermal conductivity coefficient of reservoir rock, W/(m·K)
MR—specific heat of reservoir rocks, J/(g·K)
4. Conclusions
(1) The main factor affecting the thermal diffusion coefficient of reservoir rocks is the amplitude of pore permeability changes. The main factor affecting the thermal conductivity of reservoir rocks is temperature. The main factor affecting the specific heat of reservoir rocks is water saturation.
(2) The thermal properties of reservoir rocks are influenced by the amplitude of pore permeability changes, water saturation, and temperature. An increase in porosity and permeability will cause the fluid to form a continuous phase, resulting in the need to overcome more resistance and dispersion when transferring energy within the medium, thereby slowing down the rate of heat transfer. The specific heat and thermal conductivity of water are relatively high. As the water saturation of reservoir rocks increases, the average thermal conductivity and specific heat of reservoir rocks will gradually increase. An increase in temperature will increase the vibration frequency of molecules and atoms inside the rock, increasing the rate of energy transfer and diffusion. However, the small pores and cracks present in the rock will form thermal barriers, which, in turn, reduce the thermal conductivity and thermal diffusion coefficient. In addition, the specific heat of reservoir rocks increases due to the increased temperature, which enhances the interaction forces between atoms and molecules in the reservoir rocks.
(3) Taking into account the accuracy and significance of the regression results, a multiple nonlinear regression equation was ultimately chosen to characterize the quantitative relationship between reservoir thermal properties and pore permeability changes, water saturation, and temperature.


