Environmental and Experimental Botany 65 (2009) 177–182
Contents lists available at ScienceDirect
Environmental and Experimental Botany
journal homepage: www.elsevier.com/locate/envexpbot
Effects of shade treatments on the photosynthetic capacity, chlorophyll
fluorescence, and chlorophyll content of Tetrastigma hemsleyanum Diels et Gilg
Yajuan Dai a , Zonggen Shen b , Ying Liu a , Lanlan Wang a , David Hannaway c , Hongfei Lu a,∗
a
b
c
College of Chemistry and Life Science, Zhejiang Normal University, Jinhua, Zhejiang 321004, China
Department of Biological and Food Engineering, Changshu Institute of Technology, Changshu, Jiangsu 215500, China
Department of Crop and Soil Science, Oregon State University, Corvallis, OR 97331-3002, United States
a r t i c l e
i n f o
Article history:
Received 22 April 2008
Received in revised form 2 October 2008
Accepted 7 December 2008
Keywords:
Tetrastigma hemsleyanum
Light intensity
Photosynthesis
Chlorophyll fluorescence
Leaf morphology
Shade tolerance
a b s t r a c t
Tetrastigma hemsleyanum Diels et Gilg was grown under full sunlight and moderate and high levels of
shade for one month to evaluate its photosynthetic and chlorophyll fluorescence response to different
light conditions. The results showed that T. hemsleyanum attained greatest leaf size and Pn when cultivated
with 67% shade. Leaves of seedlings grown with 90% shade were the smallest. Leaf color of plants grown
under full sunlight and 50% shade was yellowish-green. The Pn value increased rapidly as PPFD increased
to 200 mol m−2 s−1 and then increased slowly to a maximum, followed by a slow decrease as PPFD was
increased to 1000 mol m−2 s−1 . Pn was highest for the 67% shade treatment and the LSP for this shade
treatment was 600 mol m−2 s−1 . Full sunlight and 50% shade treatments resulted in significant reduction
of ETR and qP and increased NPQ. Chl a, Chl b and total chlorophyll content increased and Chl a/b values
decreased with increased shading. Results showed that light intensity greater than that of 50% shade
depressed photosynthetic activity and T. hemsleyanum growth. Irradiance less than that of 75% shade
limited carbon assimilation and led to decreased plant growth. Approximately 67% shade is suggested to
be the optimum light irradiance condition for T. hemsleyanum cultivation.
© 2008 Elsevier B.V. All rights reserved.
1. Introduction
Tetrastigma hemsleyanum Diels et Gilg, belonging to the family Vitaceae, is a herbaceous perennial species native to China.
It is distributed in the eastern, central, southern and southwestern provinces of China and is best suited to shady and moist
hillsides and valleys. The entire herb and its root tubers possess
anti-inflammatory, analgesic, and antipyretic properties. It also is
used in Chinese folk medicine for dispelling phlegm and improving blood circulation. It is used for the treatment of high fever,
infantile febrile convulsion, pneumonia, asthma, hepatitis, rheumatism, menstrual disorders, sore throat, and scrofula (Liu et al.,
2002). In addition, it recently has been reported to work well
in improving the immune system and for anti-cancer properties
(Feng et al., 2006; Xu et al., 2006; Ding et al., 2005). Thus, in
recent years, it has become an important species in China for its
Abbreviations: Pn, net photosynthetic rate; PPFD, photosynthetic photon flux
density; Yield, effective quantum yield of photochemical energy conversion; ETR,
relative rate of electron transport through PSII; qP, photochemical quenching; NPQ,
nonphotochemical quenching; E, transpiration rate; WUE, water use efficiency; LSP,
light saturation point; Chl, chlorophyll; Chl a, chlorophyll a; Chl b, chlorophyll b.
∗ Corresponding author. Fax: +86 579 82282531.
E-mail addresses: luhongfei0164@sina.com, luhongfei63@yahoo.com.cn (H. Lu).
0098-8472/$ – see front matter © 2008 Elsevier B.V. All rights reserved.
doi:10.1016/j.envexpbot.2008.12.008
medicinal properties and economic value. However, due to human
overexploitation coupled with its specific environmental growth
requirements for cultivation, T. hemsleyanum has become an endangered species.
Climate, soil nutrients, and water have long been understood
to be primary factors influencing agricultural productivity (Boyer,
1982; Fischer and Turner, 1978; Novoa and Loomis, 1981). It is relatively easy to control water and nutrient supplies through irrigation
and fertilization. In contrast, light intensity (one of the most important plant growth requirements) is more difficult to control (Wang
et al., 2007). Through the process of photosynthesis light energy
is used to produce ATP and NADPH in the light reaction and subsequently, in the light-independent reaction, carbon is fixed into
carbohydrates and oxygen is produced. Under high irradiance, however, the photosynthetic apparatus absorbs excessive light energy,
resulting in the inactivation or impairment of the chlorophyllcontaining reaction centers of the chloroplasts (Bertaminia et al.,
2006). As a consequence, photosynthetic activity is depressed by
photoinhibition (Osmond, 1994). In contrast, under low irradiance,
insufficient ATP is produced to allow for carbon fixation and carbohydrate biosynthesis. This leads to reduced plant growth. Although
T. hemsleyanum has been reported to be a shade-preferring plant
(based on its primary occurrence in the shaded understory) (Xu et
al., 2006), no studies have determined the optimum light intensity
for its growth.
�178
Y. Dai et al. / Environmental and Experimental Botany 65 (2009) 177–182
Fm′ are the fluorescence at steady-state photosynthesis and
maximum fluorescence in the light, respectively. qP was calculated as (Fm − Fm′ )/(Fm′ − F0 ). NPQ quenching was calculated as
(Fm − Fm′ )/Fm′ (Genty et al., 1989). The relative rate of electron
transport through PSII (ETR) was calculated as Yield × PPFDa × 0.5
(Krall and Edwards, 1992), where PPFDa is the absorbed light
(mol photons m−2 s−1 ) by leaf (measured using an integrating
sphere).
2.4. Chl contents
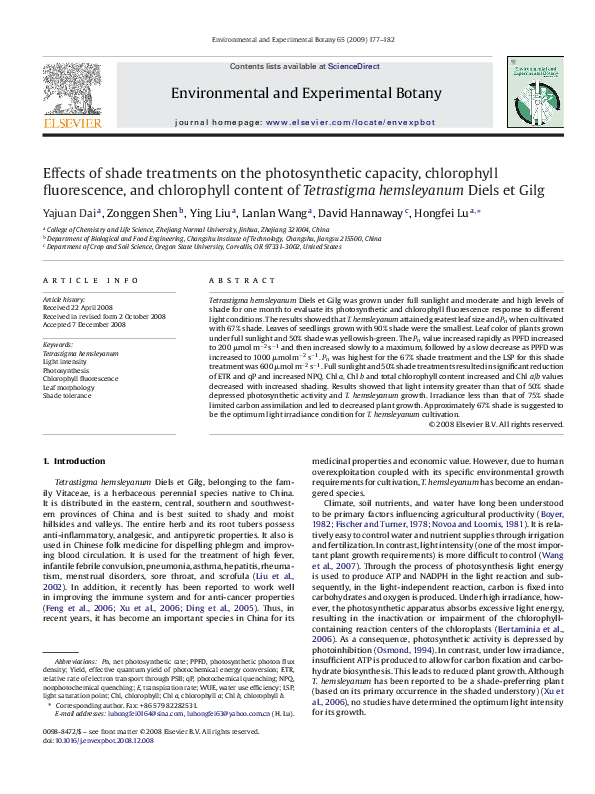
Fig. 1. Curves of diurnal variation of full sunlight during September 2007 in Jinhua.
The objective of the present study was to determine the optimum light intensity for the growth of T. hemsleyanum by quantifying
the effects of different shade treatments on chlorophyll content,
chlorophyll fluorescence, and photosynthetic capacity.
Following the final measurements described above, leaves were
collected for determination of chlorophyll content (Chl a, Chl b, Chl
a + b). Chlorophyll pigments were extracted by grinding leaves in
80% acetone in the dark at room temperature and were expressed
as mg/gfm from the equations of Porra (2002).
2.5. Data analysis
2. Materials and methods
2.1. Plants and growth conditions
All experiments were conducted in a completely randomized
block design replicated three times. Significance at P ≤ 0.05 was
assessed by ANOVA using SAS version 9.0 (SAS Institute, Cary, NC,
USA).
T. hemsleyanum plants (with root tubers) were collected from
the North Mountain area of Jinhua City and planted in the Zhejiang Normal University campus greenhouse in September 2006.
Plantlets were obtained by layering and planting in pots containing
a mixture of peat, sand, and humic soil (1:2:1). Plants were grown
under five shade treatments (0, 50, 67, 75, and 90% of natural incident irradiance) with 3 replications. Diurnal variation of September
full sunlight in Jinhua, measured with a TES-1332 Digital Lux Meter
(TES, Taiwan), is displayed in Fig. 1. Shading was accomplished by
using one or two layers of commercial black cloth shade for 30 days
beginning on September 1, 2007. Daily maximum air temperatures
were between 36 and 40 ◦ C. Irrigation was provided manually to
saturation at 18:00 h each day.
Light conditions had significant effects on T. hemsleyanum leaf
morphology. Leaves grown under 67% (Fig. 2c) and 75% (Fig. 2d)
shade were larger than leaves from other treatments. Leaves from
the 90% shade treatment (Fig. 2e) were the smallest. Leaf color of
plants grown under 67% (Fig. 2c) and 75% shade (Fig. 2d) were dark
green, while those grown under full sunlight (Fig. 2a) and 50% shade
(Fig. 2b) were yellowish-green.
2.2. Photosynthetic parameters
3.2. Photosynthesis
Photosynthetic photon flux density (PPFD) response curves
were developed using a GFS-3000 portable photosynthesis system (WALZ, Effeltrich, Germany). The parameters were measured
on fully expanded leaves from 09:00 to 17:00 h on a clear, cloudless day. The air cuvette temperature and the air CO2 concentration
were maintained at 25 ◦ C and 750 L L−1 , respectively. PPFD was
increased from 0 to 1000 mol m−2 s−1 (0, 100, 200, 300, 400,
500, 600, 700, 800, 900, 1000 mol m−2 s−1 ). Water use efficiency
(WUE) was calculated as Pn /E (mol CO2 mol−1 H2 O) (Galmés et
al., 2007). Assimilation was recorded at each of the 10 light levels
following a 10 min acclimation period. Five replications were used
for each plant.
Regardless of shading treatment, the Pn value increased rapidly
as PPFD increased to 200 mol m−2 s−1 and then increased slowly
to a maximum, followed by a slow decrease as PPFD was increased
to 1000 mol m−2 s−1 (Fig. 3a). The light compensation points
(LCP) in full sunlight and 90% shade treatment plants were a little
lower than the ones in 50%, 67%, and 75% shade treatment plants
(Fig. 3a). The light saturation points (LSP) in 0% and 50% shade
treatments were lower than for other treatments (Fig. 3a). Both
Pn and maximum Pn varied significantly (P < 0.05) with light intensity treatments. The Pn value increased with increased shading; the
highest Pn was observed in the 67% shade treatment plants and the
LSP for this shade treatment was 600 mol m−2 s−1 . Lower light
intensities reduced the Pn value. The Pn –PPFD curves for natural
light intensity and 90% shade treatments were almost coincident
beyond 200 mol m−2 s−1 .
Transpiration rate (E)–PPFD curves of the five light intensity
treatments are shown in Fig. 3b; E values varied significantly
(P < 0.05) with light intensity treatments. The E values of full sunlight and 50% shade treatment plants were lower and E–PPFD curves
appeared to be a marked single-peak curve. The E values of full sunlight treatment plants (when PPFD was >200 mol m−2 s−1 ) were
always lower than that from the 50% shade treatment plants. The E
values from the other three treatments increased as PPFD increased.
The average E in 90% shaded plants was always the highest with
increasing PPFD. The average E value of 67% shade plants was lower
than that of 75% shade plants. When PPFD was increased above
800 mol m−2 s−1 , however, the E value was higher than that of the
75% shade treatment plants.
2.3. Chl fluorescence
Chl fluorescence was measured with a MINIPAM (pulseamplitude modulation) fluorometer (WALZ, Effeltrich, Germany).
Fluorescence measurements were taken simultaneously with gas
exchange measurements since the fiber optic bundle of the fluorometer was fitted with a gas-tight seal within the gas exchange
cuvette. Leaves were light-adapted for approximately 10 min
prior to measurements of the effective quantum yield of photochemical energy conversion (Yield), photochemical (qP) and
nonphotochemical (NPQ) quenching of chl fluorescence. Measurements were obtained over a range of PAR values between
0 and 1455 mol m−2 s−1 . The relative effective quantum yield
of photochemical energy conversion at steady-state photosynthesis was calculated as Yield = (Fm′ − Fs)/Fm′ , where Fs and
3. Results
3.1. Leaf morphology
�Y. Dai et al. / Environmental and Experimental Botany 65 (2009) 177–182
179
Fig. 2. Randomly chosen T. hemsleyanum leaves of plants from the various shade treatments. (a) Full sunlight. (b) 50% shade. (c) 67% shade. (d) 75% shade. (e) 90% shade.
(Bar = 1 cm.)
Water use efficiency (WUE)–PPFD curves are shown in Fig. 3c.
The WUE–PPFD curves of full sunlight and 50% shade treatment
plants display a marked double-peak appearance. WUE in 90%
shade treatment plants was lowest. WUE in 67% shade treatment
plants was highest when PPFD was 500–600 mol m−2 s−1 and
decreased slowly as PPFD increased above 600 mol m−2 s−1 .
3.3. Chl fluorescence
Full sunlight and 50% shade treatment resulted in a significant
(P < 0.05) reduction in the apparent electron transport rate (ETR)
and photochemical quenching (qP), and an increase in nonphotochemical quenching (NPQ) (Fig. 4a–c). ETR increased rapidly as
PPFD increased for the 67, 75, and 90% shade treatment plants but
decreased as PPFD was increased above 544 mol m−2 s−1 . The ETR
value for leaves of 67% shade treatment plants was highest while the
value was smallest for plants grown under full sunlight. Quenching
coefficients plotted as a function of PAR showed a steady decline
in qP and a clear increase in NPQ with increasing irradiance. The
qP value in 67% shade treatment plants was the highest, while values for natural intensity treatment plants were lowest. The NPQ for
67% shade treatment plants was lower than for 75% shade treatment plants until PAR increased above 544 mol m−2 s−1 . The NPQ
value for natural intensity treatment plants was always the highest
with increasing irradiance.
3.4. Chl contents
Chl content was affected significantly (P < 0.05) by the different
light intensity treatments (Fig. 5). The full sunlight and 50% shade
treatments resulted in significant reductions in Chl a, Chl b and
total chlorophyll content and an increase in the Chl a:b ratio. The
highest Chl a, Chl b and total chlorophyll content and the lowest Chl
a:b ratio were observed in the 90% shade treatment plants. Chl a,
Chl b and total chlorophyll content and Chl a:b ratios in 67% shade
treatment plants were 0.79, 0.72, 0.77 and 1.08 times the values for
90% shade treatment plants, and 0.98, 0.97, 0.98 and 1.01 times the
values observed in 75% shade treatment plants.
Fig. 3. (a) Photosynthesis (Pn )-irradiance (PAR) response curves from leaves of T.
hemsleyanum grown under full sunlight (�), 50% shade (�), 67% shade (�), 75% shade
(�), 90% shade (*). (b) The transpiration rate (E)-irradiance (PAR) response curves
from leaves grown under full sunlight (�), 50% shade (�), 67% shade (�), 75% shade
(�), 90% shade (*). (c) Water use efficiency (WUE)-irradiance (PAR) response curves
from leaves grown under full sunlight (�), 50% shade (�), 67% shade (�), 75% shade
(�), 90% shade (*). Values are means ± S.E.
4. Discussion
Leaf chl content is well established as a common reference system when physiological reactions are quantified (Wittmann et al.,
2001). Decreases in chl b content have been suggested to be an
�180
Y. Dai et al. / Environmental and Experimental Botany 65 (2009) 177–182
Fig. 4. (a) Apparent electron transport rate (ETR)-irradiance (PAR) response curves
from leaves of T. hemsleyanum grown under full sunlight (�), 50% shade (�), 67%
shade (�), 75% shade (�), 90% shade (*). (b) Photochemical quenching (qP)-irradiance
(PAR) response curves from leaves grown under full sunlight (�), 50% shade (�), 67%
shade (�), 75% shade (�), 90% shade (*). (c) Nonphotochemical quenching (NPQ)irradiance (PAR) response curves from leaves grown under full sunlight (�), 50%
shade (�), 67% shade (�), 75% shade (�), 90% shade (*).Values are means ± S.E.
indication of chlorophyll destruction by excess irradiance (Jason
et al., 2004). Our results showed significant (P < 0.05) decreases in
chl content (chl a, chl b, and chl a + b) (Fig. 5) and leaf yellowing
(Fig. 2) in 0% and 50% shaded conditions suggesting that a light
intensity of greater than that of 50% shade conditions may seriously impair or totally inactivate the photosynthetic system. Plants
grown under shaded conditions are known to optimize their effectiveness of light absorption by increasing pigment density per unit
leaf area (Wittmann et al., 2001). The reductions we observed in
chl a/b ratio in leaves of 67, 75 and 90% shaded plants were due
primarily to significant (P < 0.05) increases in chl b content (Fig. 5)
and are most likely due to changes in the organization of both lightharvesting and electron transport components (Schiefthaler et al.,
1997). The marked increase in leaf chl content in the 90% shaded
condition demonstrated the plant’s ability to maximize the lightharvesting capacity in low-light growth conditions (Kura-Hotta et
al., 1987; Lei et al., 1996).
Leaf chl content also is one of the most important factors in
determining the photosynthesis rate (Mao et al., 2007) and dry matter production (Ghosh et al., 2004). Naidu et al. (1984) suggested
that reduced rates of photosynthesis may be due to reduced levels of Chl, particularly Chl a which is a more directly involved in
determining photosynthetic activity (Sestak, 1996). The lower Chl
a contents we observed in 0% and 50% shaded plants may at least
partially explain the lower photosynthetic rates found in these two
treatments plants leaves.
Leaf size (Fig. 2) was smallest when plants were grown under
90% shade. This result confirms the report by Gordon et al. (1994)
in which leaf size decreased under low-light conditions in Posidonia
sinuosa plants. This adjustment reduces the respiratory demand of
the shoot to help compensate for the greatly decreased the photosynthetic capacity of the leaves (Campbell and Miller, 2002).
The 90% shade and full sunlight treatments decreased the light
compensation points. Lower compensation irradiance in 90% shade
plants was used to judge the shade adaptation (Rena et al., 1994).
The LCPs in full sunlight plants in our experiment differed from previous reports (Lambers et al., 1998) that suggested that plants have
acclimated to a high light environment demonstrated increased
respiration and LCP. This would imply that full sunlight will be
intolerant for T. hemsleyanum growth. Our results showed that full
sunlight and 50% shade treatments reduced the light saturation
points (LSPs) in T. hemsleyanum plants (Fig. 3a). This suggests that
these treatments provided light in excess of what could be used for
photosynthesis and photoinhibition was increased (Galmés et al.,
2007). The T. hemsleyanum plants in this test had their highest Pn
when grow under the light irradiance of 67% shade treatment. The
WUE of this treatment plants declined when PPFD increased after
600 mol m−2 s−1 because the net CO2 assimilation became light
saturated, while transpiration constantly increased with increasing PPFD (Schapendonk et al., 1997). Although, the E values of 90%
shade-grown plants, and their chl content (especially Chl b content) were the highest among the five treatments plants, their Pn
and WUE values were no higher than the 0% shaded treatments.
This suggests that although this shade-tolerant plant could adapt
to growing under a light intensity of 90% shade, such low light
intensity would still decrease its growth. The lower E values of
0% shade and 50% shade plantlets suggests that they adapted to
high light irradiance and used stomatal closure to decrease water
loss. WUE of these two treatments plants increased again after 700
and 600 mol m−2 s−1 which suggests that stomatal closure at high
irradiance reduced transpiration more than photosynthesis.
Chl fluorescence continues to be a mainstay in studies of photosynthetic regulation and plant responses to the environment
due to its sensitivity, convenience, and nonintrusive characteristics
(Rascher et al., 2000; Schreiber et al., 1995). The ETR value represents the relative quantity of electrons passing through PSII during
steady-state photosynthesis (Tezara et al., 2003). Exposure to the
high irradiance conditions of the 0% and 50% shade treatments
resulted in a greatly reduced ETR value (Fig. 4a). Reductions in ETR
may be due to the loss of chlorophyll via reduction in the efficiency
of excitation capture, most likely from photoinhibition (Flowers
et al., 2007). In the 67% shade treatments, ETR was saturated
at 500–600 mol m−2 s−1 ; almost coincident with photosynthesis
light saturation values. The qP is an indication of the proportion of
PSII reaction centers that are open (Maxwell and Johnson, 2000).
High qP is advantageous for the separation of electric charge in the
reaction center, and is beneficial to electron transport and PSII yield
(Guo et al., 2006; Mao et al., 2007). In this experiment, the differences in the values of qP showed that this species has significant
differences in the activities of electron transport in PSII when plants
are grown under varied shade treatments. The separation of electric
charge in the reaction center, the ability to transport electrons, and
the quantum yield of PSII were enhanced in 67% shade treatment
�Y. Dai et al. / Environmental and Experimental Botany 65 (2009) 177–182
181
Fig. 5. Comparison of chlorophyll (Chl) content in leaves of T. hemsleyanum grown under full sunlight, 50% shade, 67% shade, 75% shade, 90% shade. Values are means ± S.E.
(Different letters mark significant differences, P < 0.05.)
plants and weakened in the 0% and 50% shaded treatments. The
NPQ can represent the energy which cannot be utilized to transport photosynthetic electrons being dissipated harmlessly as heat
energy from PSII antennae (Muller et al., 2001; Vasil’ev et al., 1998;
Veres et al., 2006). The lower NPQ in 67% and 75% shaded plants
indicates that these plants effectively reduced the irradiance heat
and efficiently utilized the energy absorbed by antenna pigments
in PSII (Guo et al., 2006). The higher NPQ in full sunlight and 50%
shade treatment plants showed the energy absorbed in the physiological range of irradiances was much higher than photochemical
utilization by which will cause inhibition of photosynthetic capacity
(Vasil’ev et al., 1998).
The low ETR and qP values, and the high NPQ value combined
with unhealthy leaf morphology (smaller leaf size and yellow leaf
color), and the low Pn of the plants grown under full sunlight
and 50% shade suggested that excess light energy damaged plants
(Melis, 1999). This is thought to be due to the formation of destructive oxidative molecules (such as singlet oxygen radicals), resulting
in damage to the photosynthetic apparatus via photoinhibition
(Krause, 1988; Aro et al., 1993). These results indicate that a light
intensity greater than that of 50% shade will be excessive irradiance
and result in damage to the photosynthetic apparatus of T. hemsleyanum. On the other hand, the low Pn and WUE value and the
smallest leaf size of plants in the 90% shade treatment plants indicated that the light intensity of 90% shade led to a decline in plant
growth.
5. Conclusions
Light irradiance levels significantly affected the growth of T.
hemsleyanum. Leaf appearance was best and Pn values were greatest when plants were grown under 67% shade. When light intensity
exceeded that of 50% shade, photosynthetic activity was depressed
likely due to photoinhibition. Light intensity reductions greater
than that of 75% shade, however, resulted in insufficient irradiation
to maintain Pn , influencing carbon balance and consequently leading to a decline in plant growth. Thus, approximately 67% shade is
concluded to be the optimum light irradiance condition for T. hemsleyanum cultivation. In view of the low light acclimation capacity
of this plant, wild T. hemsleyanum is not expected to occur in the
shaded understory where the light intensity is greater than 50% of
ambient values. Light intensity of natural habitat areas with less
than that of 25% ambient light will decrease the productivity of
T. hemsleyanum. For agricultural purposes, in order to obtain high
yields of T. hemsleyanum, we recommend trying to achieve approximately 33% ambient light with a 67% shade net.
Acknowledgements
This study was partially supported by the Emerging Talents
scheme of Zhejiang Province and Research Learning and Innovation Experiment Foundation of Zhejiang Normal University. The
authors thank Mr. L.H. Zhang, Ms. X.X. Lin, and Ms. Y.F. Chen for
their help in chl content measurements. The authors also thank Mr.
B. Jiang and Ms. L.Z. Mao for their assistance in reviewing the English
manuscript.
References
Aro, E.M., Virgin, I., Andersson, B., 1993. Photoinhibition of Photosystem II. Inactivation, protein damage and turnover. Biochim. Biophys. Acta 1143, 113–134.
Bertaminia, M., Muthuchelianb, K., Rubinigga, M., Zorera, R., Velascoa, R.,
Nedunchezhiana, N., 2006. Low-night temperature increased the photoinhibition of photosynthesis in grapevine (Vitis vinifera L. cv. Riesling) leaves. Environ.
Exp. Bot. 57 (1–2), 25–31.
Boyer, J.S., 1982. Plant productivity and environment. Science 218, 443–448.
Campbell, S.J., Miller, C.J., 2002. Shoot and abundance characteristics of the seagrass
Heterozostera tasmanica in Westernport estuary (south-eastern Australia). Aquat.
Bot. 73 (1), 33–46.
Ding, G.Q., Zheng, J.X., Wei, K.M., Pu, J.B., 2005. Toxicological effects of the extract
of Tetrastigma hemsleyanum Diels et Gilg on hepatocellular carcinoma cell line
HepG2 and primary rat hepatocytes in vitro. Zhejiang Prey Med. 17 (9), 1–5 (in
Chinese, with English abstract).
Feng, Z.Q., Ni, K.F., He, Y., Ding, Z.S., Zhu, F., Wu, L.G., Shen, M.H., 2006. Experimental
study on effect of Tetrastigma hemsleyanum Diels et Gilg flavone on inducing
apoptosis of SGC-7901 cell line in vitro. Chin. J. Clin. Pharmacol. Ther. 11 (6),
669–672 (in Chinese, with English abstract).
Fischer, R.A., Turner, N.C., 1978. Plant productivity in the arid and semiarid zones.
Annu. Rev. Plant Physiol. 29, 277–317.
Flowers, M.D., Fiscus, E.L., Burkey, K.O., Booker, F.L., Dubois, J.J.B., 2007. Photosynthesis, chlorophyll fluorescence, and yield of snap bean (Phaseolus vulgaris L.)
genotypes differing in sensitivity to ozone. Environ. Exp. Bot. 61, 190–198.
Galmés, J., Medrano, H., Flexas, J., 2007. Photosynthesis and photoinhibition in
response to drought in a pubescent (var. minor) and a glabrous (var. palaui)
variety of Digitalis minor. Environ. Exp. Bot. 60, 105–111.
Genty, B., Briantais, J.M., Baker, N.R., 1989. The relationship between quantum yield
of photosynthetic electron transport and quenching of chlorophyll fluorescence.
Biochim. Biophys. Acta 990, 87–92.
Ghosh, P.K., Ajay, Bandyopadhyay, K.K., Manna, M.C., Mandal, K.G., Misra, A.K.,
Hati, K.M., 2004. Comparative effectiveness of cattle manure, poultry manure,
phosphocompost and fertilizer-NPK on three cropping systems in vertisols of
semi-arid tropics. II. Dry matter yield, nodulation, chlorophyll content and
enzyme activity. Bioresour. Technol. 95, 85–93.
Gordon, D.M., Grey, K.A., Chase, S.C., Simpson, C.J., 1994. Changes to the structure and
productivity of a Posidonia sinuosa meadow during and after imposed shading.
Aquat. Bot. 47, 265–275.
�182
Y. Dai et al. / Environmental and Experimental Botany 65 (2009) 177–182
Guo, H.X., Liu, W.Q., Shi, Y.C., 2006. Effects of different nitrogen forms on photosynthetic rate and the chlorophyll fluorescence induction kinetics of flue-cured
tobacco. Photosynthetica 44, 140–142.
Jason, J.G., Thomas, G.R., Pharr, D.M., 2004. Photosynthesis, chlorophyll fluorescence,
and carbohydrate content of illicium taxa grown under varied irradiance. J. Am.
Soc. Hort. Sci. 129, 46–53.
Krall, J.P., Edwards, G.E., 1992. Relationship between photosystem II activity and CO2
fixation in leaves. Physiol. Plant 86, 180–187.
Krause, G.H., 1988. Photoinhibition of photosynthesis. An evolution of damaging and
protective mechanisms. Physiol. Plant 74, 566–574.
Kura-Hotta, R., Satoh, K., Kato, S., 1987. Chlorophyll concentration and its changes in
leaves of spinach raised under different light levels. Plant Cell Physiol. 87, 12–19.
Lambers, H., Chapin, F.S., Pons, T.L., 1998. Plant Physiological Ecology. Springer Verlag,
New York.
Lei, T.T., Tabuchi, R., Kitao, M., Koike, T., 1996. The functional relationship between
chlorophyll content, leaf reflectance, and light capturing efficiency of Japanese
forest species under natural shade and open light regimes. Physiol. Planta 96,
411–418.
Liu, D., Ju, J.H., Lin, G., Xu, X.D., Yang, J.S., Tu, G.Z., 2002. New C-glycosylflavones from
Tetrastigma hemsleyanum (Vitaceae). Acta Bot. Sin. 44 (2), 227–229.
Mao, L.Z., Lu, H.F., Wang, Q., Cai, M.M., 2007. Comparative photosynthesis characteristics of Calycanthus chinensis and Chimonanthus praecox. Photosynthetica 45
(4), 601–605.
Maxwell, K., Johnson, G.N., 2000. Chlorophyll fluorescence-a practical guide. J. Exp.
Bot. 51, 659–668.
Melis, A., 1999. Photosystem-II damage and repair cycle in chloroplasts: what modulates the rate of photodamage in vivo? Trends Plant Sci. 4, 130–135.
Muller, P., Li, X.P., Niyogi, K.K., 2001. Non-photochemical quenching. A response to
excess light energy. Plant Physiol. 125, 1158–1166.
Naidu, R.A., Krishnan, M., Nayudu, M.V., Gnanam, A., 1984. Studies on peanut green
mosaic virus infected peanut (Arachis hypogaea L.) leaves. II. Chlorophyll-protein
complexes and polypeptide composition of thylakoid membranes. Physiol. Plant
Pathol. 25, 191–198.
Novoa, R., Loomis, R.S., 1981. Nitrogen and plant production. Plant Soil 58, 177–204.
Osmond, C.B., 1994. What is photoinhibition? Some insights from comparisons of
shade and sun plants. In: Baker, N.R., Bowyer, J.R. (Eds.), Photoinhibition of Photosynthesis, from the Molecular Mechanisms to the Field. BIOS Scientific Publ.,
Oxford, pp. 1–24.
Porra, R.J., 2002. The chequered history of the development and use of simultaneous
equations for the accurate determination of chlorophylls a and b. Photosynth.
Res. 73, 149–156.
Rascher, U., Liebig, M., Lüttge, U., 2000. Evaluation of instant light-response
curves of chlorophyll fluorescence parameters obtained with a portable
chlorophyll fluorometer on site in the field. Plant Cell Environ. 23,
1397–1405.
Rena, A.B., Barros, R.S., Maestri, M., Söndahl, M.R., 1994. In: Schaffer, B., Andersen, P.C.
(Eds.), Handbook of Environmental Physiology of Fruit Crops, vol. II. Sub-Tropical
and Tropical Crops. CRC Press, Boca Raton, pp. 101–122.
Schapendonk, A.H.C.M., Dijkstra, P., Groenwold, J., Pot, C.S., Van de geijn, S.C., 1997.
Carbon balance and water use efficiency of frequently cut Lolium perenne L.
swards at elevated carbon dioxide. Global Change Biol. 3, 207–216.
Schiefthaler, U., Russell, A.W., Bolhàr-Nordenkampf, H.R., Critchley, C., 1997. Photoregulation and photodamage in Schefflera arboricola leaves adapted to different
light environments. Aust. J. Plant Physiol. 26, 485–494.
Schreiber, U., Bilger, W., Neubauer, C., 1995. Chlorophyll florescence as a nonintrusive indicator for rapid assessment of in vivo photosynthesis. In: Schulze, E.D.,
Caldwell, M.M. (Eds.), Ecophysiology of Photosynthesis. Springer–Verlag, Berlin,
pp. 49–70.
Sestak, Z., 1996. Liminations for finding linear relationship between chlorophyll
content and photosynthetic activity. Biol. Plant 8, 336–346.
Tezara, W., Martianez, D., Rengifo, E., Herrera, A., 2003. Photosynthetic responses of
the tropical spiny shrub Lycium nodosum (Solanaceae) to drought, soil salinity
and saline spray. Ann. Bot.-Lond. 92, 757–765.
Vasil’ev, S., Wiebe, S., Bruce, D., 1998. Non-photochemical quenching of chlorophyll
fluorescence in photosynthesis. 5-Hydroxy-1, 4-naphthoquinone in spinach thylakoids as a model for antenna based quenching mechanisms. Biochim. Biophys.
Acta 1363, 147–156.
Veres, S., Tóth, V.R., Láposi, R., Oláh, V., Lakatos, G., Mészáros, I., 2006. Carotenoid
composition and photochemical activity of four sandy grassland species. Photosynthetica 44, 255–261.
Wang, H., Wang, F.L., Wang, G., Majourhat, K., 2007. The responses of photosynthetic
capacity, chlorophyll fluorescence and chlorophyll content of nectarine (Prunus
persica var. Nectarina Maxim) to greenhouse and field grown conditions. Sci.
Hort. 112 (1), 66–72.
Wittmann, C., Aschan, G., Pfanz, H., 2001. Leaf and twig photosynthesis of young
beech (Fagus sylvatica) and aspen (Populus tremula) trees grown under different
light regime. Basic Appl. Ecol. 2, 145–154.
Xu, C.J., Ding, G.Q., Meng, J., Fu, J.Y., Zhang, R.H., Chen, Y.M., Chen, J., 2006. Study on the
anti-tumor mechanism of extract of herbal medicine Tetrastigma Hemsleyanum
Diels et Gilg. Chin. J. Health Lab. Technol. 16 (1), 14–16 (in Chinese, with English
abstract).
�
 David Hannaway