OPEN
Citation: Transl Psychiatry (2017) 7, e1066; doi:10.1038/tp.2017.35
www.nature.com/tp
ORIGINAL ARTICLE
Citalopram amplifies the influence of living conditions on
mood in depressed patients enrolled in the STAR*D study
F Chiarotti1,4, A Viglione1,4, A Giuliani2 and I Branchi1,3
Selective serotonin reuptake inhibitors (SSRIs), the most commonly prescribed antidepressant drugs, have a variable and
incomplete efficacy. In order to better understand SSRI action, we explored the hypothesis that SSRIs do not affect mood per se but
amplify the influence of the living conditions on mood. To this aim, we exploited the Sequenced Treatment Alternatives to Relieve
Depression (STAR*D) data set, selected a subpopulation of 591 patients with an overlapping clinical history and analyzed treatment
outcome according to dosage − 20 or 40 mg per day of citalopram. We found that sociodemographic characteristics affected
treatment response in the same direction in the two dose groups, but these effects reached statistical significance only in the
40 mg per day dose group. In the latter, higher improvement rate was associated with having a working employment status
(P = 0.0219), longer education (P = 0.0053), high income (P = 0.01) or a private insurance (P = 0.0031), and the higher remission rate
was associated with having a working employment status (P = 0.0326) or longer education (P = 0.0484). Moreover, the magnitude of
the effect of the sociodemographic characteristics on mood, measured as the percent of patients showing a positive outcome
when exposed to favorable living conditions, was much greater—up to 37-fold—in the 40 compared to the 20 mg per day dose
group. Overall, our results indicate that citalopram amplifies the influence of the living conditions on mood in a dose-dependent
manner. These findings provide a potential explanation for the variable efficacy of SSRIs and might lead to the development of
personalized strategies aimed at enhancing their efficacy.
Translational Psychiatry (2017) 7, e1066; doi:10.1038/tp.2017.35; published online 21 March 2017
INTRODUCTION
Antidepressant drugs are the current standard treatment for major
depressive disorder (MDD) and, among these, selective reuptake
inhibitors (SSRIs) are the most commonly prescribed. However,
their efficacy is variable and incomplete: 60–70% of depressed
patients do not experience remission and 30–40% do not show
a significant response.1 One of the main reasons for such
incomplete efficacy is the poor comprehension of their mechanisms of action. A new hypothesis, the undirected susceptibility to
change hypothesis, predicts that SSRI treatment does not drive
changes in mood per se but, by increasing brain plasticity, creates
a window of opportunity for a change in mood that is driven by
the quality of the living conditions.2 In particular, the serotonin
increase induced by SSRIs enhances brain plasticity and thus
renders the individual more susceptible to the influence of the
living conditions. The main consequence is the lack of a univocal
outcome of SSRI administration: in a favorable environment
treatment leads to a reduction of symptoms; by contrast, in a
stressful environment it may lead to a worse prognosis. As a
further consequence, SSRIs are expected to amplify the influence
of living conditions on mood in a dose-dependent manner. Such
hypothesis is supported by preclinical data3–5 showing that
fluoxetine treatment leads to an improvement of the
depression-like phenotype when administered in an enriched
condition, while it leads to a worsening when administered in a
stressful condition. In addition, SSRI treatment consequences on
selected end points, such as vulnerability to obesity, have been
1
shown to be dependent on the quality of the environment.6,7
Finally, a number of clinical studies have shown that the
environment moderates the effects of antidepressant
treatment.1,8–13 However, the approaches used so far in these
studies do not allow for assessing the effect of SSRIs on the
susceptibility to the influence of the living conditions.
The main aim of the present study was to test whether SSRI
treatment amplifies the influence of the living conditions on mood
in a dose-dependent manner. We thus exploited the data
collected in the framework of the Sequenced Treatment
Alternatives to Relieve Depression (STAR*D) study. We considered
a subpopulation of 591 patients having similar MDD severity and
overlapping treatment history, and analyzed the efficacy of
treatment between weeks 4 and 6 according to the dose
received—either 20 or 40 mg per day of citalopram. Longer or
different treatment periods or other patients’ groups could not be
considered without losing data validity because of the limitations
imposed by the STAR*D trial design. The socioeconomic
characteristics included in the analysis are proxy of the quality
of the patient's life environment and widely considered reliable
indicators of socioeconomic status.14 Our prediction was that the
40 mg per day dose, compared to the 20 mg per day dose, would
amplify the influence of sociodemographic characteristics on
patients’ mood, since it should increase plasticity to a higher
degree and thus lead to greater susceptibility to the environment.
We therefore predicted citalopram to affect susceptibility to the
living conditions in a dose-dependent manner. In addition, since
Center for Behavioral Sciences and Mental Health, Istituto Superiore di Sanità, Rome, Italy; 2Department of Environment and Health, Istituto Superiore di Sanità, Rome, Italy and
Institute of Anatomy, University of Zurich, Zurich, Switzerland. Correspondence: Dr I Branchi, Center for Behavioral Sciences and Mental Health, Istituto Superiore di Sanità, Viale
Regina Elena 299, Rome 00161, Italy.
E-mail: igor.branchi@iss.it
4
These authors contributed equally as first-author.
Received 26 November 2016; revised 4 January 2017; accepted 16 January 2017
3
�Citalopram amplifies the influence of environment
F Chiarotti et al
2
we hypothesized that the environment drives the change in MDD
induced by SSRIs, we predicted that patients living in conditions
associated to a high quality of life should show a more effective
response to treatment.
QIDS-SR16 score at enrollment, at week 4 and as difference between week
4 and enrollment) according to the dose assignment (see Results section
and Table 1). We therefore analyzed treatment efficacy between weeks 4
and 6 according to the dose received, either 20 or 40 mg per day of
citalopram.
MATERIALS AND METHODS
Study organization
Sociodemographic characteristics
This paper is based on the STAR*D (ClinicalTrials.gov, number
NCT00021528) study data. The design details of STAR*D are described
accurately elsewhere.15 In brief, STAR*D was a multisite, prospective,
randomized, multistep clinical trial conducted in the United States of
America aimed to determine which of several treatments would be most
effective for outpatients with nonpsychotic MDD.16 The study was
conducted at 18 primary care and 23 psychiatric care centers and enrolled
4041 nonpsychotic MDD patients, aged 18–75, with a baseline score ⩾ 14,
on the 17-item Hamilton Depression Rating Scale (HAM-D17).
MDD symptom severity in the STAR*D clinical trial was measured
longitudinally using the 16-item Quick Inventory of Depressive Symptomatology (QIDS). The QIDS is a briefer version of the more commonly used
30-item Inventory of Depressive Symptomatology—IDS. The QIDS is
available in the clinician and self-rated version and has been designed to
assess the severity of depressive symptoms through the evaluation of all
the criterion symptom domains designated by the American Psychiatry
Association Diagnostic and Statistical Manual of Mental Disorders—4th
edition (DSM-IV) to diagnose a major depressive episode. Each item was
scored on a scale from 0 to 3 points: 0 indicating no problem and 3
indicating severe problem. Total score ranges from 0, that is, not
depressed, to 27, that is, most depressed. For further details on the
validity, reliability, generalizability, scoring and interpretation, see http://
www.ids-qids.org/.
Treatment
At Level 1, all participants were treated with citalopram, a SSRI, for a
minimum of 8 weeks and were encouraged to complete 12 weeks to
maximize benefit. All participants started treatment with a dose of 20 mg
per day citalopram, with clinical visits at 2, 4, 6, 9 and 12 weeks. To ensure
satisfactory dosing for an appropriate period of time, treatment
was conducted using measurement-based care. This included flexible
dosing recommendations based on symptom and side effect at
each treatment visit.17 According to the Guidelines for discontinuing
participants from the randomized treatment study, patient drop out could
be due to a number of reasons including participant request and decision
by clinicians to discontinue the study is in the best interest of the
participant.
Dose adjustments were decided according to the QIDS-Clinician-rate
(QIDS-C16) score: QIDS-C16 ⩽ 5, continue current dose; QIDS-C16 = 6–8,
continue or increase current dose according to the clinician assessment;
QIDS-C16 ⩾ 9, increase current dose. In addition, if the reduction in
baseline symptom severity was found to be o 20% at week 4, the initial
dose (20 mg per day) was raised to 40 mg per day, assuming tolerable side
effects. At week 4, participants with intolerable side effects could move to
the next treatment level.17
Selection criteria
In the present study, data from level 1 of STAR*D were considered. Only
patients having similar MDD severity and overlapping treatment history
were included in the analysis. In particular, we selected patients treated
with a dose of 20 mg per day for the first 4 weeks following enrollment,
showing a QIDS-SR16 score equal to 6–10 (mild depression) on week 4 and
whose information concerning the QIDS score on week 6 was available
(Supplementary Figure S1). Longer or different treatment periods or other
patients’ groups could not be considered without losing data validity
because of the limitations imposed by the STAR*D trial design. In
particular, according to the recommendations of the clinical trial design,
patients with high QIDS score that indicates moderate, severe and very
severe depression are compulsorily assigned to a dose increase. Including
patients with all QIDS scores in the analysis would lead to bring severe
depressed and potentially non-responding patients in the high dose
group, erroneously leading to the conclusion that the high dose is less
effective. The subset of patients considered in the present study show no
meaningful clinical difference in depressive symptomatology (measured as
Translational Psychiatry (2017), 1 – 8
The efficacy of the two dosing regimens was analyzed in relation to a
number of sociodemographic characteristics considered as proxy of the
socioeconomic status and the quality of the living environment of the
patient:14 sex, race, marital status, employment status, insurance status,
education, income, experience of traumatic events and drug abuse. In
addition, we analyzed the following descriptors of the onset and
progression of the psychopathology: age at onset of first major depressive
episode (MDE), number of MDE, difference in QIDS-SR16 score between
enrollment and week 4. Education was shown as years of schooling
completed; we considered two levels of education: ocollege ( o16 years)
and ⩾ college (⩾16 years). Income was analyzed subdividing the examined
population into three monthly income classes: the low-income group was
set at ⩽ $1000, while middle and high income groups at $1000–$2500 and
4$2500, respectively. Employment status was analyzed considering only
two conditions: employed (self-employed, part-time employed and fulltime employed) and unemployed (unemployed and retired). For marital
status we considered: never married, married (married or cohabiting) and
no more married (separated, divorced and widowed). Finally, we
considered only two ethnicities, Caucasian (white) and non-Caucasian (all
other ethnicities).
Outcome measures
MDD symptom severity was measured using the QIDS-SR16. Remission was
defined as a QIDS-SR16 score ⩽ 5. In order to determine the effects of
citalopram treatment, according to sociodemographic characteristics, we
considered three variables: (i) percent of patients showing an improvement, measured as a reduction ⩾ 1 in QIDS-SR16 score between week 4
and 6; (ii) percent of patients achieving remission, measured as the
attainment of a QIDS-SR16 score ⩽ 5 at week 6; and (iii) variation in the
QIDS-SR16 score, measured between weeks 4 and 6.
Data analysis
Of the 4041 participants, a sample of 591 patients was identified according
to the selection criteria (Supplementary Figure S1). Summary statistics are
presented as percentages for discrete variables, and as means and s.d. for
continuous variables. Logistic regression models were used to assess the
association of all sociodemographic characteristics with QIDS-SR16 score
improvement and remission rate, within each dose group, and to compute
odds ratios. The Wald test was used to compute the overall significance of
the categorical sociodemographic factors presenting more than two levels.
The use of the odds ratios as a measure of risk is debatable and its
approximation to the relative risk (RR) is acceptable only when the risk of
the event (in the present study, the improvement or remission) in the
control group (in the present study, the favorable sociodemographic
condition) is very low, that is, under the so-called 'rare disease
assumption'.18 For this reason, we additionally computed the percent of
improvement or remission in the favorable (that is, associated to a high
quality of life) and in the unfavorable (that is, associated to a low quality of
life) sociodemographic condition, and the RR of unfavorable versus
favorable condition, with the corresponding 95% confidence interval.
Finally, the preventive fraction (1 − RR) was computed to estimate the
effect size and thus the magnitude of influence of the living conditions on
the outcome. As in our study the outcome measured is a beneficial one,
that is improvement or remission, values of 1 − RR40 indicate that the
unfavorable condition decreases the probability of the beneficial outcome
compared to the favorable condition, and vice versa. The variation in the
QIDS-SR16 score between weeks 4 and 6 was analyzed with analyses of
variance including sociodemographic characteristics as between-subject
factors. Separate analyses of variance were performed for each sociodemographic characteristic within the two treatment doses. Post hoc
comparisons were performed using the Tukey’s test. The variation in
percent of improvement, stationary and worsening according to sociodemographic characteristics has been analyzed independently in the two
dose groups with Χ2-test.
�Citalopram amplifies the influence of environment
F Chiarotti et al
3
Table 1.
Baseline sociodemographic characteristic of the evaluable sample by citalopram dose
Baseline characteristics
Citalopram dose
N = 591 (%)
20 mg per die; N = 357 (60.4%)
40 mg per die; N = 234 (39.6%)
Ethnicity
Non-Caucasiana
Caucasian
165 (27.9)
426 (72.1)
108 (30.3)
249 (69.7)
57 (24.4)
177 (75.6)
Sex
Female
Male
362 (61.3)
229 (38.7)
222 (62.2)
135 (37.8)
140 (59.8)
94 (40.2)
Marital status
No more married
Never married
Married
125 (25.8)
140 (28.9)
219 (45.2)
77 (26.1)
86 (29.2)
132 (44.7)
48 (25.4)
54 (28.6)
87 (46.0)
Employment status
Unemployed and retired
Employed
185 (38.2)
299 (61.8)
110 (37.3)
185 (62.7)
75 (39.7)
114 (60.3)
Educationb
oCollege
⩾ College
294 (60.7)
190 (39.3)
180 (61.0)
115 (39.0)
114 (60.3)
75 (39.7)
Incomec
Low
Middle
High
172 (29.9)
195 (33.9)
208 (36.2)
105 (30.3)
114 (32.9)
128 (36.9)
67 (29.4)
81 (35.5)
80 (35.1)
Experienced traumatic event
No
Yes
333 (56.8)
253 (43.2)
203 (57.3)
151 (42.7)
130 (56.0)
102 (44.0)
Witnessed traumatic event
No
Yes
405 (69.1)
181 (30.9)
241 (68.1)
113 (31.9)
164 (70.7)
68 (29.3)
Drug abuse
No
Yes
129 (95.6)
6 (4.4)
73 (97.3)
2 (2.7)
56 (93.3)
4 (6.7)
Insurance status
Public insurance
No insurance
Private insurance
39 (8.0)
179 (36.8)
269 (55.2)
25 (8.6)
103 (35.3)
164 (56.2)
14 (7.4)
76 (40.4)
98 (52.1)
Median (observed range)
Age (years)
Years of education
Income ($ per month)
Age at onset of first MDE
Number of MDEs
QIDS-SR16 (difference W4 − Enroll)
41.0
14.0
1 900
22.0
3.0
−6
(18–75)
(1–25)
(0–50 000)
(4–73)
(1–84)
(−19–7)
Mean (s.d.)
Mean (s.d.)
Mean (s.d.)
41.3
14.3
2794
26.3
5.6
− 6.4
41.3
14.2
2670
27.0
5.3
− 6.2
41.1
14.5
2982
25.1
6.0
− 6.6
(13.3)
(9.5)
(3620)
(14.6)
(9.1)
(3.9)
(13.6)
(3.4)
(2785)
(15.1)
(7.7)
(3.9)
(12.8)
(3.0)
(4610)
(13.8)
(10.8)
(3.9)
Abbreviations: MDE, major depressive episode; QIDS-SR16, Quick Inventory of Depressive Symptomatology-Self-Report. aAsian, American Indian or Alaskan
Native, Native Hawaiian/Other Pacific Islander or multiracial. b oCollege = ⩽ 16 years of schooling; ⩾ College = ⩾16 years of schooling. cLow = monthly gain
⩽ $1000; Middle = monthly gain $1000–$2500; High = monthly gain 4$2500.
RESULTS
Baseline characteristics
Of 591 patients who comprised the evaluable sample, 357 (60.4%)
were treated with 20 mg of citalopram per day and 234 (39.6%)
with 40 mg of citalopram per day between weeks 4 and 6.
Females comprised two-thirds of the sample and minority
representation was robust. The two dose groups did not show
any meaningful clinical difference before receiving different
citalopram doses (Supplementary Table S1). At enrollment, their
QIDS-SR16 scores were almost overlapping (20 mg per day dose
group: mean 14.14, s.d. 3.78; 40 mg per day dose group: mean
14.7, s.d. 3.79). The two groups did not differ also in QIDS-SR16
score at week 4 (20 mg per day dose group: mean 7.93, s.d. 1.39;
40 mg per day dose group: mean 8.16, s.d. 1.44). Finally, as shown
in Table 1, no difference between the 20 and 40 mg per day dose
groups was found in response to treatment as both showed an
Translational Psychiatry (2017), 1 – 8
�Citalopram amplifies the influence of environment
F Chiarotti et al
4
almost overlapping reduction of QIDS-SR score during the first
4 weeks of treatment, when all patients received the 20 mg
per day dose. Table 1 summarizes further baseline characteristics
of the two groups.
Sociodemographic characteristics and dosage associated with
improvement
According to our hypothesis, the two citalopram dosages
amplified the influence of sociodemographic characteristics on
the percent of patients showing an improvement in a dosedependent manner. In the 20 mg per day dose group, patients'
response was not significantly affected by sociodemographic
characteristics. By contrast, in the 40 mg per day dose group,
sociodemographic characteristics were associated to significantly
different outcomes. In the latter group, a higher rate of
improvement was associated with having a working employment
status, more than 16 years of education, high income and a
private insurance (Table 2). In order to appreciate the influence of
the environment in each dose group, its magnitude was measured
as the preventive fraction (1 − RR). The comparison of the
preventive fraction, indicating the percent of patients showing a
positive outcome when exposed to a favorable environment,
between the two dose groups shows that the influence of
sociodemographic characteristics on treatment outcome was
overall markedly higher in the 40 mg per day dose group. In
particular, the magnitude of the influence of the employment
status (unemployed versus employed) and education (o college
versus ⩾ college) on improvement rate was, respectively, 5- and
37-fold in the 40 compared to the 20 mg per day dose group. In
addition, the magnitude of the influence on improvement rate of
income was 6- (high versus low) and 8-fold (high versus middle)
and of insurance was 22- (no versus public) and 8-fold (private
versus public) in the 40 compared to the 20 mg per day group
(Supplementary Table S2).
Rate of remission
As for the rate of improvement, the two citalopram dosages
produced a different amplification of the influence of the sociodemographic characteristics on the percent of patients achieving
remission. In particular, in the 40 mg per day group, a significantly
higher rate of remission was found to be associated with being
employed and having longer education (Table 3). The magnitude of
the influence of the employment status (unemployed versus
employed) and education (ocollege versus ⩾ college) on remission
rate was, respectively, six- and twofold in the 40 compared to the
20 mg per day group (Supplementary Table S3).
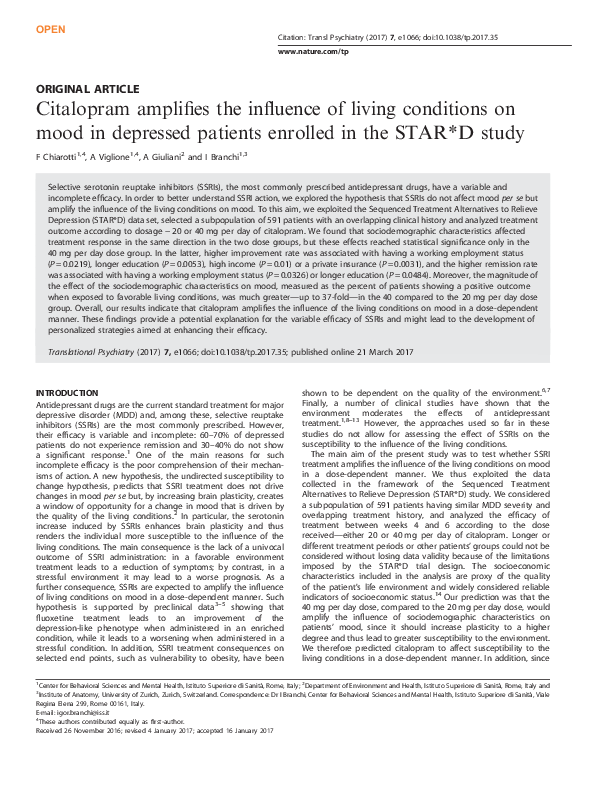
Variation in the QIDS-SR16 score
The variation in the QIDS-SR16 score produced results in line with
the previous ones, as it significantly differed according to
sociodemographic variables only in the 40 mg per day dose
group. In particular, in this group, being of Caucasian ethnicity
(F (1,232) = 5.334, P = 0.0218), having a private insurance
(F (2,185) = 4.427, P = 0.0132), a high income (F (2,225) = 3.629,
P = 0.0281) or more years of education (F (1,187) = 11.344,
P = 0.0009) was associated with a significant larger reduction of
QIDS-SR16 score (Figure 1). Post hoc analysis revealed a significant
reduction of the QIDS-SR16 comparing high versus low income
(P o 0.05) and having a private versus a public insurance
(P o 0.05).
DISCUSSION
The results of the present study show that citalopram amplifies
the influence of the living conditions on mood in a dosedependent manner as sociodemographic characteristics modify
Translational Psychiatry (2017), 1 – 8
treatment response in the same direction in the two dose groups,
but in the 40 mg per day dose group the effect is much larger and
reaches statistical significance. In addition, the magnitude of the
influence of the living conditions on mood is much greater—up to
37-fold—in the 40 compared to the 20 mg per day dose group.
These results support the undirected susceptibility to change
hypothesis,2 which predicts that, as SSRI increases the susceptibility to the environment, treatment outcome is more profoundly
affected by the quality of the living conditions in patients
receiving high dosages of SSRIs.
The STAR*D clinical trial provides a unique opportunity to
investigate the role of citalopram as amplifier of the influence of
the living conditions on mood. It has allowed to consider a
subpopulation of patients with similar MDD severity and overlapping treatment history in order to analyze the amplification of
the influence of the sociodemographic features induced by
different dosages of citalopram. Given the clear ethical limitations
to perform a clinical trial aimed at directly measuring the effects of
the SSRIs in amplifying the beneficial, but especially the
detrimental effects of the environment in patients, the STAR*D
data set is the best alternative to test the undirected susceptibility
to change hypothesis. In addition, the STAR*D clinical trial is the
largest ecologically valid 'real world' study of outpatients with
nonpsychotic major depressive disorder to date.1,19
Sociodemographic characteristics modified treatment outcome
in the same direction in the two dose groups, but these changes
did not reach statistical significance in the 20 mg per day dose
group. By contrast, in the 40 mg per day dose group, each one of
five sociodemographic characteristics—income, education, ethnicity, insurance and employment—significantly affected treatment
outcome. In addition, the magnitude of the effect of the
sociodemographic characteristics on mood, measured as the
percent of patients showing a positive outcome when exposed to
a favorable environment, was dose-dependent. In particular, the
influence of the living conditions was much greater in the 40 than
in the 20 mg per day dose group: improvement rate went from a
minimum of fivefold for employment status to a maximum of 37fold for education while remission rate went from twofold for
education to eightfold for income.
It is worth noting that, in line with our hypothesis and with
previous studies showing that a favorable and supportive
environment increases antidepressant efficacy,1,10,11,13,20 the
present results indicate not only that citalopram amplifies the
influence of the living conditions on mood, but also that the
quality of the living environment drives the change in mood. In
particular, in the 40 mg per day dose group, where this change
reaches statistical significance, improvement and remission were
shown at significantly higher rates by patients living in conditions
associated with a high quality of life, such as having a working
employment status, more than 16 years of education and a high
income. The exception concerns insurance where those individuals having public insurance showed the worse outcome, even
compared to those having no insurance.21 This is concordant with
previous studies reporting, for instance, that having public
insurance predicts the highest attrition.17 In addition, higher rates
of improvement and remission were associated with being of
Caucasian ethnicity. The sociodemographic characteristics here
found to affect treatment outcome have been previously shown
to both determine rates of major depression morbidity and
mortality22 and affect SSRI outcome.1 According to our
hypothesis,2 even a worsening of symptomatology could be
predicted when citalopram treatment is administered in an
adverse environment. However, only a very limited worsening of
the QIDS-SR score was expected in patients receiving the
treatment while living in an unfavorable condition (Figure 1)
because of the implementation of the STAR*D guidelines for
discontinuing participants, which recommend that patients drop
out of the study when clinicians consider that discontinuation is in
�Citalopram amplifies the influence of environment
F Chiarotti et al
5
Table 2.
Baseline sociodemographic characteristics associated with percentage of patients improved by citalopram dose
Characteristics
ORb
20 mg per die; N = 357 (60.4%)
P-value
a
40 mg per die; N = 234 (39.6%)
ORb
Improved %
Not improved %
Improved %
Not improved %
Overall
56.9
43.1
54.7
45.3
Ethnicity
Non-Caucasianc
Caucasian
54.6
57.8
45.4
42.2
0.88
45.6
57.6
54.4
42.4
0.62
Sex
Female
Male
58.6
54.1
41.4
45.9
1.20
57.9
50.0
42.1
50.0
1.37
Marital status
No more married
Never married
Married
71.4
57.0
59.9
28.6
43.0
40.2
1.68
0.89
54.2
59.3
59.8
45.8
40.7
40.2
0.80
0.98
Employment status
Unemployed and retired
Employed
60.0
63.2
40.0
36.8
0.87
48.0
64.9
52.0
35.1
0.50
Educationd
oCollege
⩾ College
62.2
61.7
37.8
38.3
1.02
50.0
70.7
50.0
29.3
0.42
Incomee
Low
Middle
High
54.3
59.7
57.8
45.7
40.4
42.2
0.87
1.08
43.3
50.6
67.5
56.7
49.4
32.5
0.37
0.49
Experienced traumatic event
No
Yes
58.1
54.3
41.9
45.7
1.17
51.5
59.8
48.5
40.2
0.71
Witnessed traumatic event
No
Yes
58.5
52.2
41.5
47.8
1.29
51.8
63.2
48.2
36.8
0.63
Drug abuse
No
Yes
52.1
50.0
48.0
50.0
1.09
46.4
75.0
53.6
25.0
0.29
Insurance status
Public insurance
No insurance
Private insurance
68.0
62.1
61.6
32.0
37.9
38.4
1.33
1.02
14.3
53.9
67.3
85.7
46.1
32.7
0.08
0.57
0.5750
0.1150
0.4069
0.2371
0.1300
0.8100
0.5790
0.0219
0.9336
0.0053
0.7200
0.0100
0.4731
0.2100
0.2660
0.1130
0.9540
0.2950
0.8300
Age (years; units = 10)f
Years of education (units = 4)f
Income ($ per month; units = 1000)f
Age at onset of first MDE (units = 10) f
Number of MDEs (units = 5) f
QIDS-SR16 (difference W4 − Enroll; units = 1)f
P-value
0.0031
Mean (s.d.)
Mean (s.d.)
ORb
P-value
Mean (s.d.)
Mean (s.d.)
ORb
P-value
40.6
14.2
2718
26.8
4.9
− 6.1
42.3
14.3
2606
27.3
5.7
− 6.3
0.91
0.98
1.01
0.98
0.92
1.01
0.2326
0.8610
0.7100
0.7860
0.2287
0.7080
40.2
14.9
3483
24.7
4.6
− 5.7
42.2
13.9
2385
25.5
7.7
− 7.6
0.88
1.53
1.08
0.96
0.86
1.13
0.2200
0.0402
0.0940
0.6630
0.0436
0.0005
(13.5)
(3.4)
(2644)
(14.6)
(8.3)
(4.1)
(13.7)
(3.3)
(2973)
(15.8)
(6.9)
(3.7)
(12.6)
(3.0)
(5446)
(13.2)
(6.3)
(3.8)
(12.9)
(2.9)
(3279)
(14.6)
(14.6)
(3.8)
Abbreviations: MDE, major depressive episode; OR, odds ratio; QIDS-SR16, Quick Inventory of Depressive Symptomatology-Self-Report. aImprovement was
measured as a reduction ⩾ 1 in 16-item QIDS-SR16 score between weeks 4 and 6. bFor characteristics for which the measurement is categorical, the comparison
is with the group listed last under the category or with the opposite characteristic. For characteristics for which the measurement is continuous, the odds ratio
is relative to an increase in the measurement by the number of units indicated. cAsian, American Indian or Alaskan Native, Native Hawaiian/Other Pacific
Islander or multiracial. d oCollege = ⩽ 16 years of schooling; ⩾ College = ⩾ 16 years of schooling. eLow = monthly gain ⩽ $1000, Middle = monthly gain $1000–
$2500, High = monthly gain 4$2500. fUnits are relevant to odds ratios only OR, MDE.
the best interest of the participant. Nevertheless, an effect of
treatment, both for better and for worse,23 can be appreciated
when considering the percent of patients showing improvement
or worsening according to the quality of the living conditions in
the two dose groups (Supplementary Figure S2). Indeed, the 40,
compared to 20 mg per day dose, leads to an increase not only of
the percent of improvements in patients living in a favorable
environment, but also of the percent of worsening in patients
Translational Psychiatry (2017), 1 – 8
�Citalopram amplifies the influence of environment
F Chiarotti et al
6
Table 3.
Baseline sociodemographic characteristics associated with remission by citalopram dosea
Characteristics
Overall
Ethnicity
Non-Caucasianc
Caucasian
20 mg per die; N = 357
(60.4%)
REM %
NO REM %
35.9
64.1
ORb
ORb
40 mg per die; N = 234
(39.6%)
P-value
REM %
NO REM %
24.4
75.6
15.8
27.1
84.2
72.9
0.50
27.9
19.1
72.1
80.9
1.63
22.9
22.2
26.4
77.1
77.8
73.6
0.83
0.80
16.0
29.8
84.0
70.2
0.45
19.3
32.0
80.7
68.0
0.51
17.9
19.8
31.3
82.1
80.2
68.8
0.48
0.54
23.1
26.5
76.9
73.5
0.83
23.8
26.5
76.2
73.5
0.87
19.6
50.0
80.4
50.0
0.24
18.4
0.0
31.6
81.6
100.0
68.4
0.49
0.00
0.8622
35.2
36.1
64.8
63.9
0.96
Sex
Female
Male
36.9
34.1
63.1
65.9
1.13
Marital status
No more married
Never married
Married
45.5
33.7
37.1
54.5
66.3
62.9
1.41
0.86
Employment status
Unemployed and retired
Employed
36.4
39.5
63.6
60.5
0.88
Educationd
oCollege
⩾ College
41.1
33.9
58.9
66.1
1.36
Incomee
Low
Middle
High
33.3
43.0
32.8
66.7
57.0
67.2
1.02
1.54
Experienced traumatic event
No
Yes
37.4
32.5
62.6
67.5
1.25
Witnessed traumatic event
No
Yes
36.9
31.9
63.1
68.1
1.25
Drug abuse
No
Yes
35.6
50.0
64.4
50.0
0.55
Insurance status
No insurance
Public insurance
Private insurance
39.8
40.0
37.2
60.2
60.0
62.8
1.12
1.13
0.0872
0.5845
0.1300
0.2900
0.8200
0.5970
0.0326
0.2155
0.0484
0.2000
0.1100
0.3318
0.5510
0.3520
0.6650
0.6800
0.1820
0.9000
Age (years; units = 10)f
Years of education (units = 4)f
Income ($/month; units = 1000)f
Age at onset of first MDE (units = 10)f
Number of MDEs (units = 5)f
QIDS-SR16 (difference W4-Enroll; units = 1)f
P-value
0.1500
Mean (s.d.)
Mean (s.d.)
ORb
P-value
Mean (s.d.)
Mean (s.d.)
ORb
P-value
39.5
13.8
2543
27.0
3.7
− 6.7
42.4
14.5
2743
27.0
6.1
− 5.9
0.85
0.78
0.97
1.00
0.76
0.95
0.0565
0.0805
0.5208
0.9722
0.0152
0.0765
38.2
14.6
3506
25.9
4.2
− 6.4
42.1
14.4
2824
24.9
6.6
− 6.6
0.78
1.08
1.03
1.05
0.86
1.01
0.0470
0.7421
0.3620
0.6320
0.1980
0.7392
(13.0)
(3.4)
(2445)
(15.0)
(6.8)
(4.2)
(13.8)
(3.3)
(2964)
(15.2)
(8.0)
(3.7)
(13.4)
(3.3)
(4367)
(13.0)
(7.5)
(4.2)
(12.4)
(2.9)
(4682)
(14.1)
(11.7)
(3.8)
Abbreviations: MDE, major depressive episode; OR, odds ratio; QIDS-SR16, Quick Inventory of Depressive Symptomatology Self-Report; REM, remission.
Remission was defined as a score ⩽ 5 at week 6 on the 16-item QIDS-SR16. bFor characteristics for which the measurement is categorical, the comparison is
with the group listed last under the category or with the opposite characteristic. For characteristics for which the measurement is continuous, the odds ratio is
relative to an increase in the measurement by the number of units indicated. cAsian, American Indian or Alaskan Native, Native Hawaiian/Other Pacific Islander
or multiracial. d oCollege = ⩽ 16 years of schooling; ⩾ College = ⩾ 16 years of schooling. eLow = monthly gain ⩽ $1000; Middle = monthly gain $1000–$2500;
High = monthly gain4$2500. fUnits are relevant to odds ratios only OR, MDE.
a
living in an unfavorable environment. For instance, in the 20 mg
per day dose group, patients with a college degree showing an
improvement were 62% and patients with a high school degree
showing a worsening were 21%. In the 40 mg per day group,
Translational Psychiatry (2017), 1 – 8
these percent rise up, respectively, to 71% and 35%. As further
example, in the 20 mg per day dose group, patients with a high
income showing an improvement were 58% and patients
with a low income showing a worsening were 35% while, in the
�Citalopram amplifies the influence of environment
F Chiarotti et al
7
Education
20 mg/d
40 mg/d
Income
20 mg/d
40 mg/d
∆ QIDS-SR16
0
*
0
**
*
-1
-2
< college
≥ college
-1
-2
lower
Insurance
Employment
∆ QIDS-SR16
0
20 mg/d
40 mg/d
2
20 mg/d
*
40 mg/d
1
-1
0
-1
-2
unemployed
employed
-2
Ethnicity
1
∆ QIDS-SR16
higher
middle
20 mg/d
public
no
private
Marital Status
40 mg/d
*
0
20 mg/d
40 mg/d
0
-1
-1
-2
-2
non-Caucasian
Caucasian
no more
never
married
Figure 1. Variation in the QIDS-SR16 score, measured between weeks 4 and 6, in patients receiving either the 20 or 40 mg per day dose.
Negative values indicate a reduction of the QIDS-SR16 score, that is, an improvement of the patient’s mental health condition. Only patients
receiving the 40 mg per day dose showed a variation in the QIDS-SR16 significantly moderated by the sociodemographic characteristics.
* Indicates difference with the first group; *Po 0.05 and ***P o0.001. QIDS-SR16, Quick Inventory of Depressive Symptomatology Self-Report.
40 mg per day group, these are, respectively, 68% and 40%
(Supplementary Figure S2).
Taking into account the role of SSRIs as amplifier of the
influence of living conditions on mood—and, consequently, the
quality of the environment as a moderator of SSRI treatment
outcome24—may explain the inconsistency of the findings in the
literature about SSRI efficacy. Indeed, overlooking the environment as the key stratifying factor in treatment response might
have led to the reported contradictory results in antidepressant
outcome. The conceptual shift in considering the action of SSRIs
from being the causative factor for recovering from major
depression to acting as a permissive factor for the influence of
the living conditions on the psychopathology allows to reconcile
experimental and clinical data that apparently do not fit together.2
For instance, the theoretical framework currently available in
the literature leads to the paradox that the same molecular
mechanism of action has two opposite outcomes: high extracellular
serotonin levels are beneficial when induced by SSRI administration, but confer a high risk to develop psychopathology when
associated to the s variant of the serotonin-transporter-linked
polymorphic region (5-HTTLPR). This discordant picture can be
coherently interpreted in light of our results and the undirected
susceptibility to change hypothesis, positing that high serotonin
levels lead to increased plasticity and thus to high susceptibility to
change, which may promote either an improvement or a
worsening, according to the quality of the environment.2 It is
worth noting that the effects of citalopram described in the
present paper may represent only part of the action of SSRIs on
mood as the main target of these drugs, that is, the serotoninergic
system, has a high molecular complexity and is involved in a wide
range of physiological functions.
The major limitation of the present study is the short time frame
(2-week period) over which data of the STAR*D clinical trial have
been extracted. This period had to be chosen because it is the
only one allowing to consider patients with overlapping clinical
history. Longer or different treatment periods or other patient
groups would have not allowed to keep data validity. By contrast,
the fact that coherent significant results have been found in such
a short time frame suggests that the described phenomenon is
robust. Further limitations include open treatment design, the use
Translational Psychiatry (2017), 1 – 8
�Citalopram amplifies the influence of environment
F Chiarotti et al
8
of a single antidepressant agent (citalopram) and the lack of
placebo control. Although data analyses did not include correction
for multiple comparisons, the overall consistence of the results
support their reliability. It is worth noting that depression
treatment disparities experienced by different ethnicities may
result from stigma, clinician failure to engage with the patient,
poor patient activation, treatment adherence and other factors,
including biological differences.25
In conclusion, acknowledging the role of SSRIs as amplifier of the
influence of the living conditions on mood represents a critical step
in developing a personalized medicine approach aimed at better
matching patients with treatment and avoiding potential harmful
consequences. The control of the patients' living environment could
be achieved by training patients to cope with harsh conditions, for
instance, through cognitive behavioral therapy,26 or taking them in
charge through appropriate specialized services, as it is unlikely that
people can rapidly and effectively change their living milieu. The
cost of this approach is limited as no new psychoactive molecules
need to be developed, while the benefits for the patients could be
substantial. Finally, the undirected susceptibility to change hypothesis may contribute building a new theoretical framework
capable to integrate the 'chemical imbalance theory' with other
hypotheses acknowledging the importance of social–psychological
factors in MDD, as both approaches are needed to explain the
mechanisms underlying the recovery from the disease.
CONFLICT OF INTEREST
The authors declare no conflict of interest.
ACKNOWLEDGMENTS
This study was funded by the Italian Ministry of Health, Ricerca Finalizzata RF-201102349921 to IB and Olga Mayenfisch foundation to Irmgard Amrein. IB was partially
supported by EU, Marie Curie IEF fellowship for Experienced Researcher n: 302881—
Acronym: MODELMOOD. We warmly thank Professor Carmine Pariante (King's
College London, UK) and Dr Francesca Cirulli (Istituto Superiore di Sanità, Rome, Italy)
for critical reading and Dr Irmgard Amrein (Institute of Anatomy, University of Zurich,
Zurich, Switzerland), Prof David Wolfer (Institute of Anatomy, University of Zurich,
Zurich, Switzerland) and Silvia Poggini (Istituto Superiore di Sanità, Rome, Italy) for
help and support.
DISCLAIMER
The funders of the study had no role in the study design or
conduct, data collection, data management, data analysis, data
interpretation or writing of the report.
REFERENCES
1 Trivedi MH, Rush AJ, Wisniewski SR, Nierenberg AA, Warden D, Ritz L et al. Evaluation of outcomes with citalopram for depression using measurement-based
care in STAR*D: implications for clinical practice. Am J Psychiatry 2006; 163: 28–40.
2 Branchi I. The double edged sword of neural plasticity: increasing serotonin levels
leads to both greater vulnerability to depression and improved capacity to
recover. Psychoneuroendocrinology 2011; 36: 339–351.
3 Branchi I, Santarelli S, Capoccia S, Poggini S, D'Andrea I, Cirulli F et al. Antidepressant treatment outcome depends on the quality of the living environment:
a pre-clinical investigation in mice. PLoS ONE 2013; 8: e62226.
4 Alboni S, Poggini S, Garofalo S, Milior G, El Hajj H, Lecours C et al. Fluoxetine
treatment affects the inflammatory response and microglial function according to
the quality of the living environment. Brain Behav Immun 2016; 58: 261–271.
5 Alboni S, van Dijk RM, Poggini S, Milior G, Perrotta M, Drenth T et al. Fluoxetine
effects on molecular, cellular and behavioral endophenotypes of depression are
driven by the living environment. Mol Psychiatry 2015; e-pub ahead of print 15
September 2015. doi:10.1038/mp.2015.142.
6 Bornstein SR, Schuppenies A, Wong ML, Licinio J. Approaching the shared biology
of obesity and depression: the stress axis as the locus of gene-environment
interactions. Mol Psychiatry 2006; 11: 892–902.
7 Mastronardi C, Paz-Filho GJ, Valdez E, Maestre-Mesa J, Licinio J, Wong ML. Longterm body weight outcomes of antidepressant-environment interactions. Mol
Psychiatry 2011; 16: 265–272.
8 Downing RW, Rickels K. Predictors of response to amitriptyline and
placebo in three outpatient treatment settings. J Nervous Ment Dis 1973; 156:
109–129.
9 Keitner GI, Ryan CE, Miller IW, Norman WH. Recovery and major depression: factors associated with twelve-month outcome. Am J Psychiatry 1992; 149:
93–99.
10 Perlis RH, Alpert J, Nierenberg AA, Mischoulon D, Yeung A, Rosenbaum JF et al.
Clinical and sociodemographic predictors of response to augmentation, or dose
increase among depressed outpatients resistant to fluoxetine 20 mg per day. Acta
Psychiatr Scand 2003; 108: 432–438.
11 Rickels K, Jenkins BW, Zamostien B, Raab E, Kanther M. Pharmacotherapy in
neurotic depression. Differential population responses. J Nervous Ment Dis 1967;
145: 475–485.
12 Ronalds C, Creed F, Stone K, Webb S, Tomenson B. Outcome of anxiety and
depressive disorders in primary care. Br J Psychiatry 1997; 171: 427–433.
13 Spillmann M, Borus JS, Davidson KG, Worthington JJ 3rd, Tedlow JR, Fava M.
Sociodemographic predictors of response to antidepressant treatment. Int J
Psychiatr Med 1997; 27: 129–136.
14 Adler NE, Ostrove JM. Socioeconomic status and health: what we know and what
we don't. Ann N Y Acad Sci 1999; 896: 3–15.
15 Fava M, Rush AJ, Trivedi MH, Nierenberg AA, Thase ME, Sackeim HA et al. Background and rationale for the sequenced treatment alternatives to relieve
depression (STAR*D) study. Psychiatr Clin N Am 2003; 26: 457–494, x.
16 Rush AJ, Fava M, Wisniewski SR, Lavori PW, Trivedi MH, Sackeim HA et al.
Sequenced treatment alternatives to relieve depression (STAR*D): rationale
and design. Controlled Clin Trials 2004; 25: 119–142.
17 Warden D, Rush AJ, Wisniewski SR, Lesser IM, Thase ME, Balasubramani GK et al.
Income and attrition in the treatment of depression: a STAR*D report. Depress
Anxiety 2009; 26: 622–633.
18 Schmidt CO, Kohlmann T. When to use the odds ratio or the relative risk? Int J
Public Health 2008; 53: 165–167.
19 Warden D, Rush AJ, Trivedi MH, Fava M, Wisniewski SR. The STAR*D Project
results: a comprehensive review of findings. Curr Psychiatr Rep 2007; 9: 449–459.
20 Jain FA, Hunter AM, Brooks JO 3rd, Leuchter AF. Predictive socioeconomic and
clinical profiles of antidepressant response and remission. Depress Anxiety 2013;
30: 624–630.
21 Hahn B, Flood AB. No insurance, public insurance, and private insurance: do these
options contribute to differences in general health? J Health Care Poor Underserved 1995; 6: 41–59.
22 Lorant V, Croux C, Weich S, Deliege D, Mackenbach J, Ansseau M. Depression and
socio-economic risk factors: 7-year longitudinal population study. Br J Psychiatry
2007; 190: 293–298.
23 Belsky J. The differential susceptibility hypothesis: sensitivity to the environment
for better and for worse. JAMA Pediatr 2016; 170: 321–322.
24 Kraemer HC, Frank E, Kupfer DJ. Moderators of treatment outcomes: clinical,
research, and policy importance. JAMA 2006; 296: 1286–1289.
25 Schraufnagel TJ, Wagner AW, Miranda J, Roy-Byrne PP. Treating minority patients
with depression and anxiety: what does the evidence tell us? Gen Hosp Psychiatry
2006; 28: 27–36.
26 Wiles N, Thomas L, Abel A, Ridgway N, Turner N, Campbell J et al. Cognitive
behavioural therapy as an adjunct to pharmacotherapy for primary care based
patients with treatment resistant depression: results of the CoBalT randomised
controlled trial. Lancet 2013: 381: 375–384.
This work is licensed under a Creative Commons Attribution 4.0
International License. The images or other third party material in this
article are included in the article’s Creative Commons license, unless indicated
otherwise in the credit line; if the material is not included under the Creative Commons
license, users will need to obtain permission from the license holder to reproduce the
material. To view a copy of this license, visit http://creativecommons.org/licenses/
by/4.0/
© The Author(s) 2017
Supplementary Information accompanies the paper on the Translational Psychiatry website (http://www.nature.com/tp)
Translational Psychiatry (2017), 1 – 8
�
 Alessandro Giuliani