PLOS ONE
RESEARCH ARTICLE
Electrical signalling on Bt and non-Bt cotton
plants under stress by Aphis gossypii
Jéssica K. S. Pachú ID1*, Francynes C. O. Macedo2, José B. Malaquias3, Francisco
S. Ramalho4, Ricardo F. Oliveira2, Flávia Pereira Franco ID1, Wesley A. C. Godoy1
1 Department of Entomology and Acarology, Luiz de Queiroz College of Agriculture (ESALQ), University of
São Paulo (USP), Piracicaba, São Paulo, Brazil, 2 Department of Biological Sciences, Luiz de Queiroz
College of Agriculture (ESALQ), University of São Paulo (USP), Piracicaba, São Paulo, Brazil, 3 Department
of Biostatistics, São Paulo State University (UNESP), Botucatu, Brazil, 4 Biological Control Unit ⁄ Embrapa
Algodão, Campina Grande, Paraı́ba, Brazil
a1111111111
a1111111111
a1111111111
a1111111111
a1111111111
OPEN ACCESS
Citation: Pachú JKS, Macedo FCO, Malaquias JB,
Ramalho FS, Oliveira RF, Franco FP, et al. (2021)
Electrical signalling on Bt and non-Bt cotton plants
under stress by Aphis gossypii. PLoS ONE 16(4):
e0249699. https://doi.org/10.1371/journal.
pone.0249699
Editor: Yonggen Lou, Zhejiang University, CHINA
Received: September 15, 2020
Accepted: March 24, 2021
Published: April 8, 2021
Copyright: © 2021 Pachú et al. This is an open
access article distributed under the terms of the
Creative Commons Attribution License, which
permits unrestricted use, distribution, and
reproduction in any medium, provided the original
author and source are credited.
Data Availability Statement: All relevant data are
within the manuscript and its Supporting
Information files.
Funding: This study was funded by Coordenação
de Aperfeiçoamento de Pessoal de Nı́vel Superior
—Brazil (CAPES)— Finance Code 001 to JP
(CAPES process number: 88882.328551/2019–
01), Fundação de Amparo à Pesquisa do Estado de
São Paulo in the form of Ph.D. and postdoctorate
scholarships for JBM (FAPESP process: 2018/
20435–5, 2017/05953–7, 2015/20380–8) and for
financing Projects 2014/16609–7 347 and 2017/
* jessikapachu@gmail.com
Abstract
Plants have developed various mechanisms to respond specifically to each biotrophic
attack. It has been shown that the electrical signals emitted by plants are associated with
herbivory stress responses and can lead to the activation of multiple defences. Bt cotton is a
genetically modified pest-resistant plant that produces an insecticide from Bacillus thuringiensis (Bt) to control Lepidopteran species. Surprisingly, there is no study–yet, that characterizes the signalling mechanisms in transgenic cotton plants attacked by non-target
insects, such as aphids. In this study, we characterized the production of electrical signals
on Bt and non-Bt cotton plants infested with Aphis gossypii and, in addition, we characterized the dispersal behaviour of aphids to correlate this behaviour to plant signalling
responses. Electrical signalling of the plants was recorded with an extracellular measurement technique. Impressively, our results showed that both Bt and non-Bt cotton varieties,
when attacked by A. gossypii, emitted potential variation-type electrical signals and clearly
showed the presence of distinct responses regarding their perception and the behaviour of
aphids, with evidence of delay, in terms of signal amount, and almost twice the amount of
Cry1F protein was observed on Bt cotton plants at the highest density of insects/plant. We
present in our article some hypotheses that are based on plant physiology and insect behaviour to explain the responses found on Bt cotton plants under aphid stress.
Introduction
An organism’s capacity to survive in an ecosystem depends on its ability to respond quickly
and efficiently to external stimuli and to develop effective and sustainable defences [1]. For
this reason, plants have developed numerous mechanisms to react specifically to each biotrophic attack, and cell-to-cell communication between distant tissues is essential to coordinate activities in response to the environment. Thus, plants need to produce a signalling
mechanism to integrate perception, transmission, and response to biotic and abiotic actions
that occur in the ecosystem [2–5]. Electrical signals have been shown to be associated with
PLOS ONE | https://doi.org/10.1371/journal.pone.0249699 April 8, 2021
1 / 15
�PLOS ONE
21097–3 (FAPESP process), and Conselho
Nacional de Desenvolvimento Cientı́fico e
Tecnológico (CNPq) to WACG and FSR. The
funders had no role in study design, data collection
and analysis, decision to publish, or preparation of
the manuscript.
Competing interests: NO authors have competing
interests.
Electrophysiology of cotton under stress by aphid
responses to herbivory [6], leading to the activation of multiple organism defences [7]. However, studies that better characterize the electrical signalling mechanisms in plants attacked by
herbivores, such as aphids, are still scarce.
The aphid Aphis gossypii Glover (Hemiptera: Aphididae) is a cotton-damaging pest [8] of
cotton. and one of the most important non-target species of Bt cotton, which is a genetically
modified variety expressing proteins derived from Bacillus thuringiensis (Berliner) (Bt), which
gives them high efficiency against some lepidopteran species [9, 10]. However, researchers
have raised concerns about their potential impact on nontarget organisms such as aphids [11],
and their stress on the Bt and non-Bt plant physiology [12].
Different environmental stimuli cause specific responses in living cells that are capable of
transmitting electrical signals [13, 14]. Among the signals involved in electrophysiological
responses, variation potentials are characterized by rapid depolarization and subsequent slow
repolarization. The amplitude and shape of the variation potentials (VPs) vary with the stimulus intensity. In addition, the magnitude and speed of responses decrease as the signal moves
away from the stimulus site, and its induction depends on the type of damage sustained [15].
Although the methods used to produce transgenic crops are being continuously improved,
the relationship of plant-insect can be influenced. Thus, it is crucial to understand how plants
produce different signs of stress and convert them into appropriate specific responses [12].
Therefore, it is important to characterize the type of electrical signalling of Bt and non-Bt cotton plants as a function of the stress caused by A. gossypii and provide insights to understand
how plants convert these different signals into appropriate physiological reactions. In our
study, we characterized the production of electrical signals on Bt [variety WideStrike1] cotton
plants and their non-Bt isoline [variety FM 993] infested with A. gossypii in alternating light–
dark cycles. The aphid A. gossypii was used as a model insect for the study because insect feeding occurs at the phloem level, and the biological interactions between the herbivore and its
host plant can be considered unique. Additionally, we characterized A. gossypii dispersal
behaviour to relate it to plant signalling responses.
Methods
Characterization of the electrical signalling potential of Bt and non-Bt
cotton plants
Aphis gossypii were reared at the Insect Ecology and Forestry Entomology Laboratory of the
Department of Entomology and Acarology (LEA) of the Luiz de Queiroz College of Agriculture (ESALQ) at the University of São Paulo Paulo (USP), Piracicaba, São Paulo, Brazil. Adults
of A. gossypii were collected in cotton plants in the experimental area from LEA. Specimens of
A. gossypii were transported to the laboratory for the establishment of rearing at LEA. Insectrearing stocks were kept by 2 generations in a phytotron chamber at 26±1˚C, with relative
humidity of 60±10% and photophase of 12 h.
Cotton plants expressing Cry1Ac/Cry1F [variety FM 975 (WideStrike1)] and their non-Bt
isoline [variety FM 993] were used in this study. The cotton plants were planted in plastic pots
(one plant per pot) 25 cm in diameter and 40 cm in height, containing soil conditioning substrate (Forth1) and kept in a phytotron chamber at 26±1˚C, with relative humidity of 60
±10% and photophase of 12 h.
Bioassays to record electrical signalling of cotton plants were conducted in the laboratory.
The experimental design was a randomized block design, and each treatment was repeated 10
times = 10 plants per treatment. The measurement of electrical signals was made on the Bt or
non-Bt cotton plant surface that reached the six-leaf stage. A technique was used to detect electrical signalling potential differences over long periods. At the time of the electrical signal
PLOS ONE | https://doi.org/10.1371/journal.pone.0249699 April 8, 2021
2 / 15
�PLOS ONE
Electrophysiology of cotton under stress by aphid
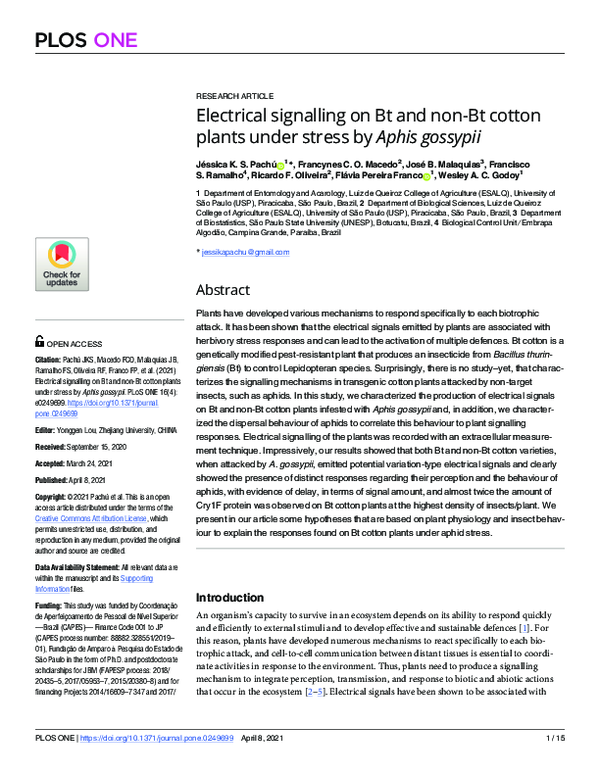
Fig 1. Scheme of the electrodes (El, E2, E3 and E4) in the cotton plant inserted into the stem; and R (reference
electrode) inserted into the soil.
https://doi.org/10.1371/journal.pone.0249699.g001
measurements, the cotton plants were placed in a Faraday cage to ensure electromagnetic isolation of the environment at 26±1˚C, with a relative humidity of 60±10% and a 12-h
photophase.
Measurements were made using electrodes consisting of a 0.25–0.5 mm diameter silver lead
wire chlorinated in 3 M KCl solution. After the acclimatization period, five electrodes were
used. Four of which were inserted in different arrangements along the stem of cotton plants.
The reference electrode (fifth electrode), that has the same composition of the recording electrodes, was inserted in the ground (Fig 1). The electrodes are connected to a four-channel data
acquisition system with a built-in amplifier (World Precision Instruments Lab-Trax-4 / 24T
model) that is connected to a computer with LabScribe1 version 3.0 software that decodes the
signal [13, 16–18].
The recordings of electrical activities in cotton plants started one hour after the electrode
insertion. The records were performed continuously for three days. The following variables
were obtained: amplitude of the signal, number of signals generated, time after insect infestation to emission of the signals and frequency of signals generated by cotton plants. The electrical signalling profile was contrasted between Bt and non-Bt cotton plants infested with those
not infested with A. gossypii (control).
PLOS ONE | https://doi.org/10.1371/journal.pone.0249699 April 8, 2021
3 / 15
�PLOS ONE
Electrophysiology of cotton under stress by aphid
Bt and non-Bt cotton varieties were planted in plastic pots containing soil conditioning substrate (Forth1) and kept separately in cages under the same climate conditions mentioned
before. The plants were infested with the aphids with a paintbrush. We used the following 6
treatments: a1. Bt cotton plants infested with 30 aphids/plant; a2. Bt cotton plants infested
with 60 aphids/plant; a3. Bt cotton without aphid (Bt cotton control); a4. non-Bt cotton plants
infested with 30 aphids/plant; a5. non-Bt cotton plants infested with 60 aphids/plant; and a6.
non-Bt cotton without aphid (Bt cotton control).
Dispersal pattern of A. gossypii in Bt and non-Bt cotton plants
Bioassays were performed to study aphid behaviour and associate it with data obtained from
electrical signalling bioassays. A randomized block design, distributed in 10 blocks = 10
plants/treatment, with four treatments was used: a1. Bt cotton plants infested with 30 aphids/
plant; a2. Bt cotton plants infested with 60 aphids/plant; a3. non-Bt cotton plants infested with
30 aphids/plant and a4. non-Bt cotton plants infested with 60 aphids/plant. Bt and non-Bt cotton varieties were planted in plastic pots containing soil conditioning substrate (Forth1) and
kept in the same climate conditions mentioned before.
Aphid infestations were performed on Bt and non-Bt cotton that reached the six-leaf stage.
We used a paintbrush to infestation of the plants with the aphids. The plants were divided into
the following equidistant three regions: bottom, middle and top. The number of aphids was
recorded in each plant region at 0 (immediately during infestation), 24, 48 and 72 h after infestation. To evaluate aphid dispersal behaviour as a function of varieties (Bt and non-Bt cotton)
and aphid densities, the negative binomial distribution parameter k was used.
There are three basic spatial pattern distributions: random distribution, regular or uniform
distribution, and aggregate or contagious distribution. This parameter k is an indicator of uniform distribution, where when k tends to zero, the distribution is highly aggregated, k ranging
from 2 to 8 indicates moderate aggregation, and values greater than 8 (k > 8) indicate that the
distribution is random (39). The k values were estimated by the method of moments (a statistical method for constructing an estimator).
Data analyses
Characterization of electrical signalling potential of Bt and non-Bt cotton plants.
Descriptive analyses were conducted with boxplots aiming to characterize the quantiles, medians, maximum and minimum values, and outliers of the variables and time for the emission of
VPs (variation potentials) after the infestations with aphids on Bt and non-Bt cotton plants
and amplitude of VPs.
Correlation analyses were conducted between the variables VP amplitude and signal emission time after infestation plants within each cotton variety. The degree of correlation between
the variables in each condition was studied using Spearman’s rank correlation coefficient (P
<0.05) using the cor.test function of the R program.
Data on the number of signals per time interval after infestation of Bt and non-Bt cotton
plants with aphids were subjected to deviance analysis, with the purpose of studying the interaction involving cotton variety, aphid / plant density and time interval. A generalized linear
model with a quasi-Poisson distribution was used. The goodness of fit of the model was evaluated with a simulated normal envelope using the hnp package in the R program [17].
Deviance analysis was applied to study the interaction involving cotton variety, aphid/plant
density and period (photophase / scotophase) in the number of VPs. Data were divided into
four sections, three of which corresponded to the data recorded during three days of observation, and the last section corresponded to the accumulated data recorded during the three days
PLOS ONE | https://doi.org/10.1371/journal.pone.0249699 April 8, 2021
4 / 15
�PLOS ONE
Electrophysiology of cotton under stress by aphid
of evaluation. Negative binomial generalized linear models were used for approximately the
1st and 2nd evaluation days, while quasi-Poisson models were adopted for data recorded on
the 3rd day and total accumulated over the three days of evaluations. We used a half-normal
plot with a simulated envelope with the hnp package [17] to assess the goodness-of-fit of the
models.
Aphis gossypii dispersal pattern on Bt and non-Bt cotton plants
The parameter k in each cotton variety and density was compared by confidence intervals.
Confidence intervals were generated from the values of k for each block. We used the nonparametric bootstrap technique, with 10,000 pseudoreplications, and for the resampled parameter
in each treatment, we used the R program boot package [18].
Multinomial analysis. The probability of aphids occurring within each region of Bt and
non-Bt cotton plants in each treatment (variety and aphid density) was estimated and compared with a multinomial linear model. The analyses to estimate the probabilities and their
comparisons were conducted with nnet [19] and emmeans [20] packages from R.
Results
Characterization of the electrical signalling potential of Bt and non-Bt
cotton plants
In descriptive analysis, it was possible to visualize that Bt cotton plants when infested with A.
gossypii emitted the first VPs (“minimum value” in boxplot) between time intervals of 0.31 h
(60 aphids/plant) and 0.64 h (30 aphids/plant) (Fig 1). In the absence of aphids, only two Bt
cotton plants emitted these electrophysiological signals. Non-Bt cotton plants emitted the first
VPs (“minimum value” in boxplot) after 0.80 h when kept at 30 aphids/plant and after 1.60 h
at the density of 60 aphids/plant (Fig 2).
The Bt and non-Bt cotton plants infested with aphids emitted signals after 60 h of aphid
infestation (Fig 2), while in cotton plants used as a control, the maximum signal emission values were observed at 55 and 57 h in non-Bt and Bt cotton plants, respectively (Fig 2).
The maximum amplitude (mV) (“maximum value” in boxplot) of VP found in the control
cotton plants was near -28 mV. In general, the mean amplitude (mV) of VP (points within the
boxplots) was near all treatments, ranging from -17 mV (Bt–control cotton plants) to -11.22
mV (non-Bt cotton plants infested with 30 aphids/plant). Outliers (points out of boxplots)
occurred for 30 aphid/plant (-129 mV) infested non-Bt cotton plants and 60 aphid/plant
(-116.60 mV) infested Bt cotton plants (Fig 3).
Spearman rank analysis revealed that there was no correlation between the amplitude (mV)
of VP of VP and time (h) to emission of signals by cotton plants after aphid infestation at all
densities studied within each variety (Bt and not Bt), except at the densities of 30 aphids / nonBt cotton plants (ρ = -0.2659; P = 0.0060) and 60 aphids/Bt cotton plants (ρ = - 0.3528;
P = 0.00254).
Analyzing the number of VPs emitted by the cotton plants, we observed that infestationfree plants emitted few signals, with an average accumulation of 0.75 (control–Bt cotton) and
2.50 signals (control–non-Bt cotton) over 72 h. Only two Bt cotton plants emitted electrical
signals in the absence of aphid stress (Table 1).
In the accumulated emission of VPs over 72 h, it was verified that Bt cotton plants exposed
to 60 aphids/plant density emitted fewer signals compared to the other conditions (P < 0.05)
under aphid stress. However, by assessing the emission within the intervals, the deviance analysis revealed that the signal emission pattern in each variety was influenced by the time interval
PLOS ONE | https://doi.org/10.1371/journal.pone.0249699 April 8, 2021
5 / 15
�PLOS ONE
Electrophysiology of cotton under stress by aphid
Fig 2. Boxplot of time (h) of exposure of Bt and non-Bt cotton plants to different densities of A. gossypii emitting potentials of variation (VPs) (mV). Bt and non-Bt
cotton plants were infested at densities of 30 and 60 aphids/plant and in the absence of aphids (Control). Circle within the boxplot corresponds to mean of time for each
treatment.
https://doi.org/10.1371/journal.pone.0249699.g002
and aphid density, as there was a significant interaction between these three factors
(P = 0.0488) (Table 1).
The highest number of signals emitted by Bt cotton plants when exposed to aphids occurred
in the time interval after infestation of 0–12 h (30 aphids/plant) and 0–12, 36–48 and 60–72 h
(60 aphids/plant) (Table 1, Fig 4).
When we compared the signal emission pattern between combined treatments involving
aphid densities and cotton varieties within each time interval, it was possible to verify a delay
in terms of the production pattern of signalling on Bt cotton plants under stress with 60
insects/plant because until the time interval of 36 h after infestation, there was a lower signal
emission by Bt cotton plants when exposed to 60 aphids/plant in relation to the other conditions of aphid density/Bt or non-Bt cotton variety (Table 1, Fig 4).
In the time interval of 36-48 h, the emission of signals by Bt cotton plants was lower only in
relation to Bt cotton with 30 aphids/plant. Additionally, in the time interval of 60-72 h, the signal production by cotton plants was higher when the Bt and non-Bt cotton plants were
exposed to densities of 60 and 30 aphids, respectively, in relation to other conditions (Table 1,
Fig 4).
PLOS ONE | https://doi.org/10.1371/journal.pone.0249699 April 8, 2021
6 / 15
�PLOS ONE
Electrophysiology of cotton under stress by aphid
Fig 3. Boxplot of amplitude (mV) of variation potentials in Bt and non-Bt cotton plants exposed to different densities of A. gossypii Bt and non-Bt cotton plants
exposed to densities of 30 and 60 aphids/plant and in the absence of aphids (Control). Circle within the boxplot corresponds to mean of time for each treatment.
Asterisk out of the boxplot corresponds to outlier for each treatment.
https://doi.org/10.1371/journal.pone.0249699.g003
The deviance analysis on the interaction of the factors: aphid density versus cotton variety
versus light period within each studied day (1st, 2nd or 3rd day) and accumulated over these
three days influencing the number of VPs emitted by plants shows that there was no
Table 1. Number of variation potentials emitted (mean ± SE) by Bt and non-Bt cotton plants when subjected to different exposure times and densities of A. gossypii/plant.
Time interval (h)
Bt cotton
non- Bt cotton
0 (control)
30
60
0 (control)
30
60
0-12
0.00 ± 0.00nia
6.0 ± 2.17 A a
3.50 ± .89 A b
0.50 ± 0.50nia
6.00 ± 2.08 A a
6.25 ± 2.39 A a
12-24
0.00 ± 0.00nia
4.50 ± 1.04 B a
1.75 ± 0.47 C b
0.00 ± 0.00nia
4.75 ± 1.75 AB a
4.50 ± 1.25 BC a
24-36
nia
0.50 ± 0.25
2.75 ± 0.62 C b
1.00 ± 1.00 D d
0.75 ± 0.47nia
1.75 ± 0.75 C c
5.25 ± 1.88 AB a
36-48
0.00 ± 0.00nia
4.75 ± 1.25 B a
3.50 ± 1.04 A b
0.50 ± 0.28nia
3.75 ± 0.94 B ab
3.50 ± 0.86 C b
48-60
nia
0.25 ± 0.25
1.25 ± 0.62 D c
2.50 ± 0.50 B b
0.75 ± 0.75nia
5.75 ± 0.85 A a
5.00 ± 1.00 AB a
60-72
0.00 ± 0.00nia
2.25 ± 1.65 C b
4.00 ± 0.08 A a
0.00 ± 0.00nia
4.25 ± 1.54 AB a
1.50 ± 0.64 D c
22.00 ± 0.17 a
16.25 ± 0.13 b
2.50 ± 0.50nia
26.25 ± 0.21 a
26.00 ± 0.20 a
∑accumulated (total)
nia
0.75 ± 0.25
Capital letters compare averages within each column, and lowercase letters compare averages within each row. Means followed by the same letters do not differ from
each other by overlapping confidence intervals generated by the quasi-Poisson model (P <0.05). nia = not incorporated in the analysis, because the absence of variability.
https://doi.org/10.1371/journal.pone.0249699.t001
PLOS ONE | https://doi.org/10.1371/journal.pone.0249699 April 8, 2021
7 / 15
�PLOS ONE
Electrophysiology of cotton under stress by aphid
Fig 4. Variation potentials emitted (no.) (MEAN ± SE) by Bt and non-Bt cotton plants at different time intervals
(h) after infestation of 30 and 60 aphids / plant and control (absence of aphid). Mean data (points) and error bars
(SE) predicted by the generalized linear quasi-Poisson model, except for the plotted values for the control used in both
cotton varieties (Bt or not Bt).
https://doi.org/10.1371/journal.pone.0249699.g004
Table 2. Number of variation potentials emitted (mean ± SE) by Bt and non-Bt cotton plants exposed to different aphid densities / cotton plant and photophase
and scotophase on the 3rd assessment day.
Variety
non Bt Cotton
Density (aphid/plant)
Photophase
Scotophase
30
6.75 ± 1.43 A a
2.50 ± 1.50 A b
1.50 ± 0.86 B a
1.75 ± 1.03 A a
60
3.25 ± 1.18 AB a
4.50 ± 1.18 A a
5.00 ± 0.70 AB a
2.00 ± 1.08 A b
0.25 ± 0.25 nic
0.25 ± 0.25 nic
nic
0.25 ± 0.25 nic
Bt cotton
non Bt Cotton
Bt cotton
non Bt Cotton
0 (control)
Bt cotton
0.00 ± 0.00
Uppercase letters compare averages within each column. and lowercase letters compare averages within each row. Means followed by the same letters do not differ from
each other by overlapping confidence intervals generated by the quasi-Poisson model (P <0.05). nia = not incorporated in the analysis, because the absence of variability.
https://doi.org/10.1371/journal.pone.0249699.t002
PLOS ONE | https://doi.org/10.1371/journal.pone.0249699 April 8, 2021
8 / 15
�PLOS ONE
Electrophysiology of cotton under stress by aphid
interaction (P> 0.05) among the studied factors for the 1st and 2nd day and the accumulated
days of exposure of Bt and non-Bt cotton plants to aphids. The factor density [Fdensity = 2.29,
Pdensity = 0.1294 (1st day); Fdensity = 0.0070, Pdensity = 0.95 (2nd day); Fdensity = 0.1734, Pdensity =
0.6813 (cumulative total)], variety [Fvariety = 0.003, Pcultivate = 0.95 (1st day); Fvariety = 3.0896,
Pvariety = 0.07 (2nd day); Fvariety = 2.2726, Pvariety = 0.1466 (cumulative total)] and period [Fperiod = 1.3882, Pperiod = 0.2387 (1st day); Fperiod = 1.0805, Pperiod = 0.3679 (2nd day); Fperiod =
0.2966, Pperiod = 0.5918 (cumulative total)] did not affect the number of VPs emitted by cotton
plants.
There was an interaction between the factors: aphid density versus cotton variety versus
light/dark phase (F = 7.7295, P = 0.04150) for the number of VPs observed during the 3rd day
of exposure of Bt cotton plants and non-Bt to aphids. It was found that on the third day, there
was a higher VP production by non-Bt cotton plants exposed to 30 aphids/plant density than
Bt cotton plants exposed to the same density during the photophase (Table 2). In addition, VP
production by Bt and non-Bt cotton plants exposed to 60 and 30 aphids/plant, respectively,
was higher in the light phase than in the dark phase (Table 2).
Dispersal pattern of A. gossypii on Bt and non-Bt cotton plants
The behaviour of A. gossypii, independent of the factors: exposure time of plants to aphids,
aphid density or cotton variety, followed a highly within-plant aggregated distribution pattern
(k < 2) (Table 3, Fig 5A–5D).
Comparisons of the k index, based on confidence interval values, revealed that the highest k
index of aphid aggregation with 30 aphids/non-Bt cotton plants was found at 48 h and 72 h
after infestation of cotton plants with A. gossypii (Table 3). However, non-Bt cotton plants
exposed to that density had a lower aphid k aggregation index at 72 h of infestation in relation
to Bt cotton with 60 aphids/plant (Table 3).
The dispersal rate of A. gossypii was higher on Bt cotton with 60 aphids/plant than on nonBt cotton plants with 30 aphids/plant at 72 h (Table 3). In fact, according to the multinomial
distribution in the within-plant distribution of A. gossypii, it was confirmed that with 30
aphids/non-Bt cotton plants at 72 h, the highest proportions of aphids were on the adaxial
(0.18) and abaxial (0.49) regions of the leaf (leaf I); however, there was increased insect dispersal to other positions, such as leaf II, adjacent leaf I and main meristem (Fig 5A). On the
other hand, on Bt cotton plants infested with 60 aphids/plant, we observed the most dispersal
pattern with 72 h of infestation, where there was clearly an increased insect dispersal, with 0.16
and 0.41 of aphids found in the adaxial and abaxial regions of leaf I, respectively, and 0.20 in
the main meristem of the cotton plant.
Table 3. Confidence intervals associated with the A. gossypii aggregation index (95% CI) in Bt and non-Bt cotton
plants submitted to densities of 30 and 60 aphids/cotton plants quantified at 0. 24. 48 and 72 h after the infestation of cotton plants with aphids.
Density/Variety
Time (h)
0
24
48
72
30 aphids/non-Bt cotton/
0.42–0.52 A b
0.47–0.74 A ab
0.55–0.85 A a
0.58–0.77 B a
60 aphids/non-Bt cotton
0.45–0.73 A b
0.55–1.67 A ab
0.78–3.03 A a
0.67–1.48 AB ab
30 aphids/Bt cotton
0.45–1.16 A a
0.45–0.83 A a
0.57–0.87 A a
0.77–1.55 AB a
60 aphids/Bt cotton
0.42–0.90 A b
0.63–0.80 A b
0.70–1.05 A b
1.12–1.46 A a
Uppercase letters compare averages within each column. and lowercase letters compare averages within each row.
Means followed by the same letters do not differ from each other by overlapping confidence intervals generated by
Boostrap (P <0.05).
https://doi.org/10.1371/journal.pone.0249699.t003
PLOS ONE | https://doi.org/10.1371/journal.pone.0249699 April 8, 2021
9 / 15
�PLOS ONE
Electrophysiology of cotton under stress by aphid
Fig 5. Multinomial distribution with occurrence rate of A. gossypii in the regions of non-Bt and Bt cotton plants at infestation
times of 0 h, 24, 48 and 72 h with densities of 30 and 60 aphid/cotton plants. The red circle diameter represents the intensity of
aphid infestation on cotton plants.
https://doi.org/10.1371/journal.pone.0249699.g005
No significant difference was observed among the treatments within the infestation times
of 0 h, 24 h and 48 h in relation to the k index and multinomial distribution, except for the
treatment with 60 aphids/Bt cotton plants within 48 h, which showed the most dispersal
behaviour because it reached more regions of the cotton plants (Fig 5D).
In the comparisons of aggregation level among the time intervals within non-Bt cotton
exposed to 60 aphids/plant, we perceived that the highest k aggregation index was during the
infestation time of 48 h (Table 3). With Bt cotton plants at a density of 30 aphids/cotton plants,
it was found that there was no significant alterations in the aphid dispersal pattern at all time
intervals (Table 3).
Discussion
The results from our study showed that both cotton varieties (Bt and non-Bt), when attacked
by A. gossypii, emitted electrical signals of the variation potential type. Abiotic and biotic
wounds are perceived differently by plants, as has been shown by other studies on plant-herbivore interactions [6, 21, 22]. Insect damage in plants plays a vital role to recognize the type of
biotic stress to the plant [23, 24]. Plants differentiate herbivory from mechanical damage by
recognizing compounds present in insect saliva because oral secretion of herbivores can
induce ionic flux and promote depolarization of the plant membrane potential [25].
Here, in our research, it was possible to describe how Bt and non-Bt cotton plants react to
A. gossypii stress by changing the transmembrane potential by recording extracellular electrical
signals. Although plant responses to herbivorous attack are complex and involve a number of
signals, it is important to note that different types of stimuli caused by insect action against
plants trigger characteristic electrical signals evoked by plants with a specific influence on
PLOS ONE | https://doi.org/10.1371/journal.pone.0249699 April 8, 2021
10 / 15
�PLOS ONE
Electrophysiology of cotton under stress by aphid
plant physiological processes [26]. The cascade of events involved in plant signalling as a function of stress perception begins at the plasma membrane of cells with changes in transmembrane potential or ion flow; these are the first responses of plants to biotic and abiotic stresses
[27]. Attack on herbivorous plants is known to promote membrane potential changes that trigger an electrical signal that can travel to the entire plant or even trigger local plant defence
mechanisms [28].
Our results indicate the presence of VP on Bt and non-Bt cotton plants at all assessed interval times. An aphid continuously inserts its buccal apparatus into the phloem vessels, altering
the hydrostatic pressure in these vessels. VP is a signal whose propagation properties vary with
the intensity and distance of the stimulus site and is probably a local electrical response, which
is induced by a hydraulic signal, chemical signal or the combined action of these signals [29].
The hydraulic signal is a wave that results from increased hydraulic pressure in the plant,
which propagates through the xylem and initiates the generation of a VP by triggering
mechanosensitive ion channels present in the cells adjacent to the plant xylem vessels [30].
Therefore, harmful stimuli such as local damage, burning and mechanical injuries can evoke
VPs [31, 32]. These kinds of electrical signals emitted by plants when under stress are especially
important for hazard perception and response; thus, the plant can become able to mount an
appropriate defence response [33].
Distinct response patterns were attributed to the perception and response to A. gossypii by
each cotton variety and aphid density used in the research. Although we reported the first
emission of signals on Bt cotton plants, there was a delay in terms of the propagated signal
amount on Bt cotton plants with 60 aphids of infestation with A. gossypii, which produced the
smallest numbers of signals between 0 to 36 h. Another important result was the greater dispersal behaviour related to this same treatment, mainly during and after 48 h of infestation.
We suggest that the results could be supported by two hypotheses and explained independently or combined.
The first hypothesis is based on the possibility of a trade-off in terms of the defence of the
Bt plant; a high dispersal could mean a larger exploitation of food resources by aphids and ease
penetration of mouth apparatuses by aphids on Bt cotton plants, which may explain why Bt
cotton plants emitted faster electrical signals than non-Bt cotton plants in the first moment,
showing that Bt cotton plants may be more susceptible to aphid stress. Inducibility of a plant
stress response is the ability to respond to stress only on demand. This is a strategy that is considered cost-saving [34]. Therefore, this inducibility of plant defence may indicate a delay in
the operation of defensive mechanisms; or on the other hand, may also mean a strategy to save
energy and prevent self-poisoning [35], because it is possible that the Bt cotton plants may save
energy with less production of signal until 36 h and producing them later. Since induction of a
stress response implies that the plant starts activating resistance mechanisms upon encounter
with the stressor, this strategy may lead to delay in mounting an effective response [36, 37], a
first stress experience may prime the organism for an improved response to a subsequent
stress.
With an electrical penetration graph (EPG) used for monitoring the penetration of the
mouth apparatus by aphids on Bt and non-Bt plants and recording the waveforms that reflect
different aphid feeding activities, a lower percentage of waveform np (non-penetration) was
observed when the aphid was walking or grabbing the food with the rostrum on Bt cotton
plants [38]. This suggests that aphids spend less time finding suitable places for penetration of
their mouthparts on Bt cotton plants, probably due to the suitability of the tissue structure of
Bt cotton plants to feed these aphids [38].
The second hypothesis is that the higher aphid dispersal on Bt cotton plants may indicate
that the first signals emitted by the Bt cotton plants, even in smaller numbers than the non-Bt
PLOS ONE | https://doi.org/10.1371/journal.pone.0249699 April 8, 2021
11 / 15
�PLOS ONE
Electrophysiology of cotton under stress by aphid
cotton plants, were enough to activate the Bt cotton plants’ defence, which prevented or hindered aphid feeding, such as occlusion of phloem sieve elements (SEs), which are the main
conductive cells in the phloem, by clogging the sieved pores [39]. This is presumed to prevent
sap loss [40, 41], and this process is seen as a primary plant defence response [39]. At the same
time, the saliva constituents of sucking insects affect cellular processes [42] and therefore are
perceived by cells, leading to the activation of signalling mechanisms, supporting the supposition that local damage induces the propagation of a specific injury substance through the
xylem, and this induces the electrical response [43]. The main candidates for signalling molecules are H2O2 [44] systemin [45] jasmonic acid, abscisic acid, glutamate, among others. Both
H2O2 and glutamate may activate calcium permeable channels, increasing intracellular calcium concentrations in plants [46] and being an important trigger for the generation and
propagation of VP in plants [47].
The observed delay in the quantitative signalling pattern of Bt cotton plants when exposed
to 60 aphids/plant could be attributed to self-preservation under stress and may be supported
by the inclusion of resource reallocation for the production of metabolites and defensive structures (first and second hypotheses simultaneously). In the supplementary material, we show
that almost twice the amount of Cry1F protein was observed on Bt cotton plants in the presence of aphids than in the absence of the insect, this result may be related with the fact that Bt
cotton plants were faster to propagate VP signals. Well-known anti-herbivorous defence proteins include proteinase inhibitors (PIs) and polyphenol oxidases (PPOs), both of which are
considered to interfere with digestive processes in herbivore intestines [35]. Therefore, simultaneous resource reallocation can serve not only to save resources; thus, the plant can subsequently use them for growth and reproduction but also to deprive the herbivore of food and
consequently increase aphid dispersal, as observed in our results on Bt cotton with 60 aphids/
plant, in order to search for the available food source. These above-mentioned hypotheses generate a basis for further studies that seek to highlight what possible defence mechanisms are
involved and how effective they may be as a function of Bt and non-Bt cotton varieties.
In conclusion, the stress caused by the aphid A. gossypii was sufficient to trigger specific
responses on Bt and non-Bt plants. Bt cotton plants were faster to propagate VP signals; however, they produced the signals in a smaller quantity with the highest aphid density, also promoting greatest within-plant aphid dispersal. Our results may guide future studies, which aim
to elucidate the factors involved in the resistance to stress and plant defence processes and thus
assist in the development of successful strategies in integrated pest management.
Supporting information
S1 File.
(DOCX)
S1 Data.
(RAR)
Author Contributions
Conceptualization: Jéssica K. S. Pachú, José B. Malaquias, Flávia Pereira Franco.
Data curation: Jéssica K. S. Pachú, Francynes C. O. Macedo, Flávia Pereira Franco.
Formal analysis: Jéssica K. S. Pachú, Francisco S. Ramalho.
Investigation: Jéssica K. S. Pachú.
PLOS ONE | https://doi.org/10.1371/journal.pone.0249699 April 8, 2021
12 / 15
�PLOS ONE
Electrophysiology of cotton under stress by aphid
Methodology: Jéssica K. S. Pachú, Ricardo F. Oliveira.
Resources: Wesley A. C. Godoy.
Software: Jéssica K. S. Pachú.
Supervision: Jéssica K. S. Pachú.
Validation: Jéssica K. S. Pachú.
Visualization: Jéssica K. S. Pachú.
Writing – original draft: Jéssica K. S. Pachú, Wesley A. C. Godoy.
Writing – review & editing: Jéssica K. S. Pachú.
References
1.
Zebelo SA, Maffei ME. Role of early signalling events in plant–insect interactions. Journal of Experimental Botany 2015; 66:435–448. https://doi.org/10.1093/jxb/eru480 PMID: 25429000
2.
Baluska F, Volkmann D, Menzel D. Plant synapses: actin-based domains for cell-to-cell communication.
Trends in Plant Science 2005; 10:106111. https://doi.org/10.1016/j.tplants.2005.01.002 PMID:
15749467
3.
Brenner ED, Stahlberg R, Mancuso S, Vivanco J, Baluska F, Van Volkenburg E. Plant neurobiology: an
integrated view of plant signaling. Trends in Plant Science 2006; 11:413–419. https://doi.org/10.1016/j.
tplants.2006.06.009 PMID: 16843034
4.
Pelagio-Flores R, Ortı́z-Castro R, Méndez-Bravo A, Macı́as-Rodriguez L, López-Bucio J. Serotonin, a
tryptophan-derived signal conserved in plants and animals, regulates root system architecture probably
acting as a natural auxin inhibitor in Arabidopsis thaliana. Plant and Cell Physiology 2011; 52:490–508.
https://doi.org/10.1093/pcp/pcr006 PMID: 21252298
5.
Maffei ME, Mithöfer A, Boland W. Before gene expression: early events in plant-insect interaction.
Trends Plant Science 2007; 12:310–316. https://doi.org/10.1016/j.tplants.2007.06.001 PMID:
17596996
6.
Pachu JKS, Macedo FCO, Silva FB, Malaquias JB, Ramalho FS, Oliveira RF, et al. Imidacloprid-mediated stress on non-Bt and Bt cotton, aphid and ladybug interaction: approaches based on fluorescence,
dark respiration and plant electrophysiology and insect behaviour. Chemosphere 2020; 10:127561.
https://doi.org/10.1016/j.chemosphere.2020.127561 PMID: 33296994
7.
Maffei M, Bossi S, Spiteller D, Mithofer A, Boland W. Effects of feeding Spodoptera littoralis on lima
bean leaves. I. Membrane potentials, intracellular calcium variations, oral secretions, and regurgitate
components. Plant of Physiology 2004; 134:1752–1762.
8.
Malaquias JB, Ramalho F, dos S. Dias C, Brugger B, Lira A, Wilcken C, et al. Multivariate approach to
quantitative analysis of Aphis gossypii Glover (Hemiptera: Aphididae) and their natural enemy populations at different cotton spacings. Scientific Reports 2017a; https://doi.org/10.1038/srep41740
9.
Malaquias JB, Godoy WAC, Garcia AG, Ramalho FDS, Omoto C. Larval dispersal of Spodoptera frugiperda strains on Bt cotton: a model for understanding resistance evolution and consequences for its
management. Scientific Reports 2017b; 7:1–10
10.
Malaquias JB, Caprio MA, Godoy WAC, Omoto C, Ramalho FS, Pachú JKS. Experimental and theoretical landscape influences on Spodoptera frugiperda movement and resistance evolution in contaminated refuge areas of Bt cotton. Journal of Pest Science 2020; 93:329–340
11.
Hagenbucher S, Wackers FL, Wettstein FE, Olson DM, Ruberson JR. (2013) Pest trade-offs in technology: reduced damage by caterpillars in Bt cotton benefits aphids. Proceedings of the Royal Society B:
Biological Sciences 280; https://doi.org/10.1098/rspb.2013.0042 PMID: 23486438
12.
Pachú JK, Macedo FC, da Silva FB, Malaquias JB, Ramalho FS, Oliveira RF, et al. Imidacloprid-mediated stress on non-Bt and Bt cotton, aphid and ladybug interaction: Approaches based on insect behaviour, fluorescence, dark respiration and plant electrophysiology. Chemosphere 2021; 263, https://doi.
org/10.1016/j.chemosphere.2020.127561 PMID: 33296994
13.
Macedo FDCO, Daneluzzi GS, Capelin D, da Silva Barbosa F, da Silva AR, de Oliveira RF. Equipment
and protocol for measurement of extracellular electrical signals, gas exchange and turgor pressure in
plants. MethodsX 2021; 101214, https://doi.org/10.1016/j.molmet.2021.101214 PMID: 33741533
PLOS ONE | https://doi.org/10.1371/journal.pone.0249699 April 8, 2021
13 / 15
�PLOS ONE
Electrophysiology of cotton under stress by aphid
14.
Lautner S, Grams TE, Matyssek R, Fromm J. Characteristics of electrical signals in poplar and
responses in photosynthesis. Plant of Physiology 2005; 138, 2200–2209. https://doi.org/10.1104/pp.
105.064196 PMID: 16040648
15.
Stahlberg R, Cleland RE, Van Volkenburgh E. Slow wave potentials–a propagating electrical signal
unique to higher plants. In: Baluska F, Mancuso S, Volkmann D (eds) Communications in plants. 2006.
16.
Zawadzki T, Dziubinska H, Davies H. Characteristics of action potentials generated spontaneously in
Helianthus annuus. Physiologia Plantarum 1995; 93:291–297.
17.
Moral RA, Hinde J, Demétrio CGB. “Half-Normal Plots and Overdispersed Models in R: The hnp Package. Journal of Statistical Software 2017; 81:1–23.
18.
Canty A, Ripley B. boot: Bootstrap R (S-Plus) Functions. R package version 1. 2019;3–22.
19.
Venables WN, Ripley BD. Modern Applied Statistics with S. Fourth Edition. Springer, New York. ISBN
0-387-95457-0. 2002.
20.
Russell L. emmeans: Estimated Marginal Means, aka Least-Squares Means. R package version 1.4.5.
2020; https://CRAN.R-project.org/package=emmeans
21.
Mithofer A, Boland W, Maffei ME. Chemical ecology of plant-insect interactions. In: Parker J (ed) Molecular aspects of plant disease resistance. Wiley-Blackwell, Chirchester. 2009a.
22.
Bricchi I, Leitner M, Foti M, Mithöfer A, Boland W, Maffei ME. Robotic mechanical wounding (MecWorm) versus herbivore-induced responses: early signaling and volatile emission in Lima bean (Phaseolus lunatus L.) Planta 2010; 232:719–729 https://doi.org/10.1007/s00425-010-1203-0 PMID:
20563731
23.
Wu J, Baldwin IT. (2010) New insights into plants responses to the attack from insect herbivores.
Annual Review of Genetics 2010; 44:1–24. https://doi.org/10.1146/annurev-genet-102209-163500
PMID: 20649414
24.
Bonaventure G, VanDoorn A, Baldwin IT. Herbivore-associated elicitors: FAC signaling and metabolism. Trends in Plant Science 2011; 16:294–299. https://doi.org/10.1016/j.tplants.2011.01.006 PMID:
21354852
25.
Maischak H, Grigoriev PA, Vogel H, Boland W, Mithofer A. Oral secretions from herbivorous lepidopteran larvae exhibit ion channel-forming activities. 2007; https://doi.org/10.1016/j.febslet.2007.01.067
PMID: 17292890
26.
Gallé A, Lautner S, Flexas J, Fromm J. Environmental stimuli and physiological responses: The current
view on electrical signalling. Environmental and Experimental Botany 2015; 114:15–21.
27.
Shabala S. Non-invasive microelectrode ion flux measurements in plant stress physiology. In Plant
Electrophysiology–Theory and Methods (Volkov A., ed.), pp. 35–71, Springer-Verlag. 2006.
28.
Ebel J, Mithofer A. Early events in the elicitation of plant defence. Planta 1998; 206:335–348.
29.
Vodeneev V, Mudrilov M, Akinchits E, Balalaeva I, Sukhov V. Parameters of electrical signals and photosynthetic responses induced by them in pea seedlings depend on the nature of stimulus. Functional
Plant Biology 2018; 45:160e170. https://doi.org/10.1071/FP16342 PMID: 32291030
30.
Dziubinska H, Trebacz K, Zawadzki T. Transmission route for action potentials and variation potentials
in Helianthus annuus L. Journal of Plant Physiol 2001; 158:1167–1172.
31.
Dziubinska H, Filek M, Koscielniak J, Trebacz K. Variation and action potentials evoked by thermal stimuli accompany enhancement of ethylene emission in distant non-stimulated leaves of Vicia faba minor
seedlings. Journal of Plant Physiology 2003; 160:1203–1210. https://doi.org/10.1078/0176-161700914 PMID: 14610889
32.
Zimmermann MR, Maischak H, Mithoefer A, Boland W, Felle HH. System potentials, a novel electrical
long distance apoplastic signal in plants, induced by wounding. Plant of Physiology 2009; 149:1593–
600. https://doi.org/10.1104/pp.108.133884 PMID: 19129416
33.
Davies E, Stankovic B. Electrical signals, the cytoskeleton and gene expression: a hypothesis on the
coherence of the cellular responses to environmental insult. In: Baluska F, Mancuso S, Volkmann D.
(Eds.), Communication in Plants. Springer, Berlin, Heidelberg, New York, pp. 309–320. 2006.
34.
Hilker M, Schmülling T. Stress priming, memory, and signalling in plants. Physiologia Plantarum 2019;
42:753–761.
35.
Zhu-Salzman K, Luthe DS, Felton GW. Arthropod-inducible proteins: broad spectrum defenses against
multiple herbivores. Plant of Physiology 2008; 146:852–858. https://doi.org/10.1104/pp.107.112177
PMID: 18316640
36.
Hilker M, Schwachtje J, Baier M, Balazadeh S., Bäurle I, Geiselhardt S, et al. Priming and memory of
stress responses in organ-isms lacking a nervous system. Biological Reviews 2016; 91:1118–1133
PLOS ONE | https://doi.org/10.1371/journal.pone.0249699 April 8, 2021
14 / 15
�PLOS ONE
Electrophysiology of cotton under stress by aphid
37.
Martinez-Medina A, Flors V, Hei M, Mauch-Mani B, Pieterse CM J., Ton J, . . . et al. Recognizing plant
defense priming. Trends in Plant Science 2016; 21:818–822 https://doi.org/10.1016/j.tplants.2016.07.
009 PMID: 27507609
38.
Liu XD, Zhai BP, Zhang XX, Zong JM. Impact of transgenic cotton plants on a non-target pest, Aphis
gossypii Glover. Ecological Entomology 2005; 30:307–315.
39.
Knoblauch M, van Bel AJE. Sieve tubes in action. Plant Cell 1998; 10, 35–50.
40.
Evert RF. Sieve-tube structure in relation to function. Bioscience 1982; 32, 789–795
41.
Schulz A. The phloem. Structure related to function. Progress in Botany 1998; 59,429–475
42.
Backus EA, Serrano MS, Ranger CM. Mechanisms of hopper burn: an overview of insect taxonomy,
behavior, and physiology. Annual Review of Entomology 2005; 50, 125–151. https://doi.org/10.1146/
annurev.ento.49.061802.123310 PMID: 15471532
43.
Vodeneev V, Akinchits E, Sukhov V. Variation potential in higher plants: mechanisms of generation and
propagation. Plant Signaling & Behavior 2015; 10: https://doi.org/10.1080/15592324.2015.1057365
PMID: 26313506
44.
Demidchik V, Shabala S. Mechanisms of cytosolic calcium elevation in plants: the role of ion channels,
calcium extrusion systems and NADPH oxidase-mediated ‘ROS-Ca2þHub’. Functional Plant Biology
2018; 45: https://doi.org/10.1071/FP16420.
45.
Pearce G, Strydom D, Johnson S, Ryan CA. A polypeptide from tomato leaves induces wound-inducible
proteinase inhibitor proteins. Science 1991; 253:895–898. https://doi.org/10.1126/science.253.5022.
895 PMID: 17751827
46.
Toyota M, Spencer D, Sawai-Toyota S, Jiaqi W, Zhang T, Koo AJ, et al. Glutamate triggers long-distance, calcium-based plant defense signaling. Science 2018; 361:1112e1115. https://doi.org/10.1126/
science.aat7744 PMID: 30213912
47.
Mousavi SA, Chauvin A, Pascaud F, Kellenberger S, Farmer EE. Gluta-mate receptor-like genes mediate leaf-to-leaf wound signalling. Nature 2013; 500:422e426. https://doi.org/10.1038/nature12478.
PLOS ONE | https://doi.org/10.1371/journal.pone.0249699 April 8, 2021
15 / 15
�
 Wesley Godoy