ThE FlagShIp RESEaRCh JouRnal oF InTERnaTIonal ConFEREnCE
oF ThE pRoduCTIon and opERaTIonS ManagEMEnT SoCIETy
Volume • Number
• July - December
Importance and the Zone of Tolerance of Customer
Expectations of Fast Food Services
Domingos Fernandes Campos
UniversidadePotiguar
domingos_campos@uol.com.br
Kleber Cavalcanti Nóbrega
UniversidadePotiguar
klebercn@unp.br
AbstrACt This article analyzes the relationship between the importance of atributes for service quality and the tolerance zone between the desired and the minimum acceptable levels for customer expectations. The empirical study,
conducted with
students, fast food customers, conirms that, as the importance of atributes increases, the tolerance
zone gets closer and higher.
1. InTRoduCTIon
Evaluations of service quality have pointed out limitations in the accurate measuring of customer perceptions due to the following factors customer perception
variability (PArAsUrAMAN et al,
”ROWN,
CHIOU et al,
, and imprecise scales Y“NG
et al,
”EH“R“ et al,
DENG,
. The
service operations, which include characteristics such
as heterogeneity, intangibility, production-consumption simultaneity, and customer presence, increase
the need for precise instruments to identify service
atributes, as well as the evaluation of the quality of
services rendered GR5NROOS,
N2”REG“,
LOVELOCK,
FITZSIMMONS,
.
Zeithaml et al
recognize the existence of a zone
of tolerance between desired service and adequate
service. In this tolerance zone, the authors defend two
hypotheses irst, the most important atributes for customers have narrower tolerance zones second, they
also have expectation limits closer to the maximum of
the scale used. “lthough these propositions by the authors represent an important contribution, they result
from theoretical analysis, supported by focus group
research. The authors suggest, indeed, more research
in order to operationalize these domains.
Other authors dealed with the problem of tolerance
zone JOHNSTON,
WIRTZ and M“TTIL“,
Y“P and SWEENEY,
N“DIRI,
C“V“N“ and COR”ETT,
“HMED,
, but
there seems to have few empirical contributions on
Zeithaml et al prior propositions. The objective of
the present study is to evaluate these two hypotheses defended, using fast food services in a shopping
center as the object of study, and based a sample of
responses by
university students. The research
also allows us to identify the main atributes of fast
food service for the customers studied.
For the purpose of this research, the deinition of
“fast food” adopted was: commercial establishments that sell food and drink for immediate consumption in the locale or surrounding locale, which
shares space with other fast food companies, or for
consumption in any locale, usually specializing in
pizza, sandwiches and chicken based foods GOY“L and SINGH,
. The fast food products are
distinguished from others in function of the following characteristics being low priced, served quickly,
usually eaten with the hands, easily packaged, and
having a short shelf life PRICE,
.
2. pRECuRSoRS
The idea of comparing the expected quality with the
quality experienced, align with the vision of service
quality as the relationship between perception and
Campos, D. F., Nóbrega, K. C.: Importance and the Zone of Tolerance of Customer Expectations of Fast Food Services
Journal of Operations and Supply Chain Management 2 (2), pp 56 - 71, C International Conference of the Production and Operations Management Society
expectations about services ofered P“R“SUR“MAN et al,
, CRONIN and T“YLOR,
.
The work of Parasuraman et al represent a peak in
the understanding of service quality as the comparison, by the customer, of his expectations with
the perception of services rendered. Even though
intangibility in the services and subjectivity present
diiculties, one can still look for service speciication in the operational and measureable atributes.
Grönroos
proposed to systematize the perceptions of customers about service in seven characteristics professionalism and capacity, atitudes
and behavior, accessibility and lexibility, reliability
and integrity, recuperation of service, panorama of
service, and inally, reputation and credibility. Later,
Parasuraman et al
developed the SERVQU“L
scale and condensed the determinants of quality into
ive dimensions tangible aspects, reliability, responsiveness, safety and empathy.
Some studies about service quality, speciically in relation to fast food, contributed to the present study.
Mersha and “dlakaha
in research with
M”“ students in the US“, brought to light the importance of atributes for some types of services, among
them fast food. The results indicated that the four
main factors are speed of service, interest in correcting errors, reasonable prices and a pleasing environment. Kara et al
completed a study about the
factors regarding the choice of a fast food restaurant
in the US“ and Canada. The data for this study were
collected through
self-administered questionnaires, which had been distributed to
households
in the US“ and in Canada. In the US“, regular customers mainly value factors such as variety, speed,
and friendly staf, while occasional customers favor
price and promotions. In Canada, regular customers
prioritize convenience of location and availability of
nutritional information, while occasional customers
favored price, location and novelties.
”rady and Robertson
investigated
fast food
consumers in Ecuador and US“. They found results
indicating more afectively-orientation in Ecuadorian costumers, while US“ ones prioritize cognitive
processes, looking like a more professional perception of service value. Gupta and Chen
used a
Likert points scale in fast food context to prioritize
SERVQU“L dimensions. The respondents, classiied,
in a decreasing scale of importance reliability, assurance, tangibles, responsiveness and empathy.
Diferently, Johnson and Mathews
, when using SERVQU“L scale to survey about should and
57
wills fast food customers expectations, did not ind
reliability as the most important dimension, but security. “ccess appears as the highest will expectation.
They surveyed
business school undergraduate
students in England. Lee and Ugaldo
completed research in the US“ and South Korea, with
the intention of identifying the cultural implications
in the evaluation of fast food services, using questionnaires based on SERVQU“L. The data collected
together with the students in administration courses
in the two countries showed higher expectations for
the Koreans than for the North “merican students
notably in relation to physical aspects, reliability,
guarantee and low prices.
For Liu and Chen
, social surroundings greatly afected the importance of good value for money,
food taste/lavor, variety of food oferings, music and
noise level, atractive décor, atmosphere and ambience, friendly and pleasant staf, and cleanliness
and neatness. The common tendency is an increase
in the importance of these variables as the situation
changes from alone, to with friends and highest if
with clients. Law et al
surveyed eight quality
factors afecting customer satisfaction. They found
results indicating that waiting time and other service factors such as staf atitude, environment, seat
availability and food quality signiicantly inluence
the customers’ return frequency.
Gilbert et al
surveyed ,
fast food customers
in a cross-cultural comparison evolving ive globallyfranchised fast-food chains in four countries - Jamaica, Scotland, US“ and Wales. “cademicians of these
four countries trained graduate and undergraduate students to administer the customer satisfaction
survey. ”aek, Ham and Yang
surveyed
korean students, and
ilipino students, in order
to identify the importance of atributes in the selection of fast food restaurants. Koreans and ilipinos
viewed menu price as the most important atribute.
The following atributes, in Korea, were brand, food
related factors and service- and hygiene-related factors. In Philippines, the subsequent atributes were
food-related factors, service- and hygiene-related
factors and brand.
In a study completed with
consumers from a fast
food chain in ”razil, Machado et al
found that
the atributes with the highest levels of expectation
were polite staf, well prepared and cooked food,
and eicient supply of supplements, adequate product temperature, tables cleared and cleaned quickly,
and a well dressed staf. Goyal and Singh
con-
Campos, D. F., Nóbrega, K. C.: Importance and the Zone of Tolerance of Customer Expectations of Fast Food Services
58
Journal of Operations and Supply Chain Management 2 (2), pp 56 - 71, C International Conference of the Production and Operations Management Society
ducted research about fast food in India, consulting
university students, having as its objective the
identiication of factors that inluence them in the
choice of a restaurant, they found the following hierarchy variety, quality and lavor of the food, environment and hygiene, speed, price and location.
Qin and Prybutok
investigated the relationship among service quality, food quality, perceived
value, customer satisfaction and behavioral intentions in fast-food restaurants. They surveyed
US“ college students in US“. The results indicated
that reliability/responsiveness, tangibles, assurance,
and recovery are slightly more important than empathy. Fresh, tasty, and a variety of food and beverages remains are considered to be important criterion for satisfying customers. In this way, the model
by Liljander and Strandvik
introduces the relation among the acts of service and relationships.
In a broadening spectrum, acts comprise episodes,
which establish sequences that generate relationships. Thus, each act of service is relevant to the formation of customer perception about service. These
episodes are also called the service encounters, service contacts, or moments of truth NORM“NN,
ZEITH“ML and ”ITNER,
FITZSIMMONS,
.
The importance of service contacts derives, above
all, the presence of customers and the service production-consumption simultaneity. The quality of
the service is perceived in service contacts, having
been created in the moment of or beforehand. ”itner
et al
defend that service contacts provoke the
consumer to evaluate the level of service provided
by the organization, by its staf and even interactions with other customers during a certain period
of time. For ”itner and ”rown
and Harris et al
, the inluence of service contacts can be divided in two main components: personal interactions
with the service provider, and with the physical environment of the organization. The expectations and
the quality of service are inluenced by some aspects
present in the service contacts décor, smell, design,
and music COX et al,
COYE,
. Keng et al
, when investigating the impacts of service en-
counters on customer experiential value in a shopping mall, in Taiwan, registered that service contacts
and the value the customer gives of the experience
have been studied separately, and they completed
a study integrating service contacts, the consumer
experience, and the behavior intentions of the consumer in the context of a shopping center.
3. METhodology
The classic work of Zeithaml et al
, in response
to the criticism about the use of SERVQU“L methodology, recognizes the limitation of evaluating the
necessities for a single value. Thus, the expectations
in relation to service can be represented by a strip or
zone of tolerance. These expectations vary according to the atributes evaluated and would be diferent from customer to customer. The authors point to
limits of the tolerance with regard to service desired
SD and adequate or minimum service SM . The
irst represents the level of the service provided that
the customer would like to receive the second relects the minimum level of service that the customer
would tolerate. Inside these limits, in the perception
of the customer, a comfort zone is established for the
receipt of service.
The tolerance zone can be established by the customer expectations for a determined service atribute, even if it is not delivered. When the service
rendered efectively occurs, the customer evaluates
the level of service received/perceived, through his
or her own perceptions. The present construct being deined proposes to evaluate two airmations
of Zeithaml and ”itner
. In the irst, customers
airm a narrower zone of tolerance for those atributes that they ind more important. That is to say,
the more important the atribute to the customer,
the closer the limits SD and SM will be. Second, the
customers airm higher limits of tolerance for more
important atributes. Thus, the more important the
atribute, the closer SD and SM will be to the higher
limit of the evaluation scale used. Figure illustrates these precepts of the authors, evaluated in this
study, which can be established according to the following hypothesis.
Campos, D. F., Nóbrega, K. C.: Importance and the Zone of Tolerance of Customer Expectations of Fast Food Services
Journal of Operations and Supply Chain Management 2 (2), pp 56 - 71, C International Conference of the Production and Operations Management Society
59
Figure 1 – Relation between importance and expectations.
Source: adapted from Zeithaml and Bitner (2003)
H “tributes that are more important to customers
have a narrower zone of tolerance.
H “tributes that are more important to clients
have limits of expectations closer to the maximum
utilized on the scale.
4. MEaSuRIng ThE IMpoRTanCE oF ExpECTaTIonS
On the one hand, the degree of the importance of the
atributes can be found from the accurate measurement as expressed by the user. The tolerance zone
height (Alt Z , with a relative position in relation to
the expectation scale, can be calculated by its average point, i.e., the average between the values of the
desired service (SD and the minimum service SM
for each atribute. On the other hand, the width of the
tolerance zone (Larg Z of an atribute corresponds
to the diference between the level of desired service
and the level of minimum service. “lgebraically, for a
sample size n, the average values are determined by
5. FaST Food RESTauRanTS
The evaluation of the hypothesis was based on the
services ofered in fast food restaurants in the commercial and entertainment center located in the city of
Natal, ”razil. The shopping center is
,
m , parking for ,
vehicles, anchor stores, supermarket
and
satellite stores. It hosts a cinema complex
with seven screening rooms. There are restaurants.
Sixteen of them it into the deinition of fast food and
ofer cuisine varying from conventional sandwiches
to traditional Italian and Japanese dishes. There are
local companies and franchises linked to national and
international chains present all over the nation.
6. MappIng ThE SERvICE CyClE and ThE aTTRIBuTES lIST
Mapping the service cycle helps to identify and discover all of the important processes of an activity. Regarding an activity with high user contact, the service
cycle analysis of fast food, from the customer’s arrival
to his or her departure, presents a set of atributes at
each step in the process. For the mapping and analysis
of the activities, the authors used direct observation
and tried various restaurants listed, as well as used
literature basis NICK and HOW“RD,
”OJ“NIC,
”OUR“NT“ et al,
. Figure shows the
most important stages in the fast food service cycle.
Campos, D. F., Nóbrega, K. C.: Importance and the Zone of Tolerance of Customer Expectations of Fast Food Services
60
Journal of Operations and Supply Chain Management 2 (2), pp 56 - 71, C International Conference of the Production and Operations Management Society
Figure 2 - Typical fast food service cycle.
Source: research
For each activity in the service cycle, the atributes that the authors found relevant were listed, without any
previous screening. Supported by atributes present in the studies shown in Table , a set of variables was
consolidated and systematized. The consolidation relects an articulation between the analysis of the service
cycle and the moments of truth.
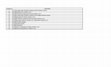
Table
Sources of questionnaire atributes.
Author
Mersha and Adlakha (1992)
Gupta and Chen (1995)
Kara, Kaynak and Kucukemiroglu (1995)
Johnson and Mathews
(1997)
Tangibles, reliability,
responsiveness, credibility,
competence, courtesy,
communication, access, knowing
the customer, recovery, security –
Servqual, Likert 11 points
Lee and Ulgado(1997) Tangibles, reliability,
responsiveness, assurance, empathy,
price, service time, location –
Servqual, Likert 9 points
Brady and Robertson Sacriice, overall service quality,
(1999)
service value,
behavioural intentions –
No servqual, Likert, 9 points
Dimension/Attribute – Model/
Scale
Reliability, responsiveness,
assurance, empathy,
service time, value, ambience –
No servqual, Likert 5 points
Tangibles, reliability,
responsiveness, assurance,
empathy - Servqual, Likert 7
points
Empathy, price, service time,
convenience, hygiene, novelties
for children –
No servqual, Likert, 5 points
England (389)
11
Korea (89), USA (104)
26
Ecuador (116), USA (309)
12
Country (Sample)
Number of variables
USA (316)
12
USA (65)
22
Canada (141), USA
(179
11
Campos, D. F., Nóbrega, K. C.: Importance and the Zone of Tolerance of Customer Expectations of Fast Food Services
Journal of Operations and Supply Chain Management 2 (2), pp 56 - 71, C International Conference of the Production and Operations Management Society
Liu and Chen (2000)
Speed service, food, price,
ambience, variety, music and noise,
promotional items –
No servqual, no Likert
food, price, variety, ambience,
service time –
No servqual, Likert 5 points
Reliability, responsiveness,
assurance, empathy, price, service
time - No servqual, Likert 5 points
Brand, price, food, service and
hygiene –
No servqual, no Likert
Tangibles, reliability,
responsiveness, assurance, empathy,
food - Servqual, Likert 7 points
Variety, food , ambience and
hygiene, price, location - No
servqual, Likert 5 points
Food, service, perceived value –
Servperf, Likert 7 points
Law et al (2004)
Gilbert et al (2004)
Baek, Ham and Yang
(2006)
Machado et al (2006)
Goyal and Singh
(2007)
Qin and Prybutok
(2009)
61
Philippines (1365)
10
Hong Kong (106)
8
Jamaica (1581), USA (2399)
Scotland (585), Wales (571)
17
Korea (303)
Philippines (2329)
12
Brazil (120)
20
India (171)
7
USA (282)
40
Source: research
Table presents the atributes related to each activity in the cycle. The column to the right relects the framing of each atribute according to the dimensions established by Parasuraman et al
. The asterisk * on
some of the atributes indicates that this same atribute can be perceived, also, in other steps in the cycle.
Table
STAGES
Arrival/
Approach
Wait in line
Attendance with the
receptionist
Atributes identiied from the typical fast food service cycle.
ATTRIBUTE
• Visual attractiveness of the store
• Brand strength (recognition and trust in the brand)
• Level of frequency (regular or occasional frequency)
• Location in relation to the food court
• Availabilty of lunches and dishes, promotions *
• Availability of visual information about products *
• Availabilityof the entire menu of products
• Clear indication of locations of attendance
• Presence of an assistant receptionist in the external area
• Hygiene of the installations *
• Wait time in line until being attended at the cashier *
• Readiness of the receptionist (ready disposition for attendance)
• Courtesy and attendance of the receptionist
• Presentation of the receptionist (posture and appearance)
• Receptionists knowledge about products and procedures
• Possibility of adding extra ingredients to the lunches*
• Incorporation of new lunches/dishes to the menu
DIMENSION
Tangible
Assurance
Assurance
Tangible
Empathy
Empathy
Responsiveness
Tangible
Response
Assurance
Responsiveness
Responsiveness
Empathy
Tangible
Assurance
Responsiveness
Responsiveness
Campos, D. F., Nóbrega, K. C.: Importance and the Zone of Tolerance of Customer Expectations of Fast Food Services
62
Journal of Operations and Supply Chain Management 2 (2), pp 56 - 71, C International Conference of the Production and Operations Management Society
STAGES
Attendance at the cashier
Wait at the counter
Receive Order
Food Consumption
ATTRIBUTE
• Cashier readiness (ready disposition to attend to customers)
• Cashier presentation (posture and appearance)
• Courtesy and attentiveness at the cashier
• Cashier`s knowledge about products and procedures
• Form /terms of payment
• Order completed as asked (without errors)
• Price charged according to advertised
• Food price charged *
• Time spent being attended at the cashier
• Availability of change
• Distribution of complimentary gifts to children *
• Availabilityof waiting space at the counter
• Order of attendance panel
• Hygiene, preparation and handling of food *
• Wait time to receive food
• Food delivered as ordered (type x quantity)
• Availabilityof free additional sauces/seasonings *
• Availabilityof wait staff to bring food to tables
• Use of recyclable packaging *
• Regularity of the quality of food served
• Flavor of food served
• Texture and cooking of the food served
• Visual attractiveness of food served
• Aroma of food served
• Temperature of food served
• Quality of ingredients of food served
• Fat and calorie content of food served
• Availability of information on fat and calorie content *
DIMENSION
Responsiveness
Tangible
Empathy
Assurance
Response
Reliability
Reliability
Others
Responsiveness
Responsiveness
Empathy
Responsiveness
Tangible
Assurance
Responsiveness
Reliability
Responsiveness
Responsiveness
Assurance
Reliability
Reliability
Reliability
Reliability
Reliability
Reliability
Reliability
Reliability
Empathy
Source: research
7. QuESTIonnaIRE
The objectives of this research required that the
perceptions of users regarding the importance of
atributes and their expectations in relation to levels of desired service and the minimum acceptable
service were found. The questionnaire was composed of three modules. In the irst, questions are
related to the socioeconomic proile of the respondents, their motivations, hours and frequency of use
of the restaurants. The questionnaires were applied
by students who participate in projects of scientiic
research in the University. The research coordinator trained these researchers, and some simulations
were conducted at irst. “t the moment of the con-
tact, the potential respondents were initially asked
about their availability to answer the questions, as
well as their frequency of using fast food restaurants. ”ased on a list of fast food restaurants present
in the shopping center, the respondents were asked
to mark those that they most frequented.
The questions relative to the questionnaire did not
follow SERVQU“L model. In the second module,
they were writen in the form of a question what
importance do you give to the hygiene, preparation and
handling of food? In the third module, the questions
were constructed in the form of an imperative on the
scale, mark the value that best represents your expectation
about the minimum level of quality that you would accept
Campos, D. F., Nóbrega, K. C.: Importance and the Zone of Tolerance of Customer Expectations of Fast Food Services
Journal of Operations and Supply Chain Management 2 (2), pp 56 - 71, C International Conference of the Production and Operations Management Society
for the service of a fast food restaurant in the atributes of
hygiene, preparation and handling of food.
In the second module, respondents manifested their
perceptions about the degree of importance of each
one of the
atributes presented in relation to the
choice of a fast food restaurant in the shopping center. The responses were marked in a Likert scale of
points, varying from zero not important to ten
very important . In the third module, the expectations of the respondents regarding each of the
attributes used in the irst module were found. Each
respondent revealed his or her expectations about
the level of quality that they would like to receive
(desired level and the minimum level of quality that
would be acceptable minimum level acceptable .
The expectations were also found and measured by
a Likert scale of points, varying from zero worse
to ten excellent .
Once the atributes were identiied using service cycle methodology, supported by fast food literature
references, it was considered unnecessary a deep
research aiming to validate the questionnaire. “lthough, a pre-test was completed with ten university students who frequented some of the fast food
restaurants in the period of thirty days before that of
the application. Small adjustments were made in the
language, and formating was necessary, in order to
facilitate comprehension.
63
.
inhabitants. Respondents’ choices were not
submited to pre-planned criteria of sample stratiication. Questionnaires were applied, for convenience, to the students present on campus and who
volunteered to respond.
The application was only completed with the university students who customarily frequented some
fast food restaurants on the list of restaurants in the
shopping center. The use of a group of university
students as a sample is convenient from the point
of view of their homogeneity young people with
values associated with those held by fast food service providers, regarding eicient service, and also
university students being in a category of subjects
with formal education, and a sharpened critical
sense JOHNSON and M“THEWS,
LEE and
UG“LDO,
NILSSON-WITELL and FUNDIN,
M“CH“DO et al,
QIN and PRY”UTOK,
. Most likely, people of diferent social status,
ages and backgrounds, would present diferent hierarchies of service atributes related to fast food.
However, the central objective of the study is not to
generalize the preferences observed in a sample of
the population, but to demonstrate that a hierarchy
of an atribute importance scale is compatible with
the position ranking and of the width of tolerance
zones found independently.
9. RESulTS
8. ThE SaMplE
The data were obtained using a sample of
students from a local private university. The interviews were completed on three diferent campuses
of the university. “lthough the three campus show
diferent distances from the shopping location, it
is believed the distance causes no inluence on results, once the studied shopping is the largest and
most frequented in Natal, a city with approximately
The results presented here relect the ascertainment
of
valid responses of
questionnaires applied,
representing a rate of . %. The statistical treatment
was completed using the Statistical Package for the
Social Sciences SPSS,
. version. “ccording to
the results presented in Table , the respondents are
largely female
. % , belonging to an age group
between
and
years old
% with a family
income in the range of R$
to R$ ,
. %.
“bout . % are exclusively students.
Table 3 – distribution of the respondents by sex, age, income and occupation.
Sex
Age
Family Income
Masculine
30.8%
Less than 18
1.8%
Feminine
69.2%
From 18 to 24
60.0%
From 25 to 35
31.9%
Less than
R$ 930
From R$ 930
to R$ 2,325
From R$ 2,325
to R$ 4,650
6.3%
Main Occupation
Student
36.7% Housewife
32.6%
Selfemployed
Professional
66.3%
0.7%
2.7%
Campos, D. F., Nóbrega, K. C.: Importance and the Zone of Tolerance of Customer Expectations of Fast Food Services
Journal of Operations and Supply Chain Management 2 (2), pp 56 - 71, C International Conference of the Production and Operations Management Society
64
Total
100%
More than
R$ 4,650
From 36 to 45
5.4%
More than 45
0.9%
Total
100%
24.4% Business owner
Total
100%
3.8%
Employee
26.5
Total
100%
Source: research
They customarily eat at fast food restaurants in the
shopping center at least once a month
. % . Entertainment is the main circumstance in use of fast
food services. “pproximately % of the respondents go only to eat in the fast food restaurants, or
they frequent them when they go to the cinema or
window-shopping. The majority
. % customarily frequents the restaurants during lunch or dinner
time, or between those meals. Table shows the details of the distribution of respondents according to
the variables presented.
Table 4 - distribution of the respondents by circumstance, frequency level and hour.
Circumstances under which fast
food is used
Work in or around the shopping
center
Shoppers who stop to eat fast food
%
Frequency with which
attend fast food rest.
7.0%
Less than once a month
%
Hours in which
fast food is used
%
15.8% Before lunch
1.6%
18.3% Once a month
16.1% Lunch
30.7%
Window shoppers who stop to eat
fast food
Movie goers who stop to eat fast
food
Those going to the bank or other
services who stop to eat fast food
46.8% Twice a month
30.3%
Between lunch
and dinner
12.0% Once a week
21.5% Dinner
22.2%
2.9%
More than once a week
16.3% After dinner
6.8%
Those who go speciically to eat
9.3%
Others
3.6%
Total
100%
Total
100%
100%
Total
38.7%
Source: research
10. ThE pERCEpTIon oF ThE IMpoRTanCE oF
aTTRIBuTES
the respondents indicated their perceptions relative to the importance of the atributes presented in
Table , atributing a note of zero not important to
very important to each one, in a sequential and
independent manner. The nominal measures obTable
Attribute
Food hygiene
tained varied from .
level of frequency to .
hygiene in preparation and food handling . “ preliminary analysis permited the assessment of what
the respondents considered which atributes presented were of average importance to very important. Table presents the median values obtained in
the degree of importance of the ten irst and ten last
established.
Degree of importance of the atributes from high to low.
Measu
rement
Rank
9.37
1
Attribute
Indication of attendance locale
Measu
rement
Rank
7.81
36
Campos, D. F., Nóbrega, K. C.: Importance and the Zone of Tolerance of Customer Expectations of Fast Food Services
Journal of Operations and Supply Chain Management 2 (2), pp 56 - 71, C International Conference of the Production and Operations Management Society
Attribute
Measu
rement
Rank
Installation hygiene
9.33
2
Food lavor
9.31
Food delivery with out errors
Attribute
65
Measu
rement
Rank
Location within the food court
7.65
37
3
Staff to bring food to the table
7.65
38
9.21
4
Additional ingredients
7.5 5
39
Correct price
9.19
5
Visible product information
7.52
40
Food texture
9.14
6
Visual attractiveness of store
7.51
41
Orders with out errors
9.10
7
Receptionist presence
7.27
42
Quality of the ingredients
9.09
8
Force of brand
7.02
43
Time oingredientsreceived
8.93
9
Freegifts to children
6.46
44
Temperatureofthefood
8.89
10
Leveloffrequency
6.08
45
MEASUREMENT = Arithmetic
measurement of the degree of
perceptions of importance of
attributes.
RANK = Ranking of the attributes
measured by importance.
Source: research
11. ExpECTaTIon TolERanCE ZonES
The same atributes that received an evaluation of
importance were presented to the respondents so
that they express their expectations in relation to
the levels of service desired and the minimum acceptable. Each atribute was associated to two equal
scales from
points, varying from zero the worst
to ten excellent level of service . In the irst, the respondent indicated the level of service desired (that
he or she would like to receive and the second, the
minimum acceptable level of service.
Table
For each atribute, using the algebraic expressions presented in section . , the width of the tolerance zone
LargZ and its height “ltZ were calculated. The
width of the tolerance zone varied from .
hygiene
in the preparation and handling of food to .
visual atractiveness of the store . On the other hand, the
height of the tolerance zone—taken by the position of
its median point varied in minimum from . level
of frequency to the maximum value of .
hygiene
in the preparation and handling of food . Table and
present the atributes with the greatest and the least
scores in width and height of the zone.
Atributes with width from the narrowest zone and the widest zone.
ATTRIBUTE
LargZ
RANK
ATTRIBUTE
LargZ
RANK
Food hygiene
1.38
1
Promotional lunches
2.00
36
Food lavor
1.45
2
Presence of the receptionist
2.02
37
Correct price
1.48
3
Indication of attendance area
2.03
38
Hygiene of the installations
1.50
4
Level of frequency
2.17
39
Food texture
1.51
5
Distribution of free gifts for kids
2.18
40
Delivery of food without errors
1.55
6
Visible product information
2.26
41
Food temperature
1.58
7
Menu variety
2.26
42
Campos, D. F., Nóbrega, K. C.: Importance and the Zone of Tolerance of Customer Expectations of Fast Food Services
66
Journal of Operations and Supply Chain Management 2 (2), pp 56 - 71, C International Conference of the Production and Operations Management Society
ATTRIBUTE
LargZ
RANK
ATTRIBUTE
LargZ
RANK
Quality of the ingredients
1.60
8
Additional ingredients
2.27
43
Aroma of the food
1.61
9
Force of the brand
2.35
44
Visual of the Food
1.62
10
Visual attractiveness of the store
2.50
45
Larg Z = Width of tolerance zone. RANK = Ranking of the attributes by the width of the tolerance zone.
Source: research
Table
Atributes with the median position of the highest and lowest zones.
ATTRIBUTE
Alt Z
RANK
Food hygiene
8.63
1
Food lavor
8.61
Correct Price
ATTRIBUTE
Alt Z
RANK
Menu variety
7.52
36
2
Fat/Calorie Information
7.49
37
8.60
3
Staff to bring food to the table
7.45
38
Hygiene of the installations
8.45
4
Presence of the receptionist
7.40
39
Food texture
8.45
5
Additional ingredients
7.39
40
Delivery of food without errors
8.45
6
Visible product information
7.38
41
Food temperature
8.43
7
Visual attractiveness of the store
7.31
42
Quality of the ingredients
8.43
8
Force of the brand
7.04
43
Aroma of the food
8.42
9
Distribution of free gifts for kids
6.83
44
Visual of the Food
8.40
10
Level of frequency
6.76
45
Alt Z = Median height of tolerance zone. Rank= Ranking of the attributes by the height of the tolerance zone.
Source: research
From these indings we can visually airm that
among the ten best located in the ranking, in the
three measurements, of the most common atributes were assigned as food hygiene, hygiene of the
installations, quality of the ingredients, delivery without
errors, correct price and lavor, texture and temperature
of the food. Such indings ofered, supericially, indications of the existence of a correlation between the
dimensions of the measurements used.
12. a CoMpaRISon oF ThE RankIng
Statistically it is possible to ind the degree of the correlation between the measurements used, comparing
it to the ranking generated by the three measurements
used, and verifying if there is alignment between them.
The alignment can then be found by the degree of the
correlation that exists between the three rankings,
compared two by two. “ coeicient of correlation of
. would indicate a degree of
% alignment, a coeficient . would indicate complete mis alignment.
Cooper and Schindler
point to the coeicients
of correlation of spearman and Kendall as the most
utilized for the comparison of series of ranked values. The test of Spearman’s correlation analyses the
residues through the diferences between the hierarchical positions of each variable. Spearman’s coeicient would be equivalent to that of Pearson, applied
to the rankings without, however, demanding the
normal conditions of the population and the linear
relation between the variables.
Table shows the comparison of the three rankings
obtained. The Spearman test revealed a high coeficient of correlation .
among the ranking by
the degree of importance conferred to the atributes
with the ranking obtained by the hierarchy of the
width of tolerance zones of the same atribute.
Campos, D. F., Nóbrega, K. C.: Importance and the Zone of Tolerance of Customer Expectations of Fast Food Services
Journal of Operations and Supply Chain Management 2 (2), pp 56 - 71, C International Conference of the Production and Operations Management Society
Table 8 –Comparison of the rankings obtained by the three measurements.
Attribute
Food hygiene
Hygiene of the installation
Food lavor
Delivery of food without errors
Correct prices
Food textures
Orders without errors
Quality of ingredients
Time it takes to receive food
Food temperature
Aroma of the food
Impor
tance
Rank
Width
of Zone
Rank
Height
of Zone
Rank
9.37
9.33
9.31
9.21
9.19
9.14
9.10
9.09
8.93
8.89
1
2
3
4
5
6
7
8
9
10
1.38
1.50
1.45
1.55
1.48
1.51
1.67
1.60
1.72
1.58
1
4
2
6
3
5
12
8
14
7
8.63
8.61
8.60
8.45
8.42
8.45
8.43
8.45
8.23
8.43
1
2
3
6
9
4
8
5
13
7
8.84
11
1.61
9
8.40
Food regularity
Visual of the Food
Price
Time at the cashier
Availability of change
Receptionist knowledge
Receptionist courtesy/attention
Cashier readiness
Cashier courtesy/attention
Wait time in line
Use of recycleable materials
Promotional lunches
Receptionist readiness
Receptionist presentation
Cashier knowledge
Order served signage
Fat/Calorie content
Form and time of payment
Cashier presentation
Incorporation of new lunches
Waiting space at the counter
Varied menu
Free additional seasonings
Fat/Calorie information
Indication of attendance areas
Location in the food court
8.81
8.76
8.70
8.68
8.67
8.64
8.63
8.51
8.49
8.46
8.44
8.39
8.33
8.26
8.25
8.22
8.17
8.14
8.13
8.11
8.03
7.87
7.85
7.84
7.81
7.65
10
12
13
14
15
16
17
18
19
20
21
22
23
24
25
26
27
28
29
30
31
32
33
34
35
36
37
1.64
1.62
1.85
1.80
1.69
1.81
1.84
1.90
1.82
1.96
1.87
2.00
1.89
1.84
1.86
1.89
1.99
1.89
1.87
1.97
1.95
2.26
1.94
1.90
2.03
1.88
11
10
20
15
13
16
18
28
17
32
22
36
27
19
21
25
35
26
23
33
31
42
30
29
38
24
8.23
8.36
7.85
8.04
8.25
7.97
7.93
8.01
7.90
7.95
7.85
7.92
7.84
7.72
7.99
7.74
7.65
7.87
7.85
7.69
7.88
7.52
7.75
7.49
7.55
7.72
14
11
26
15
12
18
20
16
22
19
25
21
28
32
17
30
34
24
27
33
23
36
29
37
35
31
67
Campos, D. F., Nóbrega, K. C.: Importance and the Zone of Tolerance of Customer Expectations of Fast Food Services
68
Journal of Operations and Supply Chain Management 2 (2), pp 56 - 71, C International Conference of the Production and Operations Management Society
Attribute
Staff to bring food to the table
Additional extra ingredients
Visible product information
Visual attractiveness of the store
Receptionist presence
Force of the brand
Distribution of free gifts for kids
Level of frequency
Impor
tance
Rank
Width
of Zone
Rank
Height
of Zone
Rank
7.65
7.55
7.52
7.51
7.27
7.02
6.46
6.08
38
39
40
41
42
43
44
45
1.97
2.27
2.26
2.50
2.02
2.35
2.18
2.17
34
43
41
45
37
44
40
39
7.45
7.39
7.38
7.31
7.40
7.04
6.83
6.76
38
40
41
42
39
43
44
45
Source: research
In comparison of the ranking by the degree of importance with the ranking obtained by the hierarchy of the
heights of the tolerances zones, the coeicient of correlation was still greater, with the value of . . The coeficients are signiicant to α = . .
Table 9
Coeiecient of the correlations obtained by the Spearman and Pearson Tests.
Ranking
SpearmanTest
Importance
Correlation Coeficients
Width of the
Importance
Tolerance Zone
1.00
Height of the
Tolerance Zone
0.93
0.96
0.92
Width of Tolerance Zone
0.93
1.00
Altura da Zona de Tolerância
0.96
0.92
Nominal Values
Pearson Test
Importance
Width of the
Tolerance Zone
Height of the
Tolerance Zone
Importance
1.00
- 0.85
0.97
- 0.91
Width of Tolerance Zone
- 0.85
1.00
Height of Tolerance Zone
0.97
- 0.91
1.00
1.00
Source: research
The results suggest, however, the conirmation of
the two airmations by Zeithaml and ”itner
such that atributes that are more important to customers have a narrower tolerance zone and have
limits of expectations closer to the maximum in the
scale used. The coeicient of .
α= .
shows,
how corollary, which is the correlation between the
orderings and the width and height of the tolerance
zone atributes, i.e. atributes with a narrower tolerance zone, are positioned closer to the maximum of
the measuring scale of expectations.
The Pearson test applied to the nominal values of the
medians obtained for importance, width and height
of atribute tolerance zones reairm the alignment
of the measurements. The coeicients of the negative correlations - . and - . , α = .
suggest that
the width of the tolerance zone has the inverse behavior to the importance of the atributes, as well as
the height of the zone. “s expected, the correlation
of the height of the zone with the importance of the
atributes was direct . , α = . . The results of
the tests of correlations are presented in Table .
13. ConCluSIonS
“s theoretical implications, empirical studies involving instruments and methodologies of management help to strengthen the base of application. ”y
Campos, D. F., Nóbrega, K. C.: Importance and the Zone of Tolerance of Customer Expectations of Fast Food Services
Journal of Operations and Supply Chain Management 2 (2), pp 56 - 71, C International Conference of the Production and Operations Management Society
its very nature, the management of service quality
deals with processes of evaluation with an elevated
degree of subjectivity. The appreciation of variables
present in the service encounters requires instruments and scales of measuring that have the capacity
to measure perceptions and expectations, both derived from complex mental processes that vary from
individual to individual. Empirically conirming
the hypothesis raised by the works of Zeithaml et
al
and Zeithaml and ”itner
, this study
reinforces relationships aimed at measurements,
studied in the naturally expressed ield, to evaluate
the subjective character of the impact of service on
individuals. The empirical results of the research
conirm the hypothesis developed. The coeicients
of the correlation obtained reached values near or
higher to . , to the level of signiicance of %.
“s an underlying consequence of the study, the results
allow us to identify the most important atributes of
fast food service, evaluated over a sample of a population of its main consumers K“R“ et al,
NICK
and HOW“RD,
”OJ“NIC,
”OUR“NT“
et al,
. “nd it is important to observe that, with
a base in any one of the measurements importance,
width and height of the zone it is possible to ind that
the atributes most valued relect the essentials of fast
food service the food quality of the ingredients, regularity, lavor, texture, aroma, visual and temperature ,
hygiene in the installations, and food prep and handling , correct registering of orders and price, correct
delivery of order and time of atendance. This tendency is also observed in the study of Machado et al
.
“mong the least valued, on the other hand, appear attributes like the force of the brand, visual atractiveness
of the store, level of frequency, distribution of complimentary gits, presence of the receptionist and availability of staf to take the lunch to the tables.
As managerial implications it may be cited that companies should concentrate eforts on food, hygiene,
service absent of mistakes and service speed rather
than investing on brand, visual atractiveness of
the store, complimentary gits, availability of staf
to take the lunch to the tables these last use to be
cited, in a practical sense, as of greater importance.
“nother opportunity for companies is to investigate
more their own customers’ point of view, as this occurred in the present study.
There are limitations in the present study regarding
possible generalizations of the results obtained with
the levels of expectations about the atributes for the
population as a whole, as this was not the central ob-
69
jective of the study. Cultural factors, price, urgency,
irst use, or renovation, can inluence the limits of
the tolerance zone. In the ield of results referring
to the empirical validation of the hypothesis, the
numerical diferences between the measurements,
when held up to the sample errors, can provoke rank
changes of the atributes evaluated. The changes in
position of the atributes in the ranking can contribute to the improvement of the correlation as well as
its misalignment.
New investigative studies can reveal important connections associated to the service encounters or moments of truth, especially when compared to initial
vs. inal moments, and central vs. auxiliary services.
Or, still, when compared to moments with the classical dimensions of service such as reliability, assurance, responsiveness, empathy and tangibility. “nother opportunity for deeper investigations refer to
the use of a broader sample, including not only university students, but also fast food at the very moment and right ater the moment of consumption,
with interviews performed at the very shopping.
14. REFEREnCES
“HMED, S. Measuring service quality of a public university library in bangladesh using servqual. performance Measurement and Metrics, v. , n. , p. - ,
.
”“EK, S. H“M, S. Y“NG, I. “ cross-cultural comparison of fast
food restaurant selection criteria between korean and ilipino college students. International Journal of Contemporary
hospitality Management. v. , p.
,
.
”EH“R“, R.S. FISHER, W.W. LEMMINK, J., Modelling and
evaluating service quality measurement using neural networks , International Journal of operations & production
Management, v.
n. / , p.
- ,
.
”ITNER, M. HU””ERT, “. ZEITH“ML, V. Customer contributions and roles in service delivery. International Journal of
Service Industry Management, v. , n. , p.
,
.
”ITNER, M.J. ”ROWN, S.W., Technology infusion in service encounters, Journal of the academy of Marketing Science, v.
n. , p.
- ,
.
”OJ“NIC, D. C. Customer proile of the carryout segment for
restaurants. International Journal of Contemporary hospitality Management.v. , n. , p. - ,
”OUR“NT“, N. CHITIRIS, L. P“R“V“NTIS. The relationship
between internal and external servicequality. International
Journal of Contemporary hospitality Management. v. , n.
, p.
,
.
”R“DY, M. RO”ERTSON, C. “n exploratory study of service
value in the US“ and Ecuador. International Journal of Service Industry Management, v. , n. , p.
,
.
Campos, D. F., Nóbrega, K. C.: Importance and the Zone of Tolerance of Customer Expectations of Fast Food Services
70
Journal of Operations and Supply Chain Management 2 (2), pp 56 - 71, C International Conference of the Production and Operations Management Society
all service. International Journal of Service
”ROWN, T. Using norms to improve the intrepretation of service quality measures. The Journal of Services Marketing. v.
, n. , p. - ,
.
Industry Management, v.
C“V“N“, R. COR”ETT, L. Developing zones of tolerance for
managing passenger rail service quality. International Journal of Quality & Reliability Management, v. , n. , p. - ,
.
K“R“, “. K“YN“K, E. KUCUKEMIROGLU, O. Marketing
strategies for fast-food restaurants a customer view. International Journal of Contemporary hospitality Management.v.
, n. , p. - .
CHIOU, H.K. TZENG, G.H. CHENG, D.C., Evaluating sustainable ishing development strategies using fuzzy MCDM approach, omega, v. , p.
- ,
KENG, C. J. et al. Modeling service encounters and customer
experiential value in retailing “n empirical investigation of
shopping mall customers in Taiwan. International Journal
of Service Industry Management. v. , n. , p.
,
.
COOPER, D. SCHINDLER, P. Métodos de pesquisa em administração. Ed. ”ookman Porto “legre,
.
n. , p.
-
,
.
COX, “.D. COX, D. “NDERSON, R.D. Reassessing the pleasure of store shopping, Journal of Business Research, v. ,
n. , p.
- ,
.
L“W, “.K.Y. HUI, Y.V. ZH“O, X. , “. Modeling repurchase frequency and customer satisfaction for fast food outlets. International Journal of Quality & Reliability Management. v.
, n. , p.
,
.
COYE, R.W., Managing customer expectations in the service encounter, International Journal of Service Industry Management, v. , n. , p. - ,
.
LEE, M. ULG“DO, F.M. Consumer evaluations of fast-food services a cross-national comparison. The Journal of Services
Marketing. v. , n. , p. - ,
.
CRONIN, J. Jr T“YLOR, “.S. Measuring service quality a reexamination and an extension, Journal of Marketing, v. , n. ,
p. - .
.
LILJ“NDER, V. STR“NDVIK, T. The nature of customer relationships in services. “dvances in Services Marketing and
Management. The JaI press, p.
,
.
DENG, W. Fuzzy importance-performance analysis for determining critical service atributes , International Journal of
Service Industry Management, v. , n. , p.
,
.
LIU, C. CHEN, K., “. “ look at fast food competition in the Philippines. British Food Journal. v.
, n. , p.
,
.
FITZSIMMONS, J. “. FITZSIMMONS, M.J., administração de
Serviços - operações, estratégias e tecnologia da informação,
Porto “legre ”ookman.
.
GIL”ERT, G. VELOUTSOU, C. MOUTINHO, L. Measuring customer satisfaction in the fast food industry a cross-national
approach. Journal of Services Marketing. v. , n. , p.
,
.
GOY“L, “. SINGH, N.P. Consumer perception about fast food
in India an exploratory study. British Food Journal, v.
,
n. , p.
.
.
GR5NROOS, C. Strategic Management and marketing in the
service sector, Helsinki/Helsingfors Swedish School of Economics, Finland,
.
GR5NROOS, C. Marketing, gerenciamento e serviços: a competição por serviços na hora da verdade, Rio de Janeiro
Campus,
.
GUPT“, “. CHEN, I. Service quality implications for management development. International Journal of Quality & Reliability Management. v. , n. , p. - ,
.
H“RRIS, R. KIM, H. ”“RON, S. Theatrical service experiences
dramatic script development with employees. International
Journal of Service Industry Management, v.
n. , p.
,
JOHNSON, C. M“THEWS, ”.P.The inluence of experience on
service expectations. International Journal of Service Industry Management. v. , n. , p.
,
.
JOHNSTON, R. The zone of tolerance exploring the relationship
between service transactions and satisfaction with the over-
LOVELOCK, C. W., J. Marketing de serviços.São Paulo Prentice
Hall ”rasil.
.
M“CH“DO, M.D. QUEIROZ, T.R. M“RTINS, M.F. Mensuração da qualidade de serviço em empresas de fastfood.
gestão&produção, v. , n. , p.
,
.
MERSH“, T. “DL“KH“, V. “tributes of service quality the
consumer’s perspective. International Journal of Service Industry Management.v. , n. , p. - .
N“DIRI, H. Diagnosing the zone of tolerance for hotel services.
Journal of Services Marketing, v. , n. , p.
,
.
NILSSON-WITELL, L. FUNDIN. “. Dynamics of service atributes a test of Kano’s theory of atractive quality .International Journal of Service Industry Management. v. , n. ,
p.
,
NICK, J. HOW“RD, “. Customer expectations versus perceptions of service performance in the food service industry. .
International Journal of Service Industry Management. v.
, n. , p.
,
.
N2”REG“, K. C. gestão da Qualidade em Serviços. Escola
Politécnica - Departamento de Engenharia de Produção, Universidade de São Paulo, São Paulo,
.
NORM“NN, R. Service Management: Strategy and leadership
in Service Business. New York John Wiley Professional.
.
P“R“SUR“M“N, “. ZEITH“ML, V. ”ERRY, L. “ conceptual
model of service quality and its implications for future research, Journal of Marketing, v.
n. , p. - ,
.
P“R“SUR“M“N, “. ZEITH“ML, V. ”ERRY, L. Servqual a
Campos, D. F., Nóbrega, K. C.: Importance and the Zone of Tolerance of Customer Expectations of Fast Food Services
Journal of Operations and Supply Chain Management 2 (2), pp 56 - 71, C International Conference of the Production and Operations Management Society
71
multiple-item scale for measuring consumer perception of
service quality, Journal of Retailing, v.
n. ,
.
performance on satisfaction process. International Journal of
- ,
.
Service Industry Management, v. , n. , p.
P“R“SUR“M“N, “. ZEITH“ML, V.. ”ERRY, L. Reassessment
of Expectations as a Comparison Standard in Measuring Service Quality Implications for Further Research, Journal of
Marketing, v. , p.
,
.
Y“NG, Z. JUN, M. PETERSON, R. Measuring customer perceived online service quality scale development and managerial implications. International Journal of operations &
production Management, v . , n. / , p.
- ,
.
PRICE, S.The new faces of the fast food market? The potential for
consortia in pizza home delivery. British Food Journal,v. ,
n. , p.
,
.
Y“P, K. SWEENEY, J. Zone-of-tolerance moderates the service
quality-outcome relationship. Journal of Services Marketing, v. , n. , p.
,
.
QIN, H. PRY”UTOK, V. Service quality, customer satisfaction,
and behavioral intentions in fast food restaurants. International Journal of Quality and Service Sciences. v. , n. , p.
- ,
.
ZEITH“ML, V. ”ERRY, L. P“R“SUR“M“N, “. The nature and
determinants of customer expectations of service. Journal of
academy of Marketing Sciences, v. , n. , p. - ,
.
WIRTZ, J. M“TTIL“, “. The impact of expected variance in
ZEITH“ML, V. “. ”ITNER, M. J., Marketing de serviços: a empresa com foco no cliente, Ed. ”ookman, Porto “legre,
.
auThoR’S BIogRaphy
domingos Fernandes Campos is Professor of Operations and Supply Chain Management at the UnP - Potiguar University, Natal, ”razil. He earned his Ph.D. degree in Production Engineering from the Polithecnical
University of Madrid, Spain
. He is a Senior Consultant with a large experience in works for Manufacturing and Logistics companies. His main research interests are Distribution, Logistics Service and Operations Management.
kleber C nóbrega, Mechanical Engineer, concluded his Master Degree in Operations Engineering,
, at
Federal University of Santa Catarina. “ter that he got his Doctoring Degree at EscolaPolitecnicaUniversity of
São Paulo, in
. Kleber is nowadays professor at ”usiness Management Professional Mastering Program,
in Potiguar University, located in Natal, Rio Grande do Norte, ”razil, where he has been responsible for the
disciplines of Strategic Management and Service Operations Management. Kleber has worked as consultant
in Strategic Planning and Management, Service Management, Service Quality, and Quality Systems.
Importance and the Zone of Tolerance of Customer Expectations of Fast Food Services
This article analyzes the relationship between the importance of attributes for service quality and the tol - erance zone between the desired and the minimum acceptable levels for customer expectations. The empirical study, conducted with 500 students, fast food customers, confirms that, as the importance of attributes increases, the tolerance zone gets closer and higher....Read more