c o r t e x x x x ( 2 0 1 5 ) 1 e1 9
Available online at www.sciencedirect.com
ScienceDirect
Journal homepage: www.elsevier.com/locate/cortex
Research report
A purely confirmatory replication study of
structural brain-behavior correlations
Wouter Boekel a,*, Eric-Jan Wagenmakers a, Luam Belay a,
Josine Verhagen a, Scott Brown b and Birte U. Forstmann a
a
b
University of Amsterdam, Amsterdam, The Netherlands
University of Newcastle, Australia
article info
abstract
Article history:
A recent ‘crisis of confidence’ has emerged in the empirical sciences. Several studies have
Received 9 April 2014
suggested that questionable research practices (QRPs) such as optional stopping and se-
Reviewed 20 May 2014
lective publication may be relatively widespread. These QRPs can result in a high propor-
Revised 13 October 2014
tion of false-positive findings, decreasing the reliability and replicability of research output.
Accepted 17 November 2014
A potential solution is to register experiments prior to data acquisition and analysis. In this
Action editor Chris Chambers
study we attempted to replicate studies that relate brain structure to behavior and
Published online xxx
cognition. These structural brain-behavior (SBB) correlations occasionally receive much
attention in science and in the media. Given the impact of these studies, it is important to
Keywords:
investigate their replicability. Here, we attempt to replicate five SBB correlation studies
Preregistration
comprising a total of 17 effects. To prevent the impact of QRPs we employed a preregis-
Confirmatory
tered, purely confirmatory replication approach. For all but one of the 17 findings under
Replication
scrutiny, confirmatory Bayesian hypothesis tests indicated evidence in favor of the null
Brain-behavior correlations
hypothesis ranging from anecdotal (Bayes factor < 3) to strong (Bayes factor > 10). In
several studies, effect size estimates were substantially lower than in the original studies.
To our knowledge, this is the first multi-study confirmatory replication of SBB correlations.
With this study, we hope to encourage other researchers to undertake similar replication
attempts.
© 2015 Published by Elsevier Ltd.
1.
Introduction
In the last few years, the need for confirmatory replication
studies has become increasingly evident. Recent studies have
suggested that the empirical sciences are bedeviled by the use
of questionable research practices (QRPs; John, Loewenstein,
& Prelec, 2012; Simmons, Nelson, & Simonsohn, 2011). These
practices include, for instance, optional stopping (i.e.,
continuing data collection until p < .05) and cherry-picking
(e.g., reporting only those variables, conditions, or analyses
that yield the desired result). In combination with the ubiquitous file drawer problem (Rosenthal, 1979), the use of these
QPRs results in a high false-positive rate, such that many
significant findings may in fact be false (Ioannidis, 2005). This
* Corresponding author. Nieuwe Achtergracht 129, 1018 WS, Amsterdam.
E-mail address: W.E.Boekel@uva.nl (W. Boekel).
http://dx.doi.org/10.1016/j.cortex.2014.11.019
0010-9452/© 2015 Published by Elsevier Ltd.
Please cite this article in press as: Boekel, W., et al., A purely confirmatory replication study of structural brain-behavior correlations, Cortex (2015), http://dx.doi.org/10.1016/j.cortex.2014.11.019
�2
c o r t e x x x x ( 2 0 1 5 ) 1 e1 9
realization has brought about a crisis of confidence in the
replicability and reliability of published research findings
(Ioannidis, 2012; MacArthur, 2012; Pashler & Wagenmakers,
2012). A recent study by Button, Ioannidis, Mokrysz, Nosek,
Flint et al. (2013) showed that this crisis of confidence extends to the neurosciences. The crisis of confidence can be
reduced in several ways. One powerful remedy is to eliminate
QRPs by preregistering experiments prior to data acquisition
and analysis, resembling the standard operating procedure
mandated in the case of clinical trials (Chambers, 2013; De
Groot, 1969; Goldacre, 2009; Wagenmakers, Wetzels,
Borsboom, van der Maas, & Kievit, 2012; Wolfe, 2013). In this
article we apply study preregistration to assess the replicability of a series of findings in cognitive neuroscience.
Research in cognitive neuroscience aims to investigate the
link between brain and behavior. Recently, researchers have
exploited significant advances in anatomical magnetic resonance imaging (MRI) to detect subtle differences in brain
structure associated with differences in behavioral measures
(Kanai & Rees, 2011). For example, in a study that received
much attention in science and the media, Kanai, Bahrami,
Roylance, and Rees (2012) found that individuals with a
relatively large grey matter (GM) volume in specific brain
regions have more Facebook friends. Other studies have reported structural brain-behavior (SBB) correlations between
properties of grey and/or white matter (WM) and behavioral
measures such as choice reaction time (RT) (Tuch et al., 2005),
control over speed and accuracy in decision making
(Forstmann et al., 2010), percept duration in perceptual rivalry (Kanai, Bahrami, & Rees, 2010; Kanai, Carmel, Bahrami,
& Rees, 2011), components of attention (i.e., executive control
and alerting; Westlye, Grydeland, Walhovd, & Fjell, 2011),
response inhibition (King et al., 2012), metacognitive ability
(i.e., the ability to evaluate one's perceptual decisions;
Fleming, Weil, Nagy, Dolan, & Rees, 2010), aspects of social
cognition (i.e., social network size; Bickart, Wright, Dautoff,
Dickerson, & Barrett, 2011; social influence; CampbellMeiklejohn et al., 2012), distractibility (Kanai, Dong,
Bahrami, & Rees, 2011), political orientation (Kanai, Feilden,
Firth, & Rees, 2011), sensitivity to reward and approach
motivation (Xu et al., 2012), moral values (Lewis, Kanai, Bates,
& Rees, 2012), and empathy (Banissy, Kanai, Walsh, & Rees,
2012).
Motivated by the increase in number and prominence of
SBB correlations, as well as the general uncertainty regarding
the reliability of non-preregistered research findings, we
attempted to replicate a subset of the above-mentioned
studies in a purely confirmatory fashion. It should be noted
that conceptual replications, wherein a hypothesis from the
original study is tested in a different experimental paradigm,
do not provide reliable evidence for or against the robustness
of the respective finding. Instead, only direct replications,
wherein all relevant aspects of the original study are repeated
can support or oppose the original finding (Pashler & Harris,
2012).
Here, we report a preregistered, purely confirmatory
replication of a subset of five SBB correlation studies selected
from recent literature based on the brevity of their behavioral
data acquisition. The transparency conveyed by a confirmatory design helps to avoid common pitfalls in neuroscience
(and other sciences) such as the use of nonindependent
analysis (Vul, Harris, Winkielman, & Pashler, 2009), double
dipping (Kriegeskorte, Simmons, Bellgowan, & Baker, 2009),
obscure data collection and analysis techniques which increase false-positive rates (Simmons et al., 2011), confirmation and hindsight bias on the part of the researcher (i.e., the
tendency to confirm instead of disconfirm one's beliefs and
the tendency to judge events more predictable after they
have occurred, respectively; Wagenmakers et al., 2012). A
strictly confirmatory framework was ensured by publishing a
'Methods
and
Analyses
document'
(M&A;
http://
confrepneurosci.blogspot.nl/2012/06/advanced-methodsand-analyses_26.html) online before any data were inspected
or analyzed (as recommended by several researchers, e.g.,
Chambers, 2013; De Groot, 1969; Goldacre, 2009;
Wagenmakers et al., 2012; Wolfe, 2013). This M&A document was sent to the corresponding authors of the original
studies. All authors agreed to the replication attempt and the
processing pipeline as outlined in the M&A document. Any
analysis not outlined in the M&A document will be labeled
'exploratory' (as recommended by Wagenmakers, Wetzels,
Borsboom, & van der Maas, 2011). We confined our hypotheses to the direction and location of the SBB correlations reported in the original articles. For instance, Kanai et al. (2012)
reported a positive SBB correlation between GM density in
left amygdala and the number of friends on Facebook;
consequently the to-be-replicated hypothesis postulates a
positive SBB correlation between the same variables in our
sample. This order-restriction of the hypotheses has two
benefits. First, it allowed us to use one-sided as opposed to
two-sided hypothesis tests, which are more specific and
statistically more powerful. Second, it allowed us to focus our
analyses on specific regions in the brain, i.e., regions of interest (ROI), instead of searching the whole brain for SBB
correlations. This way we circumvent the need for multiple
comparisons corrections that are required in whole-brain
analyses.
In order to quantify the evidence that the data provide for
and against the null-hypothesis, we opted for a Bayesian hypothesis test for correlations and computed Bayes factors (BF;
Jeffreys, 1961) instead of p-values (for a discussion of problems
with p-values, see Edwards, Lindman, & Savage, 1963;
Wagenmakers, 2007). Note that in contrast to Bayes factors,
p-values are unable to quantify support in favor of the null
hypothesis; a non-significant p-value indicates no more than a
“failure to reject the null hypothesis”. The replication attempts will be considered successful if the corresponding
Bayes factor supports the hypothesized relationship. Accordingly, a Bayes factor that supports the null hypothesis suggests a failed replication. In addition to this preregistered
analysis, exploratory analyses examine estimates of effect
size. It is possible that the Bayes factor supports the null hypothesis, but the estimated effect size is nevertheless close to
the original effect size. To address this concern, an additional
exploratory Bayes factor analysis compares the null hypothesis to an alternative hypothesis that incorporates the
knowledge obtained from the original study (cf. Verhagen &
Wagenmakers, 2014). These exploratory analyses occasionally provide a more nuanced perspective on the extent to
which SBB correlations can be replicated.
Please cite this article in press as: Boekel, W., et al., A purely confirmatory replication study of structural brain-behavior correlations, Cortex (2015), http://dx.doi.org/10.1016/j.cortex.2014.11.019
�c o r t e x x x x ( 2 0 1 5 ) 1 e1 9
2.
Materials and methods
2.1.
General methods
Prior to inspection of the data, a preregistration protocol was
published online (http://confrepneurosci.blogspot.nl/2012/06/
advanced-methods-and-analyses_26.html). This ‘Methods
and Analyses’ (M&A) document described all data acquisition
and analysis steps. Below we summarize the subparts of this
M&A document which are applicable to the results described
in this article.
2.1.1.
Participants
36 undergraduate psychology students (mean age ¼ 20.12,
SD ¼ 1.73; 18 females) with normal or corrected-to-normal
vision were recruited from the participant pool of a previous
43-participant MRI study. The MRI study was recently conducted by Forstmann and Wagenmakers' research group at
the University of Amsterdam and featured extensive Diffusion
Weighted Imaging (DWI) and T1-weighted imaging. Hence,
the additional effort involved in replicating the five studies
consisted primarily in having participants complete a battery
of behavioral tests. The experiments were approved by the
local ethics committee of the University of Amsterdam. Participants received a monetary compensation for their time
and effort.
2.1.2.
Study selection
We aimed to perform replications of a series of recent studies
reporting correlations between brain structure and behavior.
A review by Kanai and Rees (2011) provided us with many
topical SBB correlation findings. In addition, several other
studies were selected from previous literature. Brevity of
behavioral data acquisition was the main selection criterion,
to ensure that we would be able to replicate many SBB correlations while minimizing total acquisition time.
2.1.3.
Study exclusion
Several studies, although selected and described in the M&A
document, were omitted from the final analyses based on
several reasons: Kanai, Feilden, et al. (2011) found an SBB
correlation between political orientation and brain structure
in young adults, using a simple 5-point self-report measure
ranging from very liberal to very conservative. The data that
we acquired to replicate this contained insufficient variability
in this self-report measure, and thus we excluded this study
(mean: 2.26, SD: .57, range: 1e3; Supplementary Fig. S1 shows
scatterplots of these data). The other three studies (Bickart
et al., 2011; Kanai et al., 2010, Kanai, Carmel, et al., 2011)
were excluded from final replication based on problems with
the ROI masks sent by the authors of the original papers (e.g.,
missing masks, or masks which did not match coordinates
reported in the original papers). Five studies remained for the
final replication attempt.
2.1.4.
General procedure
The time between MRI-scanning and behavioral testing
ranged from 25 to 50 days. Prior to the behavioral test session, participants received an information brochure and
3
signed an informed consent form. Participants were tested
in individual computer booths. All instructions were shown
on the computer screen or printed on top of the questionnaires. Participants began by filling out the following questionnaires: BIS/BAS (Carver & White, 1994), social network
index (Cohen, 1997), social network size questionnaire
(Stileman & Bates, 2007), cognitive failures questionnaire
(CFQ) (Broadbent, Cooper, Fitzgerald, & Parkes, 1982), political orientation questionnaire (Kanai, Feilden, et al., 2011),
moral foundations questionnaire (Graham, Haidt, & Nosek,
2009), and the interpersonal reactivity index (Davis, 1980).
After completing the questionnaires, participants continued
with the computerized tasks: Bistable SFM task (Wallach &
O'Connel, 1953), random dot motion (RDM) task (Britten,
Shadlen, Newsome, & Movshon, 1992; Gold & Shadlen,
2007), and the attention network test (Fan, McCandliss,
Sommer, Raz, & Posner, 2002). The order of both questionnaires and computer tasks was randomized across participants. The total duration of the test session was 1 h and
30 min. A subset of these tasks and questionnaires (i.e., the
ones connected to the five studies that were included in the
final replication attempt) were analyzed.
2.1.5.
MRI data acquisition
DWI and T1-weighted images were collected on a 3T Philips
scanner using a 32- channel head coil. For each participant,
four repetitions of a multi-slice spin echo (MS-SE), single shot
DWI scan were obtained using the following parameters:
TR ¼ 7545 msec, TE ¼ 86 msec, 60 transverse slices, 2 mm slice
thickness, FOV: 224 � 224 mm2, voxel size 2 mm isotropic
resolution. For each slice, 32 diffusion-weighted images
(b ¼ 1000 sec/mm2) along 32 directions were acquired, along
with one image without diffusion weighting (b0 image, where
b ¼ 0). In addition, a T1-weighted anatomical scan was acquired (T1 turbo field echo, 220 transverse slices of 1 mm, with
a resolution of 1 mm3, TR ¼ 8.2 msec, TE ¼ 3.7 msec).
2.1.6.
ROI-based analysis
Our purely confirmatory approach allowed us to circumvent
the multiple comparison problems present in whole-brain
analyses. We extracted measures of brain structure from
ROIs provided to us by the authors of the original papers.
These measures were then correlated to the respective
behavioral measure. This approach would not have been
possible if the authors of the original authors had not provided
us with the ROI masks of their findings. We would like to
thank these authors for their cooperation and openness.
2.1.7.
DWI analyses
All DWI data (pre-)processing and analyses were carried out
using FMRIB's Software Library (FSL, version 4.0; www.fmrib.
ox.ac.uk/fsl). Per participant, all four runs of DWI were
concatenated and corrected for eddy currents. Affine registration was used to register each volume to a reference volume (Jenkinson & Smith, 2001). A single image without
diffusion weighting (b0; b-value ¼ 0 sec/mm2) was extracted
from the concatenated data and non-brain tissue was
removed using FMRIB's Brain Extraction Tool (BET; Smith,
2002) to create a brain-mask which was used in subsequent
analyses.
Please cite this article in press as: Boekel, W., et al., A purely confirmatory replication study of structural brain-behavior correlations, Cortex (2015), http://dx.doi.org/10.1016/j.cortex.2014.11.019
�4
c o r t e x x x x ( 2 0 1 5 ) 1 e1 9
DTIFIT (Behrens et al., 2003) was applied to fit a tensor
model at each voxel of the data (Smith, Jenkinson, Woolrich, &
Beckmann, 2004). Tract-Based Spatial Statistics (TBSS) were
performed using FSL's default TBSS pipeline (Smith et al.,
2006; http://www.fmrib.ox.ac.uk/fsl/tbss/index.html). First,
fractional anisotropy (FA) images were slightly eroded and
end slices were zeroed in order to remove likely outliers from
the diffusion tensor fitting. Second, all FA images were aligned
to 1 mm standard space using non-linear registration to the
FMRIB58_FA standard-space image. Affine registration was
then used to align images into 1 � 1 � 1 mm MNI152 space, and
a skeletonization procedure was subsequently applied to a
mean FA image resulting from averaging all individual MNIaligned images. Subsequently, the mean skeletonized FA
image was thresholded at FA > .2 in order to accurately
represent white-matter tracts. Participants FA data were then
projected onto the mean skeletonized FA image and concatenated. In addition to using FA images, we repeated this
processing pipeline for mean diffusivity (MD) and parallel
eigenvalue (l1) images using the tbss_non_FA function in
order to generate skeletonized MD and l1 files.
As opposed to using voxel-wise permutation tests for significance, our purely confirmatory approach allowed us to
extract and average FA/MD/l1 from ROIs based on spatial
maps provided by the original authors. For the TBSS procedure, the spatial maps provided by the original authors were
registered to the mean FA template generated by our TBSS
procedure. This was done to maximize the overlay between
the spatial maps and our study-specific skeletonized FA
template. In order to exclude the possibility that this registration step might impact the final hypothesis test, additional
exploratory analyses were performed without registering the
spatial maps to our FA template. These analyses are not reported here, as their results did not differ from our main analyses in terms of interpretation (i.e., Bayes factors were
comparable).
After extracting FA/MD/l1 signal from the ROIs, we then
used one-sided Bayesian correlation tests (described below) to
quantify evidence in favor of either the null hypothesis (H0) or
the alternative hypothesis (H1). In our analyses, H1 represents
the presence of either a positive or a negative correlation
(depending on the predicted direction of the correlation), and
the H0 represents the absence of the predicted correlation.
2.1.8.
Probabilistic tractography
Bayesian estimation of diffusion parameters obtained using
sampling techniques (BedpostX) was applied to the preprocessed DWI data. BedpostX uses a dual fiber model which
can account for crossing fibers. Estimation of tract strengths
(for the replication attempt of Forstmann et al., 2010) was
conducted using probabilistic tractography (Behrens et al.,
2003). Five thousand tracts were sampled from each voxel in
the seed mask (right pre-supplementary motor area; Pre-SMA)
at a curvature threshold of .2. Next, the number of samples
that reach the classification target mask (e.g., right striatum)
was measured. In addition, contralateral exclusion masks
were used to discard pathways crossing over to the contralateral hemisphere before traveling to the classification target
mask. The number of voxels for which a minimum of 10
samples reached the classification mask was divided by the
total number of voxels in the seed mask, resulting in a value
that represents the proportion of the seed mask that was
probabilistically connected to the classification mask. A
similar procedure was applied in the opposite direction
(where the seed and classification masks were switched).
Tract strength was defined as the average of the two proportions that resulted from the seed-to-classification and
classification-to-seed analyses.
2.1.9.
Voxel-Based Morphometry
Voxel-Based Morphometry (VBM) was performed using FSL's
default VBM pipeline (Douaud et al., 2007; http://fsl.fmrib.ox.
ac.uk/fsl/fslwiki/FSLVBM). First, non-brain tissue was
removed from T1 images using BET. Second, brain-extracted
images were segmented into GM, WM, and cerebrospinal
fluid (CSF). GM images were non-linearly registered to GM
ICBM-152, and averaged to create a study-specific template at
2 mm resolution in standard space. All GM images were then
non-linearly registered to the study-specific template. During
this stage, each voxel of each registered GM image is divided
by the Jacobian of the warp field (Good et al., 2001). Images
were smoothed using a Gaussian kernel with a sigma of 3 mm.
As opposed to using voxel-wise permutation tests for significance, our purely confirmatory approach allowed us to
extract and average GM volume from ROIs based on spatial
maps provided by the original authors. We then used onesided Bayesian correlation tests (described below) to quantify evidence in favor of either H0 or H1.
2.1.10. Cortical thickness analysis
Cortical reconstruction and volumetric segmentation was
performed with the FreeSurfer image analysis suite (http://
surfer.nmr.mgh.harvard.edu/). The technical details of these
procedures are described elsewhere (Dale, Fischl, & Sereno,
1999; Dale & Sereno, 1993; Fischl & Dale, 2000; Fischl, van
der Kouwe, et al., 2004; Fischl, Liu, & Dale, 2001; Fischl, Salat,
Busa, Albert, Dieterich et al., 2002; Fischl, Salat, et al., 2004;
Fischl, Sereno, & Dale, 1999; Fischl, Sereno, Tootell, & Dale,
1999; Han et al., 2006; Jovicich et al., 2006; Reuter, Rosas, &
Fischl, 2010; Reuter, Schmansky, Rosas, & Fischl, 2012;
� gonne et al., 2004). FreeSurfer pre-processing included
Se
motion correction (Reuter et al., 2010) of volumetric T1weighted images, removal of non-brain tissue using a hybrid
�gonne et al.,
watershed/surface deformation procedure (Se
2004), automated Talairach transformation, segmentation of
the subcortical WM and deep GM volumetric structures
(including hippocampus, amygdala, caudate, putamen, and
ventricles; Fischl et al., 2002; Fischl, Salat, et al., 2004) intensity
normalization (Sled, Zijdenbos, & Evans, 1998), tessellation of
the gray/white matter boundary, automated topology correc�gonne, Pacheco, & Fischl, 2007), and
tion (Fischl et al., 2001; Se
surface deformation following intensity gradients to optimally place the gray/white and gray/CSF borders at the location where the greatest shift in intensity defines the transition
to the other tissue class (Dale & Sereno, 1993; Dale et al., 1999;
Fischl & Dale, 2000). Reconstruction of the GM/WM boundary
and pail surface was manually checked for inaccuracies.
Subsequently, ROI-labels were mapped onto individual brains
and average cortical thickness (Fischl & Dale, 2000) was
extracted per ROI, per participant.
Please cite this article in press as: Boekel, W., et al., A purely confirmatory replication study of structural brain-behavior correlations, Cortex (2015), http://dx.doi.org/10.1016/j.cortex.2014.11.019
�5
c o r t e x x x x ( 2 0 1 5 ) 1 e1 9
2.1.11. General outlier rejection criterion
In the M&A document that we published online prior to inspection of the data, we specified a general outlier rejection
criterion. Any deviation of more than 2.5 standard deviations
(SDs) from the respective mean results in an exclusion of the
participant from the replication in which it is classified as an
outlier (as such, a participant can still be included in a
different replication, for which he or she was not classified as
an outlier).
2.1.12. Confirmatory Bayesian hypothesis test for correlations
Our main analysis goal was to grade the decisiveness of the
evidence that the data provide for and against the presence of
a correlation between the structural brain measures and the
behavioral measures. This goal can be achieved by computing
Bayes factors (Dienes, 2008; Jeffreys, 1961; Kass & Raftery,
1995; Lee & Wagenmakers, 2013; Rouder, Morey, Speckman,
& Province, 2012; Rouder, Speckman, Sun, Morey, & Iverson,
2009). The Bayes factor compares the adequacy of two
models; in our case, the first model is the null hypothesis H0
that postulates the absence of a correlation between the
structural brain measures and the behavioral measures. The
second model is the alternative hypothesis H1 that postulates
the presence of a positive (or negative) correlation between
the two measures.
The Bayes factor quantifies the odds that the observed data
occurred under H0 versus H1. For example, a Bayes factor
equal to 5.2 indicates that the observed data are 5.2 times as
likely to occur under H0 than under H1. In this way the Bayes
factor provides a continuous measure of evidential support,
and its interpretation does not require recourse to actions,
decisions, or criteria of acceptance.
To compute the Bayes factor for the Pearson correlation
coefficient, we need to specify both H0 and H1. Jeffreys (1961)
proposed a default test by assigning uninformative priors to
the nuisance parameters (i.e., parameters common to H0 and
H1) and a uniform prior distribution from 1 to 1 to the correlation coefficient r that is unique for H1 (Jeffreys, 1961, p.
291). Consequently, under Jeffreys' alternative hypothesis H1,
each value of the correlation coefficient r is a priori equally
likely.
Inspired by Jeffreys' test we grade the decisiveness of the
evidence by computing BF10, that is, the probability of the
observed data under H1 versus H0:
BF10 ¼
Z1
0
ð1
ð1
1 ðn
r2 Þ2
n
rrÞ
1Þ
3
2
dr
(1)
The number of data pairs is denoted by n, and r is the
sample Pearson correlation coefficient. As indicated by the
range of integration in Equation (1), we have adjusted Jeffreys
test such that the alternative hypothesis is one-sided. The
one-sided nature of this test is appropriate, since we intend to
replicate SBB correlations, thereby committing to specific directions (as reported in the original studies).
In Equation (1), the integration is from 0 to 1 implying a test
for a positive correlation. In case of a test for a negative correlation we simply multiply one of the observed variables with
1. An R function to compute the BF in the above-mentioned
way is freely available at http://www.josineverhagen.com/?
page_id¼76.
The evidential support that the BF01 gives to the null hypothesis can be categorized based on a set of labels proposed
by Jeffreys (1961). Table 1 shows this evidence categorization
for the BF01, edited by and taken from Wetzels and
Wagenmakers (2012; Table 1, p. 1060). In short, a BF01 greater
than 1 indicates that the data are more likely to occur under H0
than under H1. Equivalently, a BF01 lower than 1 indicates that
the data are more likely to occur under H1 than under H0. The
evidence categories apply to the BF10 (¼1/BF01; reciprocal of
the BF01) in a reversed manner; e.g., a BF10 with a value between 10 and 30 provides strong evidence for H1 and a BF10
with a value between 1/10 and 1/30 provides strong evidence
for H0. Thus, when we analyze data and find that, for instance,
BF01 ¼ 6.5, this means that the data are 6.5 times more likely to
have occurred under H0 than under H1; similarly, BF01 ¼ .2
means that the data are 5 times more likely to have occurred
under H1 than under H0. The labels shown in Table 1 are useful
because they facilitate scientific communication; nevertheless, the labels should not be over-interpreted. Many researchers may find the meaning of BF01 ¼ 6.5 clear without the
help of the labels from Table 1.
2.1.13. Posterior probability distributions
The posterior distribution is formed by combining the information or beliefs about the correlation available prior to the
experiment (as expressed in the prior distribution), with the
correlation observed in the data.
In a situation where nothing is known about the correlation prior to the experiment, an uninformative uniform prior
distribution can be used, in which every correlation between
1 and 1 has equal probability (Fig. 1 black line). In this situation, once a correlation has been observed, the posterior
distribution will have a higher probability around the
observed correlation and less probability at values further
away (Fig. 1 red line). The posterior distribution represents the
knowledge we have about the correlation of interest after
observing the data.
When we want to update this knowledge with a new
experiment, the posterior from the previous experiment can
be taken as the prior for the next experiment. This indicates
that the correlation in the new study is expected to be similar
to the correlation in the previous study, as the prior gives
more probability to values closer to the previously observed
correlation. When this informative prior distribution is
Table 1 e Categories for the BF01.
Bayes factor BF01
30
10
3
1
1/3
1/10
1/30
1/100
>
e
e
e
e
1
e
e
e
e
<
Interpretation
100
100
30
10
3
1
1/3
1/10
1/30
1/100
Extreme evidence for H0
Very Strong evidence for H0
Strong evidence for H0
Moderate evidence for H0
Anecdotal evidence for H0
No evidence
Anecdotal evidence for H1
Moderate evidence for H1
Strong evidence for H1
Very Strong evidence for H1
Extreme evidence for H1
Please cite this article in press as: Boekel, W., et al., A purely confirmatory replication study of structural brain-behavior correlations, Cortex (2015), http://dx.doi.org/10.1016/j.cortex.2014.11.019
�6
c o r t e x x x x ( 2 0 1 5 ) 1 e1 9
posterior distribution and a summary in terms of 95% credible
intervals.
Finally, for frequentist readers we provide p-values. Once
again, these are labeled as exploratory given that we did not
preregister the use of frequentist statistics in our M&A
document.
2.2.
Fig. 1 e Posteriors plot. Example of a posterior plot,
showing uniform prior distribution (black line), the
posterior after the original effect (red line), and the
posterior after the replication effect (blue line), using the
posterior as a prior distribution.
updated by the correlation observed in a new experiment, the
final posterior distribution will be identical to the posterior
distribution had all data been analyzed together from the start
(Fig. 1 blue line).
We will also use the posterior distribution of the previous
study in a different way, for model comparison. In this case,
the posterior distribution from the original study is used to
represent the hypothesis that the observed correlation is
similar to the previous correlation.
2.1.14. Additional exploratory analyses
In addition to the Bayesian test described above, we computed
an additional Bayesian test in which H1 is specified not only to
the direction of the effect found in the original study, but also
to its effect size (Verhagen & Wagenmakers, 2014). In this way,
this test answers the question ‘Is the effect from the replication attempt comparable to what was found before, or is it
absent?’, whereas the original Bayesian test answers the
question ‘Is the effect present or absent in the data from the
replication attempt?’. We label this additional analysis
exploratory as it was not described and published in the M&A
document prior to inspection of the data.
The replication Bayes factor compares evidence in favor of
the null hypothesis of no effect, H0: r ¼ 0, with the evidence in
favor of the alternative hypothesis that the effect is equal to
the effect found in the original study, Hr: r ~ posterior distribution from original study. The resulting Bayes factor is similar to
the Bayes factor in Equation (1), with the only difference that
the replication Bayes factor is obtained by integrating over the
posterior distribution from the first study instead of a uniform
distribution. A more detailed description of the replication
Bayes factor can be found in Appendix A. R code to perform
this analysis can be found in this link http://www.
josineverhagen.com/?page_id¼76.
In addition to the Bayes factor tests, an intuitive assessment of the extent to which our results replicate the original
studies can also be obtained by comparing the posterior distributions for the correlation coefficients in the original and
replication studies. We facilitate such a comparison by plotting, for each of the five replication attempts, both the entire
Study-specific methods
Below we describe study-specific methods for the five experiments included in the final replication attempt remaining
after study exclusion. For each experiment we describe the
stimuli and procedure, behavioral analyses, structural brain
analyses, and statistical tests based on hypotheses generated
by the original papers.
2.2.1. Replication 1: Forstmann et al. (2010)
2.2.1.1. RDM TASK AND PROCEDURE. We used the same RDM task
(Gold & Shadlen, 2007) as Forstmann et al. (2010). The task
contained 360 trials in total, with 180 speed and 180 accuracy
trials. The RDM cloud consisted of 60 coherently moving white
dots and 60 randomly moving white dots, presented against a
black background (see http://wouterboekel.com/CONFREP/
dots_loop.gif). A single dot consisted of 3 pixels and the entire
cloud spanned 250 pixels. At the start of each trial, either a
speed cue or an accuracy cue was presented for 1000 msec. The
speed cue instructed participants to respond as quickly as
possible. The accuracy cue instructed participants to respond
as accurate as possible. The cue was followed by a fixation cross
presented at the center of the screen for 500 msec. Subsequently, the RDM stimulus was presented for 1500 msec or until
a response was made. Responses outside of this time window
were ignored. Participants responded on a keyboard by pressing ‘a’ with their left index finger when they perceived a leftward motion and ‘l’ with their right index finger when they
perceived a rightward motion. Immediately after the response,
participants received a feedback message for 400 msec. On
speed trials, the feedback read either ‘te traag’ or ‘op tijd’ (i.e.,
Dutch for ’too slow’ and ‘in time’). On accuracy trials, the
feedback read either ‘fout’ or ‘goed’ (i.e., Dutch for ‘incorrect’
and ’correct’). 45-sec breaks were inserted after 120 and after
240 trials. The entire task lasted for approximately 20 min.
2.2.1.2. LBA MODEL. The linear ballistic accumulator (LBA;
Brown & Heathcote, 2008) model decomposes the response
time and accuracy measures into latent psychological processes. It assumes that when given a choice between two alternatives, evidence accumulates from a start point (A), at a
certain speed (drift rate v), for both alternatives separately.
When one of these accumulators reaches its response
threshold (b), a decision is made in favor of the associated
alternative. Response time is determined by the time taken to
reach the threshold, plus an offset time for stimulus encoding
and motor processes (non-decision time t0) (Fig. 2).
The element of central interest here is response caution,
which can be quantified via the threshold height in the LBA.
We applied the same parameter constraints as Forstmann
et al. (2010). In this design only one parameterdresponse
threshold bdis free to vary with the speed vs accuracy cue,
while all other parameters (width of start point distribution A,
Please cite this article in press as: Boekel, W., et al., A purely confirmatory replication study of structural brain-behavior correlations, Cortex (2015), http://dx.doi.org/10.1016/j.cortex.2014.11.019
�c o r t e x x x x ( 2 0 1 5 ) 1 e1 9
7
make a note of the number of friends they have on ‘Facebook’
or an alternative comparable social network site such as
‘myspace’ or the Dutch ‘Hyves’ and bring it to the test session.
The administration time is approximately 10 min.
2.2.2.2. BEHAVIORAL
Fig. 2 e Schematic representation of the LBA model used in
the replication of Forstmann et al. (2010). In the LBA model,
the decision to respond either left or right is modeled as a
race between 2 accumulators. Activation in each
accumulator begins at a random point between zero and
start point A and increases with time. The rate of increase
is random from trial to trial, but is (on average) faster for
the accumulator whose associated response matches the
stimulus. A response is given by whichever accumulator
first reaches the threshold b, and the predicted response
time depends on the time taken to reach that threshold.
drift rate v, variability of the drift rate s, and nondecision time
t0) are fixed. Response caution is measured by subtracting
start point A from response threshold b.
2.2.1.3. BEHAVIORAL
DATA ANALYSIS. The behavioral measure of
interest is the LBA flexibility parameter, assessing efficacy of
changing response caution. It is assumed that “changes in
response caution originate from adjustments of response
thresholds (Forstmann et al., 2010; page 1516)”. Therefore, LBA
flexibility was computed as the difference between the LBA
caution estimates for the accuracy and the speed conditions.
We fit the LBA model to each participants accuracy and
RT distributions on speed and accuracy trials separately. The
only parameter allowed to vary was the response threshold b.
The resulting individual LBA flexibility estimates were imported into R software (R Foundation for Statistical Computing,
http://www.R-project.org) for the Bayesian correlation test.
2.2.1.4. PROBABILISTIC
TRACTOGRAPHY.
We limited our tractography to delineate tracts that the authors found to correlate
significantly with LBA flexibility. Hence, probabilistic tractography was performed only between right pre-SMA and right
striatum. Here we used the same MNI-space masks for right
pre-SMA and right striatum as were used in Forstmann et al.
(2010). We performed the probabilistic tractography in accordance with the protocol stated in the general methods section
(see above). Resulting tract strength values were corrected for
age and gender using partial correlations, and were subsequently imported into R software for the Bayesian correlation
test. Specifically, we tested for a positive correlation between
right pre-SMAeright striatum tract strength and LBA flexibility.
2.2.2. Replication 2: Kanai et al. (2012)
2.2.2.1. SOCIAL NETWORK SIZE QUESTIONNAIRE
AND PROCEDURE. Participants completed a Dutch version of the Social Network
Size questionnaire (Stileman & Bates, 2007). This questionnaire consists of 9 items. One of its items is: “How many
friends do you have on ‘Facebook’?”. We asked participants to
DATA ANALYSIS. The behavioral measures of
interest are online social network size (i.e., FBN) and real-world
social network size. As was done in Kanai et al. (2012), answers
to the 9 subquestions contained in this questionnaire were
square-root transformed to correct for skewness. We computed
the FBN as the square root of participants answer to the question: “How many friends do you have on ‘Facebook’?”. A
normalized real-world social network size score (SNS) was
computed per participant by averaging the z-scores for the
questionnaire items 1, 2, 4, 5, 6, 8, and 9 after skewness correction. For each participant an online social network size (i.e., FBN)
score and a real-world social network size (i.e., SNS) score was
imported into R software for the Bayesian correlation test.
2.2.2.3. ROI
GENERATION. Kanai et al. (2012) reported significant
positive correlations between online social network size and
GM volume within left middle temporal gyrus (MTG), right superior temporal sulcus (STS), right entorhinal cortex (EC), and
bilateral amygdala. In addition, real-world social network size
was positively correlated with GM volume only within right
amygdala. We defined all these regions as our ROIs. Dr. Kanai
kindly provided us with the spatial maps of these regions.
2.2.2.4. CORRELATIONAL ANALYSIS. For every participant, we
extracted GM volume values from all voxels contained in the
ROIs and averaged them. These GM volume measures were
then corrected for age, gender and total GM volume. The
corrected mean GM volume measures were imported into R
software for the Bayesian correlation test. Specifically, we
tested for positive correlations between FBN and mean GM
volume within left MTG, right STS, right EC, and bilateral
amygdala. Furthermore, we tested for a positive correlation
between SNS and mean GM volume within right amygdala.
2.2.3. Replication 3: Xu et al. (2012)
2.2.3.1. BIS/BAS QUESTIONNAIRE AND
PROCEDURE. Participants
completed a Dutch version of the Behavioral Inhibition System/Behavioral Activation System scale (BIS/BAS; Carver et al.,
1994). The BIS/BAS is a 20-item questionnaire. Our interest was
focused on the BAS scale, which comprises 13 items (BASTotal) and has three sub-scales: Drive (BAS-Drive), Fun-Seeking
(BAS-Fun), and Reward-Responsiveness (BAS-Reward).
2.2.3.2. BEHAVIORAL
ANALYSIS. The behavioral measures of interest were BAS-Total scores and BAS-Fun scores. BAS-Total
scores assess the sensitivity to signals of reward and nonpunishment. BAS-Fun scores assess the tendency to seek
out new potentially rewarding experiences. For each participant these scores were imported into R software for the
Bayesian correlation test.
2.2.3.3. ROI GENERATION. Xu et al. (2012) reported significant
positive correlations between the BAS-Total scores and l1
within left corona radiata (CR) and left superior longitudinal
fasciculus (SLF). Furthermore, they reported positive
Please cite this article in press as: Boekel, W., et al., A purely confirmatory replication study of structural brain-behavior correlations, Cortex (2015), http://dx.doi.org/10.1016/j.cortex.2014.11.019
�8
c o r t e x x x x ( 2 0 1 5 ) 1 e1 9
correlations between the BAS-Fun scores and l1 as well as FA
within left CR and left SLF. The authors also reported significant positive correlations between the BAS-Fun scores and
MD within left inferior longitudinal fasciculus (ILF) and left
inferior fronto-occipital fasciculus (IFOF). We defined all these
WM tracts as our ROIs. Dr. Xu kindly provided us with the
spatial maps of these areas.
2.2.3.4. CORRELATIONAL ANALYSIS. For every participant, we
extracted FA, MD, and l1 values from all voxels contained in
the respective ROIs and averaged them. These values were
then corrected for age and gender using partial correlations.
Unlike Xu et al. (2012), we did not need to correct for differences in education because our participants were all first-year
Psychology students. The corrected mean WM tract measures
per ROI were imported into R software for the Bayesian correlation test. Specifically, we tested for positive correlations
between BAS-Total scores and mean l1 within left CR and left
SLF. Furthermore, we tested for positive correlations between
BAS-Fun scores and mean l1 as well as mean FA within left CR
and left SLF. Finally, we tested for positive correlations between BAS-Fun scores and mean MD within left ILF and left
IFOF.
2.2.4. Replication 4: Kanai, Dong, et al., (2011)
2.2.4.1. COGNITIVE FAILURES QUESTIONNAIRE AND PROCEDURE. Participants completed a Dutch version of the CFQ (Broadbent et al.,
1982).
2.2.4.2. BEHAVIORAL DATA ANALYSIS. The behavioral measure of
interest is distractibility as assessed by the CFQ. As in Kanai,
Dong, et al., (2011), we quantified distractibility by
computing the standard loadings derived from a previous
factor analysis (Wallace, Kass, & Stanny, 2002). Specifically,
we used the following 9 items: 1, 2, 3, 4, 15, 19, 21, 22, and 25.
Scores on these items were imported into R software for the
Bayesian correlation test.
2.2.4.3. ROI GENERATION. Kanai, Dong, et al. (2011) reported a
significant positive correlation between CFQ scores and GM
volume within left superior parietal lobe (SPL). Furthermore,
the authors reported a negative correlation between CFQ
scores and GM volume within left middle prefrontal cortex
(mPFC). We defined these regions as our ROIs. Dr. Kanai kindly
provided us with the spatial maps of these regions.
2.2.4.4. CORRELATIONAL ANALYSIS. For every participant, we
extracted GM volume values from all voxels contained in the
respective ROIs and averaged them. These GM volume values
were then corrected for age, gender and total GM volume
using partial correlations. The corrected mean GM volume
values were imported into R software for the Bayesian correlation test. Specifically, we tested for a positive correlation
between CFQ scores and mean GM volumes within left SPL,
and for a negative correlation between these measures within
left mPFC.
Fan's website www.sacklerinstitute.org/users/jin.fan). The
task included 2 runs of 96 trials and 20 practice trials. Each
trial began with the presentation of a fixation cross in the
center of the screen for variable durations (400, 800, 1200, or
1600 msec). Subsequently, one of three cues was presented for
100 msec: (1) no cue, (2) center cue (*, replacing fixation cross),
or (3) spatial cue (*, above or below fixation cross). This was
followed by the presentation of the target for a maximum
duration of 1700 msec, or until a response was made. The
target was an arrow in the center of a row of 5 arrows, presented either below or above the fixation cross. The flanking
arrows consisted of either (1) two congruent arrows (pointing
in the same direction as the target), (2) two incongruent arrows (pointing in the opposite direction of the target), or (3)
two lines on each side of the target (neutral). Participants were
instructed to report the direction (left or right) of the target
arrow by pressing the spatially compatible key (‘left mouse
button’ or ‘right mouse button’) with their left or right thumb.
The entire experiment took approximately 15 min.
2.2.5.2. BEHAVIORAL DATA ANALYSIS. The behavioral measures of
interest are executive control and alerting network scores,
assessing the executive control and the alerting components
of attention, respectively. We applied the same processing
steps as described by Westlye et al. (2011) prior to computing
these scores: “To remove outliers, all RTs >1500 msec and
<200 msec were removed (...). Next, since error responses are
assumed to originate from a different RT distribution than correct
responses, we only analyzed correct responses. Also, because responses following erroneous responses typically are slower than
responses following correct responses (posterror slowing), we also
removed responses following erroneous responses. Since RTs are not
normally distributed, we used median RT per condition as raw scores
for each subject. (...). (page 348).” However, we did not adjust the
component scores with the baseline RT in order to control for
an effect of age on RT, because our participants form a homogenous age group (Psychology freshmen).
Based on median RT, the executive control and alerting
scores will be computed as follows:
�
Executive control ¼ RTincongruent
Alerting ¼ ½RTno cue
RTcongruent
��
RTcongruent
RTcenter cue =RTcenter cue
For each participant, the resulting scores were imported
into R software for the Bayesian correlation test.
2.2.5.3. ROI GENERATION. For their subsample of young participants, Westlye et al. (2011) reported significant negative correlations between executive control scores and CT within left
caudal anterior cingulate cortex (ACC), left superior temporal
gyrus (STG), and right middle temporal gyrus (MTG). The
alerting scores showed a significant negative correlation with
CT within left superior parietal lobe (SPL). We defined all these
regions as our ROIs. Dr. Westlye kindly provided us with the
FreeSurfer labels of these areas.
2.2.5.4. CORRELATIONAL
2.2.5. Replication 5: Westlye et al. (2011)
2.2.5.1. ATTENTION NETWORK TEST. We used the same Attention
Network Test as Westlye et al. (2011; downloaded from Dr. Jin
ANALYSIS. For every participant, we
extracted CT values from all voxels contained in the ROIs and
averaged them. These CT measures were then corrected for
age and gender using partial correlations. The corrected mean
Please cite this article in press as: Boekel, W., et al., A purely confirmatory replication study of structural brain-behavior correlations, Cortex (2015), http://dx.doi.org/10.1016/j.cortex.2014.11.019
�9
c o r t e x x x x ( 2 0 1 5 ) 1 e1 9
3.
Right Pre-SMA - Right Striatum
Tract Strength
CT measures were imported into R software for the Bayesian
correlation test. Specifically, we tested for negative correlations between executive control scores and mean CT within
left caudal ACC, left STG and right MTG. Furthermore, we also
tested for a negative correlation between alerting scores and
mean CT within left SPL.
Results
Below we describe study-specific results for the five experiments included in the final replication attempt remaining
after study exclusion, comprising a total of 17 predicted effects. For each study, we briefly re-iterate the original findings,
followed by our predictions based on these findings. We
describe potential outlier exclusion and list the Bayes factors
in favor of the null hypothesis (BF01). Furthermore, we
describe the outcome of the additional exploratory Bayes
factor analysis that uses an informative prior distribution (cf.
Verhagen & Wagenmakers, 2014).
3.1.
r = .03
BF01 = 3.90
.0
.5
1.0
1.5
LBA Caution Parameter
(Accuracy - Speed)
Fig. 3 e Scatterplot of replication 1: Forstmann et al. (2010).
The relationship between LBA caution parameter
(quantified by taking the difference in response caution
between the accuracy and speed condition) and tract
strength between right Pre-SMA and right Striatum,
quantified by probabilistic tractography.
Replication 1: Forstmann et al. (2010)
Forstmann et al. (2010) reported that individual differences in
tract strength from right pre-SMA to right striatum predict
individual differences in control over speed and accuracy in a
perceptual decision making paradigm. The original authors
replicated their effect in an independent data set. In line with
the original authors' theorizing and results, we hypothesized
the presence of a positive correlation between pre-SMAstriatum tract strength and LBA flexibility.
Three participants did not complete the behavioral task
and were thus excluded from further analysis. Tract strengths
of 2 out of 33 participants deviated more than 2.5 SDs from the
group mean, and were thus excluded from this replication
attempt. After outlier rejection, tract strength data ranged
from .682 to .914, with a mean of .819 and a standard deviation
of .061. LBA flexibility ranged from .020 to 1.554, with a mean
of .578 and a standard deviation of .410. A one-sided Bayesian
hypothesis test for positive correlations was performed on
these data. Its result is shown in Table 2 and Fig. 3. The Bayes
factor shows that there is moderate support for the null hypothesis of no correlation. In order to provide a complete
report of the SBB correlation found here in comparison with
the original finding, Fig. S2 shows posterior probability plots of
this effect.
The additional exploratory Bayes factor analysis with
informative priors (Verhagen & Wagenmakers, 2014) shows
that the data are extremely likely to have occurred under the
null hypothesis compared to the proponent's hypothesis.
Fig. S2 (bottom) shows posteriors for this exploratory Bayes
factor analysis. The p-value indicated a failed replication.
3.2.
Replication 2: Kanai et al. (2012)
Kanai et al. (2012) showed that individual differences in the
number of Facebook friends (FBN) and real-world social
network size (SNS) are positively correlated with GM volume
in several brain areas. The original authors replicated their
effects in an independent data set. In line with the original
authors' theorizing and results, we hypothesized positive
correlations between FBN and GM volume in left MTG, right
STS, right EC, and bilateral amygdala. In addition, we hypothesized a positive correlation between SNS and GM volume in right amygdala.
One participant did not complete the FBN and two participants did not complete the SNS questionnaire, and were thus
excluded from further analysis. One participant was excluded
in 4 out of 6 Bayesian correlations, due to a GM volume measure deviating more than 2.5 SDs from the group mean. After
outlier rejection, the following summary statistics describe
our data: FBN: range: 10.0499e24.7386, mean: 17.096, sd: 3.788.
SNS: range: 1.05 to .44, mean: .650, sd: .153. GM in left
MTG: range: .411e.562, mean: .476, sd: .035. GM in right STS:
range: .336e.595, mean: .484, sd: .062. GM in right EC: range:
.521e.785, mean: .628, sd: .063. GM in left Amygdala: range:
.636e.770, mean: .707, sd: .033. GM in right Amygdala: range
.603e.772, mean: .670, sd: .035. One-sided Bayesian hypothesis
tests for positive correlations were performed on these data.
Results are shown in Table 3 and Fig. 4. In 5 out of 6 cases we
Table 2 e Results of the one-sided Bayesian hypothesis test for a positive correlation.
Data pair
ROI
Confirmatory
norig
Tract strength and LBA flexibility
Pre-SMA to striatum
9
Exploratory
nrep
rorig
rrep
BF01
Evidence cat.
BF0r
Evidence cat.
p-value
31
.93
.03
3.90
Moderate (H0)
180.20
Extreme (H0)
.431
Please cite this article in press as: Boekel, W., et al., A purely confirmatory replication study of structural brain-behavior correlations, Cortex (2015), http://dx.doi.org/10.1016/j.cortex.2014.11.019
�10
c o r t e x x x x ( 2 0 1 5 ) 1 e1 9
Table 3 e Results of the one-sided Bayesian hypothesis tests for positive correlations.
Data pair
ROI
FBN and GM volume
left MTG
right STS
right EC
left amygdala
right amygdala
SNS and GM volume
right amygdala
Confirmatory
norig
nrep
rorig
125
125
125
125
125
34
35
35
34
34
65
33
Exploratory
rrep
BF01
Evidence cat.
BF0r
Evidence cat.
p-value
.35
.35
.35
.30
.32
.18
.11
.06
.14
.02
1.73
2.66
3.51
7.76
4.35
Anecdotal (H0)
Anecdotal (H0)
Moderate (H0)
Moderate (H0)
Moderate (H0)
1.06
2.06
3.32
9.56
3.88
Anecdotal (H0)
Anecdotal (H0)
Moderate (H0)
Moderate (H0)
Moderate (H0)
.158
.261
.360
.779
.462
.26
.30
.57
Anecdotal (H1)
.27
Moderate (Hr)
.041
Fig. 4 e Scatterplots of replication 2: Kanai et al. (2012). (AeE) The relationship between the number of Facebook friends and
GM in (A) left MTG, (B) right STS, (C) right EC, (D) left amygdala, (E) right amygdala. (F) the relationship between real world
social network size and GM in the right amygdala.
Please cite this article in press as: Boekel, W., et al., A purely confirmatory replication study of structural brain-behavior correlations, Cortex (2015), http://dx.doi.org/10.1016/j.cortex.2014.11.019
�11
c o r t e x x x x ( 2 0 1 5 ) 1 e1 9
find support for the null hypothesis. The Bayes factors show
that there is moderate support for the null hypothesis in 3 out
of 6 effects (i.e., no correlations between FBN and GM volume
in right EC, and bilateral amygdala). Our data are ambiguous
with regard to the correlations between FBN and GM volume
in left MTG and right STS. In order to provide a complete
report of the SBB correlations found here in comparison with
the original findings, Figs. S3e8 show posterior probability
plots of these effects.
The additional exploratory Bayes factor analyses with
informative priors (Verhagen & Wagenmakers, 2014) show
that for two effects there is anecdotal evidence in favor of the
null hypothesis compared to the proponent's hypothesis. For
three effects there is moderate evidence in favor of H0, and for
one effect there is moderate evidence in favor of Hr, compared
to H0. Figs. S3e8 (bottom) show posteriors for these exploratory Bayes factor analyses. p-values indicate failed replications for 5 out of 6 effects. For the correlation between SNS and
GM volume in right amygdala, the p-value indicates a successful replication.
Table 4 and Fig. 5. In all cases we find support for the null
hypothesis. The Bayes factors show that there is moderate or
strong support for the null hypothesis in 3 out of 4 tests (i.e.,
no correlation between BAS-Total and l1 in left CR and SLF, no
correlation between BAS-FUN and FA in left CR and SLF, and
no correlation between Bas-FUN and l1 in left CR and SLF).
Our data are ambiguous with regard to the correlation between bas-FUN and MD in left ILF and IFOF. In order to provide
a complete report of the SBB correlations found here in comparison with the original findings, Figs. S9e12 show posterior
probability plots of hese effects.
The additional exploratory Bayes factor analyses with
informative priors (Verhagen & Wagenmakers, 2014) show
that for three effects there is extreme evidence in favor of the
null hypothesis compared to the proponent's hypothesis, and
for one effect there is moderate evidence in favor of H0. Figs.
S9e12 (bottom) show posteriors for these exploratory Bayes
factor analyses. All p-values indicate failed replications.
3.4.
3.3.
Replication 4: Kanai, Dong, et al., (2011)
Replication 3: Xu et al. (2012)
Xu et al. (2012) reported that individual differences in diffusion measures of several WM pathways are positively correlated with individual differences in the tendency to seek out
new potentially rewarding experiences (i.e., BAS-Fun) and the
sensitivity to signals of reward and non-punishment (BASTotal). In line with the original authors' theorizing and results,
we hypothesized a positive correlation between the BAS-Total
scores and l1 within left CR and left SLF, a positive correlation
between BAS-Fun and FA in left CR and SLF, a positive correlation between BAS-FUN and l1 in left CR and SLF, and a
positive correlation between BAS-Fun and MD in left ILF and
IFOF.
One participant was excluded from l1 analyses due to WM
structural measures deviating more than 2.5 SDs from the
group mean. After outlier rejection, the following summary
statistics describe our data: BAS-Total: range: 14e31, mean:
22.833, sd: 3.783. BAS-FUN: range: 5e12, mean: 7.667, sd: 1.821.
FA in left CR and SLF: range: .649e.810, mean: .736, sd: .039. l1
in left CR and SLF: range: 7.4E4 e 9.2E4, mean: 8.2E4, sd: 3.7E5.
MD in left SLF and IFOF: range: 3.9E4 e 4.7E4, mean: 4.3E4, sd:
1.8E5. One-sided Bayesian hypothesis tests for positive correlations were performed on these data. Results are shown in
Kanai, Dong, et al., (2011) reported that individual differences
in the degree of distractibility (CFQ) are correlated with GM
volume in several brain areas. In line with the original authors'
theorizing and results, we hypothesized a positive correlation
between CFQ scores and GM volume in left SPL, and a negative
correlation between CFQ and GM volumes in left mPFC.
The following summary statistics describe our data: CFQ:
range: 5e29, mean: 16.472, sd: 5.443. GM in left SPL: range:
.378e.812, mean: .545, sd: .113. GM in left mPFC: range:
.342e.693, mean: .499, sd: .101. Results of the one-sided
Bayesian hypothesis tests for correlations are shown in
Table 5 and Fig. 6. In both cases we find anecdotal support
(“not worth more than a bare mention”, Jeffreys, 1961,
Appendix B) for the null hypothesis. In order to provide a
complete report of the SBB correlations found here in comparison with the original findings, Figs. S13e14 show posterior
probability plots of these effects.
The additional exploratory Bayes factor analyses with
informative priors (Verhagen & Wagenmakers, 2014) show
that for both effects there is anecdotal evidence in favor of the
proponent's hypothesis compared to the null hypothesis. Figs.
S13e14 (bottom) show posteriors for these exploratory Bayes
factor analyses. All p-values indicate failed replications.
Table 4 e Results of the one-sided Bayesian hypothesis tests for positive correlations.
Data pair
ROI
BAS-Total and l1
Left CR and SLF
BAS-FUN and FA
Left CR and SLF
BAS-FUN and l1
Left CR and SLF
BAS-FUN and MD
Left SLF and IFOF
Confirmatory
norig
nrep
rorig
rrep
BF01
Evidence cat.
51
35
.51
.28
11.74
51
36
.52
.19
9.40
51
35
.58
.24
10.57
51
36
.51
.15
2.04
Exploratory
BF0r
Evidence cat.
p-value
Strong (H0)
249.41
Extreme (H0)
.948
Moderate (H0)
170.51
Extreme (H0)
.861
Strong (H0)
848.06
Extreme (H0)
.915
Moderate (H0)
.187
Anecdotal (H0)
4.13
Please cite this article in press as: Boekel, W., et al., A purely confirmatory replication study of structural brain-behavior correlations, Cortex (2015), http://dx.doi.org/10.1016/j.cortex.2014.11.019
�12
c o r t e x x x x ( 2 0 1 5 ) 1 e1 9
B
L1 in left CR and left SLF
FA in left CR and left SLF
A
r = -.19
BF01 = 9.40
r= -.28
BF01= 11.74
15
20
25
30
5
6
7
Bas-Total
8
9
10
11
12
10
11
12
Bas-FUN
D
L1 in left CR and left SLF
MD in left SLF and left IFOF
C
r = .15
BF01 = 2.04
r = -.24
BF01 = 10.57
5
6
7
8
9
10
11
12
5
6
Bas-FUN
7
8
9
Bas-FUN
Fig. 5 e Scatterplots of replication 3: Xu et al. (2012). (A) The relationship between Bas-total and l1 in left CR and left SLF.
(BeD) The relationship between Bas-FUN and (B) FA in left CR and left SLF, (C) l1 in left CR and left SLF, and (D) MD in left SLF
and left IFOF.
3.5.
Replication 5: Westlye et al., 2011
Westlye et al. (2011) reported that individual differences in
aspects of attention (executive control and alerting) are
correlated with cortical thickness in several brain areas. In
line with the original authors' theorizing and results, we hypothesized negative correlations between executive control
scores and CT in left caudal ACC, left STG, and right MTG. In
addition, we hypothesized a negative correlation between
alerting scores and CT in left SPL.
One participant was excluded due to cortical thickness
measures deviating more than 2.5 SDs from the group mean.
After outlier rejection, the following summary statistics
describe our data: Alerting: range: .068e.157, mean: .064, sd:
.050. Executive control: range: .057e.402, mean: .229, sd: .082.
CT in left caudal ACC: range: 2.464e2.979, mean: 2.671, sd:
.121. CT in left STG: range: 2.692e3.075, mean: 2.901, sd: .083.
CT in right MTG: range: 2.361e2.570, mean: 2.478, sd: .050. CT
in left SPL: range: 2.116e2.610, mean: 2.360, sd: .103. One-sided
Bayesian hypothesis tests for negative correlations were performed on these data. Results are shown in Table 6 and Fig. 7.
In all cases we find support for the null hypothesis. The Bayes
factors show that there is moderate support for the null hypothesis in one out of four tests (i.e., no correlation between
Table 5 e Results of the one-sided Bayesian hypothesis tests for positive correlations. In line with the prediction of a
negative correlation, the test was flipped in sign for the correlation between CFQ and GM in left mPFC.
Data pair
ROI
Confirmatory
norig
CFQ and GM volume
Left SPL
144
Left mPFC
144
nrep
36
36
Exploratory
rorig
rrep
BF01
Evidence cat.
BF0r
Evidence cat.
p-value
.38
.28
.22
.19
1.24
1.51
Anecdotal (H0)
Anecdotal (H0)
.73
.67
Anecdotal (Hr)
Anecdotal (Hr)
.102
.129
Please cite this article in press as: Boekel, W., et al., A purely confirmatory replication study of structural brain-behavior correlations, Cortex (2015), http://dx.doi.org/10.1016/j.cortex.2014.11.019
�13
c o r t e x x x x ( 2 0 1 5 ) 1 e1 9
A
B
GM in left SPL
GM in left lmPFC
r = -.19
BF01 = 1.51
r = .22
BF01 = 1.24
5
10
15
20
25
5
10
CFQ score
15
20
25
CFQ score
Fig. 6 e Scatterplots of replication 4: Kanai, Dong, et al., (2011). The relationship between CFQ score and GM in (A) left lmPFC,
and (B) left SPL.
alerting scores and CT in left SPL). Our data are ambiguous
with regard to the correlations between executive control
scores and CT in left caudal ACC, left STG, and right MTG. In
order to provide a complete report of the SBB correlations
found here in comparison with the original findings, Figs.
S15e18 show posterior probability plots of these effects.
The additional exploratory Bayes factor analyses with
informative priors (Verhagen & Wagenmakers, 2014) show
that for 3 effects there is anecdotal evidence in favor of the
proponent's hypothesis compared to the null hypothesis. For
one effect there is moderate evidence in favor of the null hypothesis. Figs. S15e18 (bottom) show posteriors for these
exploratory Bayes factor analyses. All p-values indicate failed
replications.
3.6.
Summary of results
Our results show an attenuation in effect size for almost all
effects. To illustrate this overall attenuation, Fig. 8 shows the
posterior probability distributions for all effects under scrutiny. Effect sizes seem to attenuate towards zero, or sometimes even shift to an opposite direction. However, for one
effect from Kanai et al. (2012), the effect size is similar to the
effect size found in the original study. For this effect our
exploratory analyses indicate successful replications. In
addition, three effects from the Westlye et al. (2011) study also
show similar effect sizes to the ones found in the original
investigation. For these effects, the addition of data could
narrow the posterior probability distributions, potentially
resulting in a successful replication.
4.
Discussion
In this study we set out to replicate five experiments showing
SBB correlations. We adopted a preregistered, purely confirmatory approach so as to avoid common pitfalls in neuroscience such as the use of nonindependent analysis (Vul
et al., 2009), double dipping (Kriegeskorte et al., 2009),
obscure data collection and analysis which increase falsepositive rates (Simmons et al., 2011), and confirmation and
hindsight bias on the part of the researcher (Wagenmakers
et al., 2012). The five studies we attempted to replicate contained a total of 17 SBB correlations. The results from our
confirmatory analyses show that we were unable to successfully replicate any of these 17 correlations. For all but one
of the 17 findings under scrutiny, Bayesian hypothesis tests
indicated evidence in favor of the null hypothesis. The extent
Table 6 e Results of the one-sided Bayesian hypothesis tests for positive correlations. In line with the prediction of negative
correlations, the tests were flipped in sign.
Data pair
ROI
Confirmatory
norig
Executive control and CT
left caudal ACC
132
left STG
132
right MTG
132
Alerting and CT
left SPL
132
nrep
Exploratory
rorig
rrep
BF01
Evidence cat.
BF0r
Evidence cat.
p-value
35
35
35
.21
.15
.13
.18
.14
.19
1.71
2.23
1.60
Anecdotal (H0)
Anecdotal (H0)
Anecdotal (H0)
.67
.81
.65
Anecdotal (Hr)
Anecdotal (Hr)
Anecdotal (Hr)
.153
.211
.141
35
.26
.16
8.58
Moderate (H0)
7.70
Moderate (H0)
.824
Please cite this article in press as: Boekel, W., et al., A purely confirmatory replication study of structural brain-behavior correlations, Cortex (2015), http://dx.doi.org/10.1016/j.cortex.2014.11.019
�14
c o r t e x x x x ( 2 0 1 5 ) 1 e1 9
r = -.18
BF01 = 1.71
CT in left STL
B
CT in left caudal ACC
A
r = -.14
BF01 = 2.23
EC score
EC score
C
D
CT in left SPL
CT in right MTL
r = .16
BF01 = 8.58
r = -.19
BF01 = 1.60
.05
.15
.25
.35
EC score
-.05
.00
.05
.10
.15
A score
Fig. 7 e Scatterplots of replication 5: Westlye et al. (2011). (AeC) The relationship between EC scores and CT in (A) left caudal
ACC, (B) left STL, and (C) right MTL. (D) The relationship between A scores and CT in left SPL.
of this support ranged from anecdotal (Bayes factor < 3) to
strong (Bayes factor > 10).
Our additional exploratory analyses consisted of
computing p-values, and a Bayes factor using an alternative
method recently developed by Verhagen and Wagenmakers
(2014). This method employs a more specific alternative hypothesis (termed the proponent's hypothesis), which predicts
that the effect size is similar to the effect size of the original
finding, rather than just predicting the direction of the effect.
This analysis generally provided similar or greater support for
the null hypothesis. In addition, 16 out of 17 p-values were
higher than threshold (.05), indicating unsuccessful replications. For one effect in the Kanai et al. (2012), the p-value
indicated a successful replication.
In the current replication attempt we aimed to replicate the
original experiments as closely as possible. In order to adhere
to this plan we adopted a strictly confirmatory framework by
publishing a ‘Methods and Analysis document’ online before
any data were inspected or analyzed. This M&A document
described all acquisition and analysis plans. After data analysis was complete it became clear that for some analyses,
better alternative methods are available. However, the current
replication attempt was strictly confirmatory, and thus we
choose to (1) not perform these alternative analysis methods,
and (2) make the data publicly available,1 so that other researchers might perform these alternative analysis methods
instead. It should be noted, however, that these alternative
analysis methods can no longer be presented as strictly
confirmatory.
Despite our best efforts to replicate the original experiments as closely as possible, this was partly not feasible and
partly not desired. Thus, there are a number of deviations
from the original study protocols. In the following section,
deviations will be discussed with respect to the possibility that
they contributed to spurious non-replication (i.e., a failure to
detect a true correlation) of the investigated SBB correlations.
1. The sample characteristics of the present replication
differed from the sample characteristics in the original
studies (e.g., in terms of mean age). This might have led to
systematic differences in the behavioral measures. We
addressed this issue by correcting our data for age and
gender, as was done in most original studies included in
our replication attempt. Differences in sample
1
The data set can be freely downloaded from the NITRC Neuroimaging data repository: https://www.nitrc.org/projects/
confrep2014/.
Please cite this article in press as: Boekel, W., et al., A purely confirmatory replication study of structural brain-behavior correlations, Cortex (2015), http://dx.doi.org/10.1016/j.cortex.2014.11.019
�15
c o r t e x x x x ( 2 0 1 5 ) 1 e1 9
Forstmann et al. (2010)
individual differences in
cortico-striatal tract strength
predict response caution
1
2
3
Kanai et al. (2012)
4
Individual differences in grey
matter density predict online
and offline social network size
5
6
7
8
Xu et al. (2012)
9
Individual differences in white
matter integrity predict
behavioral activation scores
10
11
Kanai et al. (2011)
12
Individual differences in grey
matter density predict
distractibility
13
Original study
14
Westlye et al. (2011)
Replication in original study
15
Individual differences in cortical
thickness predict executive control
and alerting aspects of attention
Current replication
16
17
-1.0
-.5
0
.5
1.0
r)
Fig. 8 e Summary image of our replication results. 95% confidence intervals of posterior probability distributions are shown
for the original studies (red), replications within original studies (purple), and the current independent replication attempt
(blue). individual effects: (1): LBA flexibility correlated to tract strength between pre-supplementary motor area and
striatum. (2e6): FBN correlated to grey matter volume in (2) left middle temporal gyrus, (3) right superior temporal sulcus, (4)
right entorhinal cortex, (5) left amygdala, and (6) right amygdala. (7) SNS correlated to grey matter volume in right amygdala.
(8) BAS-total correlated to l1 in left CR and SLF. (9) BAS-FUN correlated to FA in left CR and SLF. (10) BAS-FUN correlated to l1
in left CR and SLF. (11) BAS-FUN correlated to MD in left SLF and IFOF. (12e13) CFQ correlated to grey matter volume in (12)
left superior parietal lobe and (13) left middle prefrontal cortex. (14e16) Executive control correlated to cortical thickness in
(14) left caudal anterior cingulate cortex, (15) left superior temporal gyrus, and (16) right middle temporal gyrus. (17) Alerting
correlated to cortical thickness in left superior parietal lobe.
characteristics might still have non-linear effects on our
measures, or aging might have differing effects on different
brain regions. Future replication studies could take into
account the characteristics of the sample used in the
original study, and attempt to match participants in the
replication sample to participants in the original sample
more closely.
Despite the relevance of this concern, note that in cognitive
neuroscience, one often makes claims with regard to a population of humans (i.e., generalizing towards an ‘average
person’). If the reported effects are indeed non-specific to the
sample and its characteristics, there is no reason to assume a
priori that a sample with different characteristics impairs our
ability to detect the effect. For this reason we chose to acquire
Please cite this article in press as: Boekel, W., et al., A purely confirmatory replication study of structural brain-behavior correlations, Cortex (2015), http://dx.doi.org/10.1016/j.cortex.2014.11.019
�16
c o r t e x x x x ( 2 0 1 5 ) 1 e1 9
data from the current sample, and hypothesize effects as they
were described in the original studies. In order to address the
concern that (non-linear) effects of differences in sample
characteristics might still impair our ability to find these effects, additional research is needed to investigate the specific
sample characteristics for which these effects are present.
Similarly, our data differ from the data in the original
studies, for instance in terms of the spread of some of the
behavioral measures. However, these differences should have
little impact on the correlational analyses, since these are not
based on the values of the two measures of interest, but on
their linear dependence. Only one behavioral measure (i.e.,
scores on the political orientation questionnaire) did not show
enough variance in order to perform a replication attempt.
With respect to sample size, it should be noted that while
our sample size was lower than most original studies, our
results showed that in our data set, 8 out of a total of 17 hypothesized effects were contradicted with moderate or strong
levels of evidence. Thus, even though larger samples are always better than smaller samples from a pre-experimental
perspective, our Bayesian post-experimental perspective
shows that even with 36 participants it is possible to obtain
informative results.2 Nevertheless, we encourage additional
replication attempts of SBB correlations using larger sample
sizes in order to further decrease uncertainty about the
replicability of these effects.
2. The MRI data used in the present replication were acquired
using a different scanner and with slightly different scanning parameter settings than the MRI data of the original
studies. However, recent multi-site reliability studies have
shown that these differences have only little impact in
both VBM/CT (Jovicich et al., 2013; Schnack et al., 2010) and
DTI analyses (Fox et al., 2012).
3. In our TBSS analysis pipeline, another addition to the
original protocols is the registration of the ROI spatial
maps to our mean FA skeleton. We used spatial maps that
were provided by the original authors, and comprised
those voxels that correlated with the behavioral measure
in the original study. As opposed to using comparably
large atlas-based ROI, this approach minimizes the probability that the contribution of a small subset of voxels
that correlate with the behavioral measure is canceled out
due to averaging across all voxels within the atlas-based
ROI. However, in order to be able to use the spatial maps
from the original studies we had to register them into the
skeleton space common to all participants in our sample.
Following the principle of parsimony, we used affine-only
(linear) registration with 12 degrees-of-freedom (DoF),
which does not guarantee perfect alignment of even the
major tracts (Smith et al., 2006). Residual misalignments
would be reduced with the use of nonlinear registration.
2
In general, it is possible for low-power experiments to yield
diagnostic results, and for high-power experiments to yield nondiagnostic results. By conditioning on the observed data, Bayes
factors quantify the evidential impact of the information at hand,
ignoring
hypothetical
outcomes
that
did
not
occur
(Wagenmakers et al., in press; http://ejwagenmakers.com/
inpress/APowerFallacy.pdf).
However, such high-DoF alternatives might warp the images so much that the overall structure is not preserved
(Smith et al., 2006). It should be noted that, due to the
residual misalignments from the linear registration, only
a subset of the voxels contained in the registered spatial
maps was used in the correlational analysis. Only voxels,
overlapping with the mean FA skeleton were considered.
The reduction in the size of ROI would be a concern if we
had performed voxelwise statistics (Smith et al., 2006).
However, since we aggregated only one value per ROI, it is
unlikely that the smaller ROIs have led to spurious nonreplication.
On a more general note, software packages may differ
slightly in the statistical methods that they employ. These
differences can have a relevant impact on the results (e.g.,
Gronenschild et al., 2012; Rajagopalan, Yue, & Pioro, 2014).
Our data are publicly available, so that other researchers can
carry out additional analyses to probe the robustness of our
results. However, such analyses can only be partly confirmatory. Here we restrict ourselves to reporting preregistered, purely confirmatory analyses performed in FSL
(Douaud et al., 2007).
4. The use of Bayesian hypothesis tests for correlations
instead of the common null hypothesis significance tests
was motivated by two compelling advantages. First, unlike
p values the Bayes factor can quantify evidence in favor of
the null hypothesis. Second, unlike p-values, Bayes factors
do not have the tendency to over-estimate the evidence
against the null hypothesis (Edwards et al., 1963; Sellke,
Bayarri, & Berger, 2001; Wetzels et al., 2011). Note, however, that we have included p-values as exploratory tests.
Another deviation concerning the correlational analyses is
that we used one-sided instead of two-sided tests, incorporating our prior expectations about the direction of the
SBB correlations based on the findings of the original
studies. However, this approach provides more compelling
evidence (e.g., Hoijtink, Klugkist, & Boelen, 2008;
Wagenmakers, Lodewyckx, Kuriyal, & Grasman, 2010)
and should facilitate replication of true SBB correlations
and not contribute to spurious non-replication.
5. While our ROI approach is specific with regard to the
location at which we predict the SBB correlation, it does not
take anatomical variability between data sets into account.
In addition, we extracted the mean signal from the ROIs
instead of performing voxel-wise correlations within the
ROIs. This process, in combination with anatomical variability between data sets, introduces noise into the structural measures, potentially concealing the SBB correlation.
Future replication work might employ different approaches, which take into account potential anatomical
variability, while still making clear predictions with regard
to spatial locations of SBB correlations. Note that this point
emphasizes the importance of replications within the
current field of work. Given that there is random variation
in the location of the effect as well as the size of the effect,
replication studies are necessary in order to identify the
precise location of the effect in addition to the precise effect size.
Please cite this article in press as: Boekel, W., et al., A purely confirmatory replication study of structural brain-behavior correlations, Cortex (2015), http://dx.doi.org/10.1016/j.cortex.2014.11.019
�17
c o r t e x x x x ( 2 0 1 5 ) 1 e1 9
From the above discussion, one might be tempted to
conclude that most of the SBB correlations tested here simply
may not exist. However, as previously mentioned, a single
replication cannot be conclusive in terms of confirmation or
refutation of a finding. We acknowledge the recent replication
efforts within the social sciences in general and psychology
and neuroscience in particular; an excellent example is the
Reproducibility Project of the Open Science Framework
(http://openscienceframework.org/) and the first Registered
Replication Report (Alogna et al., 2014). Still, to our knowledge,
the present replication is the first independent attempt to
replicate SBB correlations, despite the considerable number of
publications on the matter. We believe that in order to
establish correlations between behavior and structural properties of the brain more firmly, it is desirable for the field to
replicate SBB correlations, preferably using preregistration
protocols and Bayesian inference methods.
Acknowledgments
We would like to acknowledge the authors of the articles we
attempted to replicate for sharing their spatial maps, without
which we would not have been able to conduct this research.
Supplementary data
Supplementary data related to this article can be found at
http://dx.doi.org/10.1016/j.cortex.2014.11.019.
Appendix A. Replication Bayes Factor
A replication Bayes factor (Verhagen & Wagenmakers, 2014)
answers the question: “Is the effect from the replication
attempt comparable to what was found before, or is it absent?”. When a correlational study is replicated, the replication Bayes factor compares evidence in favor of the null
hypothesis of no effect, H0: r ¼ 0, with the evidence in favor of
the alternative hypothesis that the effect is equal to the effect
found in the original study, H1: r ~ “posterior distribution from
the original study”
The replication Bayes factor is calculated in two steps:
In the first step the posterior distribution of the original
study is obtained, assuming a uniform prior on the correlation. The density of this posterior distribution was given by
Jeffreys (1961, pp 175, Equation 9), and simplifies:
ð1
1 ðn 1Þ
r2 Þ2
ð1 rrÞ
�
� �
p r�Yorig ¼ Z
ð1
ð1
n 3
2
1 ðn
r2 Þ2
n
rrÞ
1Þ
3
2
ppffiffi
Gðn 1Þ
2
G
n
rffiffiffi
p Gðn
2
G n
2 F1
1 1
;
2 2
þ 12 rr
1
2
1Þ
1
2
2 F1
1 1 1
; þ rr dr
2 2 2
where 2F1 is Gauss' hypergeometric function (Abramowitz &
Stegun, 1970, sec. 15).
The second step consists of the computation of the Bayes
factor by integration over this posterior distribution:
B10 ¼
Z
ð1
Z
ð1
ð1
ð1
PðYjH1 Þ
PðYjH0 Þ
1 ðn
r2 Þ2
n
1Þ
3
2
� �
�
p r�Yorig dd
rrÞ
�
�
�
p r ¼ 0�Yorig
1 ðn
r2 Þ2
n
rrÞ
1Þ
3
2
� �
�
p r�Yorig dd
which can be done by performing a one-dimensional integration. R code to perform this analysis can be found in this
link: http://www.josineverhagen.com/?page_id¼76.
references
Abramowitz, M., & Stegun, I. (1970). Handbook of mathematical
functions. New York: Dover Publications.
� Birch, S.,
Alogna, V. K., Attaya, M. K., Aucoin, P., Bahnı́k, S.,
Birt, A., et al. (2014). Registered Report: Schooler and EngstlerSchooler (1990). Perspectives on Psychological Science, 9(5),
556e578.
Banissy, M. J., Kanai, R., Walsh, V., & Rees, G. (2012). Interindividual differences in empathy are reflected in human
brain structure. NeuroImage, 62(3), 2034e2039.
Behrens, T. E. J., Johansen-Berg, H., Woolrich, M. W., Smith, S. M.,
Wheeler-Kingshott, C. A. M., Boulby, P. A., et al. (2003). Noninvasive mapping of connections between human thalamus
and cortex using diffusion imaging. Nature Neuroscience, 6(7),
750e757.
Bickart, K. C., Wright, C. I., Dautoff, R. J., Dickerson, B. C., &
Barrett, L. F. (2011). Amygdala volume and social network size
in humans. Nature Neuroscience, 14(2), 163e164.
Britten, K. H., Shadlen, M. N., Newsome, W. T., & Movshon, J. A.
(1992). The analysis of visual motion: a comparison of
neuronal and psychophysical performance. The Journal of
Neuroscience, 12(12), 4745e4765.
Broadbent, D. E., Cooper, P. F., FitzGerald, P., & Parkes, K. R. (1982).
The cognitive failures questionnaire (CFQ) and its correlates.
British Journal of Clinical Psychology, 21(1), 1e16.
Brown, S. D., & Heathcote, A. (2008). The simplest complete model
of choice response time: linear ballistic accumulation.
Cognitive Psychology, 57(3), 153e178.
Button, K. S., Ioannidis, J. P. A., Mokrysz, C., Nosek, B. A., Flint, J.,
Robinson, E. S. J., et al. (2013). Power failure: why small sample
size undermines the reliability of neuroscience. Nature Reviews
Neuroscience, 14(5), 365e376.
Campbell-Meiklejohn, D. K., Kanai, R., Bahrami, B., Bach, D. R.,
Dolan, R. J., Roepstorff, A., et al. (2012). Structure of
orbitofrontal cortex predicts social influence. Current Biology :
CB, 22(4), R123eR124.
Carver, C. S., & White, T. L. (1994). Behavioral inhibition,
behavioral activation, and affective responses to impending
reward and punishment: the BIS/BAS Scales. Journal of
Personality and Social Psychology, 67(2), 319e333.
Chambers, C. D. (2013). Registered reports: a new publishing
initiative at Cortex. Cortex, 49(3), 609e610.
Cohen, S. (1997). Social ties and susceptibility to the common
cold. JM&A: The Journal of the American Medical Association,
277(24), 1940.
Dale, A. M., Fischl, B., & Sereno, M. I. (1999). Cortical surface-based
analysis. I. Segmentation and surface reconstruction.
NeuroImage, 9(2), 179e194.
Please cite this article in press as: Boekel, W., et al., A purely confirmatory replication study of structural brain-behavior correlations, Cortex (2015), http://dx.doi.org/10.1016/j.cortex.2014.11.019
�18
c o r t e x x x x ( 2 0 1 5 ) 1 e1 9
Dale, A. M., & Sereno, M. I. (1993). Improved Localization of
cortical Activity by combining EEG and MEG with MRI cortical
surface reconstruction: a linear approach. Journal of Cognitive
Neuroscience, 5(2), 162e176.
Davis, M. H. (1980). A multidimensional approach to individual
differences in empathy. JSAS Catalog of Selected Documents in
Psychology, 10, 85e103.
Dienes, Z. (2008). Understanding psychology as a Science: An
introduction to scientific and statistical inference. New York:
Palgrave MacMillan.
Douaud, G., Smith, S., Jenkinson, M., Behrens, T., JohansenBerg, H., Vickers, J., et al. (2007). Anatomically related grey and
white matter abnormalities in adolescent-onset schizophrenia.
Brain : A Journal of Neurology, 130(Pt 9), 2375e2386.
Edwards, W., Lindman, H., & Savage, L. J. (1963). Bayesian
statistical inference for psychological research. Psychological
Review, 70(3), 193e242.
Fan, J., McCandliss, B. D., Sommer, T., Raz, A., & Posner, M. I.
(2002). Testing the efficiency and independence of attentional
networks. Journal of Cognitive Neuroscience, 14(3), 340e347.
Fischl, B., & Dale, A. M. (2000). Measuring the thickness of the
human cerebral cortex from magnetic resonance images.
Proceedings of the National Academy of Sciences of the United States
of America, 97(20), 11050e11055.
Fischl, B., van der Kouwe, A., Destrieux, C., Halgren, E.,
�gonne, F., Salat, D. H., et al. (2004). Automatically
Se
parcellating the human cerebral cortex. Cerebral Cortex, 14(1),
11e22.
Fischl, B., Liu, A., & Dale, A. M. (2001). Automated manifold
surgery: constructing geometrically accurate and topologically
correct models of the human cerebral cortex. IEEE Transactions
on Medical Imaging, 20(1), 70e80.
Fischl, B., Salat, D. H., Busa, E., Albert, M., Dieterich, M.,
Haselgrove, C., et al. (2002). Whole brain segmentation:
automated labeling of neuroanatomical structures in the
human brain. Neuron, 33(3), 341e355.
Fischl, B., Salat, D. H., van der Kouwe, A. J. W., Makris, N.,
�gonne, F., Quinn, B. T., et al. (2004). Sequence-independent
Se
segmentation of magnetic resonance images. NeuroImage,
23(Suppl 1), S69eS84.
Fischl, B., Sereno, M. I., & Dale, A. M. (1999). Cortical surface-based
analysis. II: Inflation, flattening, and a surface-based
coordinate system. NeuroImage, 9(2), 195e207.
Fischl, B., Sereno, M. I., Tootell, R. B., & Dale, A. M. (1999). Highresolution intersubject averaging and a coordinate system for
the cortical surface. Human Brain Mapping, 8(4), 272e284.
Fleming, S. M., Weil, R. S., Nagy, Z., Dolan, R. J., & Rees, G. (2010).
Relating introspective accuracy to individual differences in
brain structure. Science, 329(5998), 1541e1543.
€ fer, A., Neumann, J.,
Forstmann, B. U., Anwander, A., Scha
Brown, S., Wagenmakers, E.-J., et al. (2010). Cortico-striatal
connections predict control over speed and accuracy in
perceptual decision making. Proceedings of the National Academy
of Sciences, 107(36), 15916e15920.
Fox, R. J., Sakaie, K., Lee, J. C., Debbins, J. P., Liu, Y., Arnold, D. L.,
et al. (2012). A validation study of multicenter diffusion tensor
imaging: reliability of fractional anisotropy and diffusivity
values. American Journal of Neuroradiology, 33(4), 695e700.
Goldacre, B. (2009). Bad science. London: Fourth Estate.
Gold, J. I., & Shadlen, M. N. (2007). The neural basis of decision
making. Annual Review of Neuroscience, 30, 535e574.
Good, C. D., Johnsrude, I. S., Ashburner, J., Henson, R. N.,
Friston, K. J., & Frackowiak, R. S. (2001). A voxel-based
morphometric study of ageing in 465 normal adult human
brains. NeuroImage, 14(1 Pt 1), 21e36.
Graham, J., Haidt, J., & Nosek, B. A. (2009). Liberals and
conservatives rely on different sets of moral foundations.
Journal of Personality and Social Psychology, 96(5), 1029e1046.
Gronenschild, E. H., Habets, P., Jacobs, H. I., Mengelers, R.,
Rozendaal, N., van Os, J., et al. (2012). The effect of FreeSurfer
version, workstation type, and Macintosh operating system
version on anatomical volume and cortical thickness
measurements. PLoS One, 7(6).
Groot, A. D. (1969). Methodology: Foundations of inference and research
in the behavioral sciences. The Hague: Mouton.
Han, X., Jovicich, J., Salat, D., van der Kouwe, A., Quinn, B.,
Czanner, S., et al. (2006). Reliability of MRI-derived
measurements of human cerebral cortical thickness: the
effects of field strength, scanner upgrade and manufacturer.
NeuroImage, 32(1), 180e194.
Hoijtink, H., Klugkist, I., & Boelen, P. A. (2008). An introduction to
Bayesian evaluation of informative hypotheses (pp. 1e3). New
York, NY: Springer (New York).
Ioannidis, J. P. A. (2005). Why most published research findings
are false. PloS Med, 2(8).
Ioannidis, J. P. A. (2012). Why science is not necessarily selfcorrecting. Perspectives on Psychological Science, 7(6), 645e654.
Jeffreys, H. (1961). Theory of probability. Oxford, UK: Oxford
University Press.
Jenkinson, M., & Smith, S. (2001). A global optimisation method
for robust affine registration of brain images. Medical Image
Analysis, 5(2), 143e156.
John, L. K., Loewenstein, G., & Prelec, D. (2012). Measuring the
prevalence of questionable research practices with incentives
for truth telling. Psychological Science, 23(5), 524e532.
Jovicich, J., Czanner, S., Greve, D., Haley, E., van der Kouwe, A.,
Gollub, R., et al. (2006). Reliability in multi-site structural MRI
studies: effects of gradient non-linearity correction on
phantom and human data. NeuroImage, 30(2), 436e443.
�sJovicich, J., Marizzoni, M., Sala-Llonch, R., Bosch, B., Bartre
Faz, D., Arnold, J., et al. (2013). Brain morphometry
reproducibility in multi-center 3T MRI studies: a comparison
of cross-sectional and longitudinal segmentations.
NeuroImage, 83, 472e484.
Kanai, R., Bahrami, B., & Rees, G. (2010). Human parietal cortex
structure predicts individual differences in perceptual rivalry.
Current Biology, 20(18), 1626e1630.
Kanai, R., Bahrami, B., Roylance, R., & Rees, G. (2012). Online social
network size is reflected in human brain structure. Proceedings.
Biological Sciences/the Royal Society, 279(1732), 1327e1334.
Kanai, R., Carmel, D., Bahrami, B., & Rees, G. (2011). Structural and
functional fractionation of right superior parietal cortex in
bistable perception. Current Biology, 21(3), 106e107.
Kanai, R., Dong, M. Y., Bahrami, B., & Rees, G. (2011).
Distractibility in daily life is reflected in the structure and
function of human parietal cortex. Journal of Neuroscience,
31(18), 6620e6626.
Kanai, R., Feilden, T., Firth, C., & Rees, G. (2011). Political
orientations are correlated with brain structure in young
adults. Current Biology: CB, 21(8), 677e680.
Kanai, R., & Rees, G. (2011). The structural basis of inter-individual
differences in human behavior and cognition. Nature Reviews
Neuroscience, 12(4), 231e242.
Kass, R. E., & Raftery, A. E. (1995). Bayes factors. Journal of the
American Statistical Association, 90, 773e795.
King, A. V., Linke, J., Gass, A., Hennerici, M. G., Tost, H.,
Poupon, C., et al. (2012). Microstructure of a three-way
anatomical network predicts individual differences in
response inhibition: a tractography study. NeuroImage, 59(2),
1949e1959.
Kriegeskorte, N., Simmons, W. K., Bellgowan, P. S. F., & Baker, C. I.
(2009). Circular analysis in systems neuroscience: the dangers
of double dipping. Nature Neuroscience, 12(5), 535e540.
Lee, M. D., & Wagenmakers, E. J. (2013). Bayesian modeling for
cognitive science: A practical course. Cambridge: Cambridge
University Press.
Please cite this article in press as: Boekel, W., et al., A purely confirmatory replication study of structural brain-behavior correlations, Cortex (2015), http://dx.doi.org/10.1016/j.cortex.2014.11.019
�c o r t e x x x x ( 2 0 1 5 ) 1 e1 9
Lewis, G. J., Kanai, R., Bates, T. C., & Rees, G. (2012). Moral values
are associated with individual differences in regional brain
volume. Journal of Cognitive Neuroscience, 24(8), 1657e1663.
MacArthur, D. (2012). Methods: face up to false positives. Nature,
487(7408), 427e428.
Pashler, H., & Harris, C. R. (2012). Is the replicability crisis
overblown? Three arguments examined. Perspectives on
Psychological Science, 7(6), 531e536.
Pashler, H., & Wagenmakers, E.-J. (2012). Editors' introduction to
the special section on replicability in psychological science a
crisis of confidence? Perspectives on Psychological Science, 7(6),
528e530.
Rajagopalan, V., Yue, G. H., & Pioro, E. P. (2014). Do preprocessing
algorithms and statistical models influence voxel-based
morphometry (VBM) results in amyotrophic lateral sclerosis
patients? A systematic comparison of popular VBM analytical
methods. Journal of Magnetic Resonance Imaging, 40(3), 662e667.
Reuter, M., Rosas, H. D., & Fischl, B. (2010). Highly accurate inverse
consistent registration: a robust approach. NeuroImage, 53(3),
1181e1196.
Reuter, M., Schmansky, N. J., Rosas, H. D., & Fischl, B. (2012).
Within-subject template estimation for unbiased longitudinal
image analysis. NeuroImage, 61(4), 1402e1418.
Rosenthal, R. (1979). The file drawer problem and tolerance for
null results. Psychological Bulletin, 86(3), 638e641.
Rouder, J. N., Morey, R. D., Speckman, P. L., & Province, J. M. (2012).
Default Bayes factors for ANOVA designs. Journal of
Mathematical Psychology, 56(5), 356e374.
Rouder, J. N., Speckman, P. L., Sun, D., Morey, R. D., & Iverson, G.
(2009). Bayesian t tests for accepting and rejecting the null
hypothesis. Psychonomic Bulletin & Review, 16(2), 225e237.
Schnack, H. G., van Haren, N. E. M., Brouwer, R. M., van Baal, G. C. M.,
Picchioni, M., Weisbrod, M., et al. (2010). Mapping reliability in
multicenter MRI: Voxel-based morphometry and cortical
thickness. Human Brain Mapping, 31(12), 1967e1982.
�gonne, F., Dale, A. M., Busa, E., Glessner, M., Salat, D.,
Se
Hahn, H. K., et al. (2004). A hybrid approach to the skull
stripping problem in MRI. NeuroImage, 22(3), 1060e1075.
�gonne, F., Pacheco, J., & Fischl, B. (2007). Geometrically accurate
Se
topology-correction of cortical surfaces using nonseparating
loops. IEEE Transactions on Medical Imaging, 26(4), 518e529.
Sellke, T., Bayarri, M. J., & Berger, J. O. (2001). Calibration of r
values for testing precise null hypotheses. The American
Statistician, 55(1), 62e71.
Simmons, J. P., Nelson, L. D., & Simonsohn, U. (2011). Falsepositive psychology undisclosed flexibility in data collection
and analysis allows presenting anything as significant.
Psychological Science, 22(11), 1359e1366.
Sled, J. G., Zijdenbos, A. P., & Evans, A. C. (1998). A nonparametric
method for automatic correction of intensity nonuniformity in
MRI data. IEEE Transactions on Medical Imaging, 17(1), 87e97.
Smith, S. M. (2002). Fast robust automated brain extraction.
Human Brain Mapping, 17(3), 143e155.
Smith, S. M., Jenkinson, M., Johansen-Berg, H., Rueckert, D.,
Nichols, T. E., Mackay, C. E., et al. (2006). Tract-based spatial
statistics: voxelwise analysis of multi-subject diffusion data.
NeuroImage, 31(4), 1487e1505.
Smith, S. M., Jenkinson, M., Woolrich, M. W., & Beckmann, C. F.
(2004). Advances in functional and structural MR image
analysis and implementation as FSL. NeuroImage, 23(Suppl 1),
S208eS219.
19
Stileman, E., & Bates, T. (2007). Construction of the social network
score (SNS) questionnaire for undergraduate students, and an
examination of the pre-requisites for large social networks in
humans. Unpublished undergraduate thesis. See http://hdl.
handle.net/1842/2553.
Tuch, D. S., Salat, D. H., Wisco, J. J., Zaleta, A. K., Hevelone, N. D.,
& Rosas, H. D. (2005). Choice reaction time performance
correlates with diffusion anisotropy in white matter pathways
supporting visuospatial attention. Proceedings of the National
Academy of Sciences of the United States of America, 102(34),
12212e12217.
Verhagen, A. J., & Wagenmakers, E.-J. (2014). Bayesian tests to
quantify the result of a replication attempt. Journal of
Experimental Psychology: General, 143, 1457e1475.
Vul, E., Harris, C., Winkielman, P., & Pashler, H. (2009). Puzzlingly
high correlations in fMRI studies of emotion, personality, and
social cognition. Perspectives on Psychological Science, 4(3),
274e290.
Wagenmakers, E. J. (2007). A practical solution to the pervasive
problems of p values. Psychonomic Bulletin & Review, 14(5),
779e804.
Wagenmakers, E.-J., Lodewyckx, T., Kuriyal, H., & Grasman, R.
(2010). Bayesian hypothesis testing for psychologists: a
tutorial on the Savage-Dickey method. Cognitive Psychology,
60(3), 158e189.
Wagenmakers, E.-J., Verhagen, J., Ly, A., Bakker, M., Lee, M. D.,
Matzke, D., et al. (2015). A power fallacy. Behavior Research
Methods (in press).
Wagenmakers, E.-J., Wetzels, R., Borsboom, D., & van der
Maas, H. L. J. (2011). Why psychologists must change the way
they analyze their data: the case of psi: comment on Bem
(2011). Journal of Personality and Social Psychology, 100(3),
426e432.
Wagenmakers, E.-J., Wetzels, R., Borsboom, D., van der
Maas, H. L. J., & Kievit, R. A. (2012). An agenda for purely
confirmatory research. Perspectives on Psychological Science, 7(6),
632e638.
Wallace, J. C., Kass, S. J., & Stanny, C. J. (2002). The cognitive
failures questionnaire revisited: dimensions and correlates.
The Journal of General Psychology, 129(3), 238e256.
Wallach, H., & O'Connel, D. N. (1953). The kinetic depth effect.
Journal of Experimental Psychology, 45(4), 205e217.
Westlye, L. T., Grydeland, H., Walhovd, K. B., & Fjell, A. M. (2011).
Associations between regional cortical thickness and
attentional networks as measured by the attention network
test. Cerebral Cortex, 21(2), 345e356.
Wetzels, R., Matzke, D., Lee, M. D., Rouder, J. N., Iverson, G. J., &
Wagenmakers, E. J. (2011). Statistical evidence in experimental
psychology: an empirical comparison using 855 t tests.
Perspectives on Psychological Science, 6(3), 291e298.
Wetzels, R., & Wagenmakers, E.-J. (2012). A default Bayesian
hypothesis test for correlations and partial correlations.
Psychonomic Bulletin & Review, 19(6), 1057e1064.
Wolfe, J. M. (2013). Registered reports and replications in
attention, perception, & psychophysics. Attention, Perception, &
Psychophysics, 75(5), 781e783.
Xu, J., Kober, H., Carroll, K. M., Rounsaville, B. J., Pearlson, G. D., &
Potenza, M. N. (2012). White matter integrity and behavioral
activation in healthy subjects. Human Brain Mapping, 33(4),
994e1002.
Please cite this article in press as: Boekel, W., et al., A purely confirmatory replication study of structural brain-behavior correlations, Cortex (2015), http://dx.doi.org/10.1016/j.cortex.2014.11.019
�
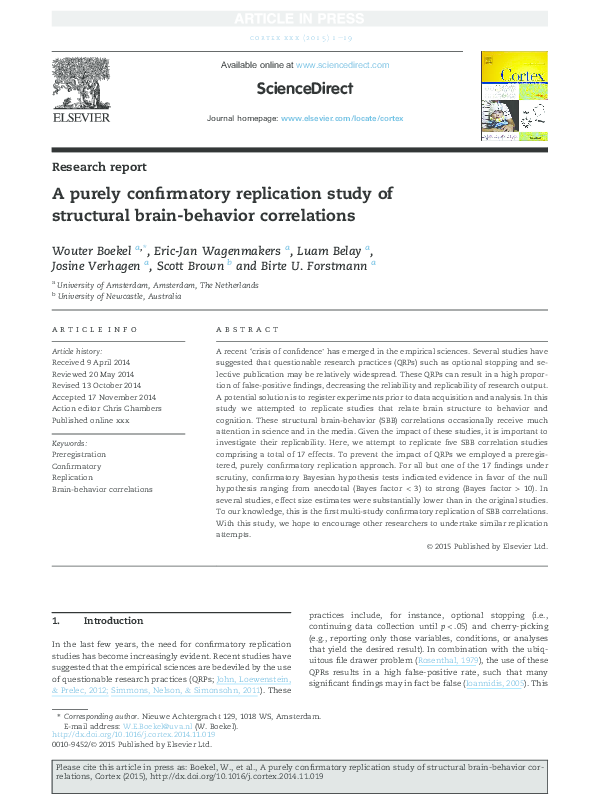
 Josine Verhagen