IpNose: Electronic nose for remote bad odour monitoring system in landfill sites
Alex Perera*, Toni Pardo*, Teodor Šundiæ*, Ricardo Gutierrez-Osuna+,
Santiago Marco*, Jacques Nicolas∇
Computer Science Department
Sistemes de instrumentacio i comm. Fondation Universitaire luxembourgeoise
Wright State University,
Departament d'Electrònica,
Environmental Monitoring
Dayton, Ohio, USA (+)
Universitat de Barcelona, Barcelona, Spain (*)
Belgium(∇)
Electronic noses are intelligent instruments that are able to
classify and quantify different gas/odours. Here we suggest the
integration of a small form factor computer inside the electronic
nose. This concept allows us to easily provide remote connectivity,
large data storage and complex signal processing. The evolution of
this technology will permit distributed sensing with applications to
agriculture and environment. Proposed instrument allows incoming
connections for remote control of bad odours in landfill sites.
Preliminary approach to this application using commercial sensors
and mixture model pattern recognition scheme is exposed.
1 Introduction
Sensors for use in electronic noses need partial selectivity, mimicking the responses
of olfactory receptors in the biological nose. In the simplest instrumental approach to an
electronic nose, we may find sampling, filtering and sensors module, signal transduction
and acquisition, data preprocessing, feature extraction and feature classification. In
conventional systems the processing module is provided as a personal computer and is
separated from the rest of the system. This module is responsible for data preprocessing,
feature extraction and classification. Recent trends in portable computing designs imply
the use of embedded systems at low cost and size. This kind of systems can be applied
not only to desktop instruments but also at-line analyzers, arrays of distributed
instruments over a network, or remotely operated instruments via phone calls to a host
computer.
The applications of electronic noses in environment and agriculture fields are
generally aiming to substitute slow and laborious laboratory analysis by fast and easy
in-field electronic nose analysis. There are many examples of these applications like
pollen detection[KAL97], evaluation of malodour in farms[BYU97], wastewater
treatment control[ROM00] or grain spoilage[MAG00] [JON97]. Most of these applications
show the potential use of electronic noses in order to determine the fungal activity
assessment. In the case of grain spoilage, for instance, the odour of grains is in many
cases the primary criteria of quality classification. However human smelling should be
avoided, not only because is a subjective parameter but also some toxins or mould
spores may be hazardous to the health. The use of electronic nose technology in this
concrete application would control the quality of grain in different silos for different
grain. On the other hand, distributed sensing technology provides a centralised
framework in the measurement, analysis and control of the different storage silos. Other
application fields are air quality maps over cities by measuring not only contaminant
gases like CO, but pre-trained odour quality indices correlated to comfort feeling.
In this paper an instrument capable of realize remote and periodic odour analysis in is
proposed . This instrument provides an powerful multi-algorithm pattern recognition
engine, including mixture model based classifier. This work evaluates the possible
�application of ipNose like electronic nose for landfill sites. In some situations
compounds produced are very annoying for neighbourhoods and operators are forced to
personally visit landfill sites to prevent or check dangerous degrees of decomposition.
Exploratory work for bad odour in landfill sites using a test bench of commercial metal
oxide sensors will be exposed comparing a lazy algorithm like k-nn with ipNose like
Gaussian Mixture Models. This is a complex problem as environmental conditions are
strong in in-field operation. Many atmospheric phenomena like wide temperature
oscillations or rain, can affect the behaviour of the sensors and therefore the classifier.
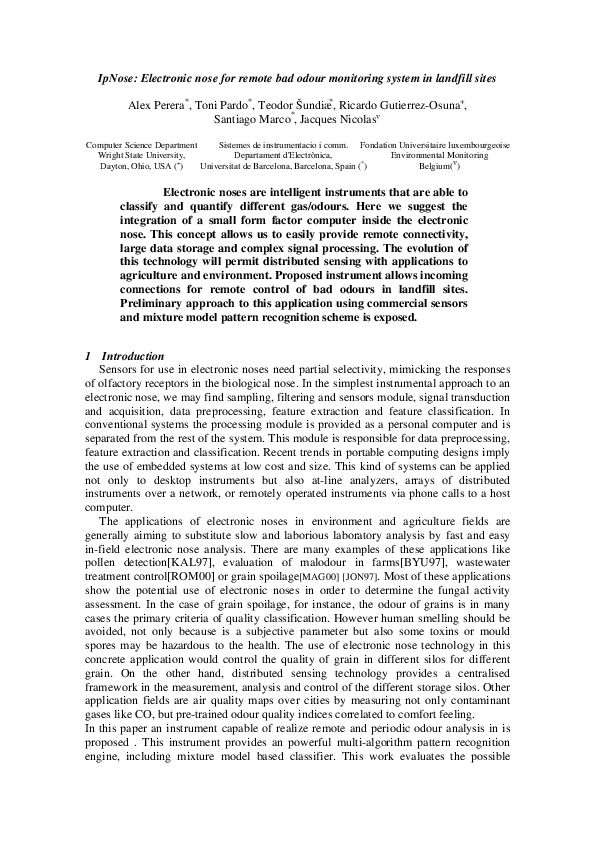
2 IpNose Instrument
University of Barcelona in
collaboration with Wright State
University has developed an
electronic nose featuring remote
connectivity (see fig 1) [PER01].
Design copes with two main
objectives: provides a powerful
signal processing platform for
temperature modulated metal oxide
sensors and increases electronic
nose features by implementing
network/remote connectivity to the
Fig. 0: ipNose electronic nose
analyzer.
Remote Connectivity
Current design of the system provides a versatile platform to be remote controlled or
reprogrammed. Once a connection is established commands can be sent to the
instrument in order to execute sampling or training, getting current values of sensors,
controlling the pump and valves or even reprogram the instrument. These features
permit to monitor analysis readings, extracting or modifying internal database contents
or even changing signal processing software of a distributed array of electronic noses,
all from the same workstation or computer. Although the whole system is remotely
operated via TCP/IP under client/server structure, it can send active signals to external
systems like emails to the user when samples are getting out of specifications. Another
COM
COM/Modem..
Ethernet
In 1
GNU/Linux
Control Software
LAN, WAN,
Internet
LCD
..
Manifold
In 1
DAC/ADC sys
Cond. Electron.
In 1
Display
DSP
µP
RAM
Solid State
Disk
Embedded PC
Chambers
Pump
Fig 2. ipNose system overview
�possibility is to set up the instrument to phone a remote host computer with the help of a
modem, permitting the system to work in remote sites. The inverse scheme is allowed
as well, and the instrument can accept incoming phone calls to generate analysis reports
Signal(V)
Instrument Design
An overview of the design is shown in fig. 2. The instrument can control up to three
sensor modules. Each module consists of four metal oxide sensors, one temperature
sensor, and signal conditioning/excitation electronics on a custom printed circuit board
(PCB). The sensors and a stainless steel chamber are mounted directly onto the PCB.
The electronics can interface various commercial sensors, including FIS, FIGARO,
MICROSENS, MICS or CAPTEUR via configuration jumpers, although in the current
prototype only FIS sensors are used. These sensors (SB series) present an internal
structure based on a micro-bead of sensing material deposited over a coil. This
structure provides the sensors with a fast thermal response to a modulating heater
voltage, a very practical feature for the purpose of increasing sample throughput.
The flow injection system consists of a multi-channel manifold with one electrovalve for each intake port. The software controls both the order and the aperture time of
each valve and the pump, as defined in a configuration file. The reference channel
includes a zero-filter for air cleaning. The output of the manifold connects directly to
the sensor chamber. The system operates in a vacuum mode by means of a miniature
pump connected downstream for the sensor chamber. A check valve is placed between
the chamber and the pump to
Feature Selection
prevent backflow.
6
The embedded computer
4
represents the core of the system.
A
PC/104
data-acquisition
2
module is used for acquiring the
signals of the sensors and
0
generate excitation waveforms. A
-2
separate
relay
module
is
responsible for driving the pump
-4
and the solenoid valves. The use
of a Linux open source operating
-6
system provides the instrument
with classical UNIX features like
250
300
350
400
Tim
e
(
s
)
multitasking, shared libraries,
TCP/IP networking or even
Fig 3. Pulsed Modulation feature extraction example in
multi-user
capabilities. ipNose
Configuration parameters for the
instrument are stored in internal text files. These configuration files allow the user to
define various parameters, including the number and duration of the cycles, sampling
rates, cycle configuration (pumps, valves, PWM channels...), and arbitrary heating
profiles. The use of high-end computing hardware allows complex multivariate analysis
of high-dimensional patterns such as those typical of temperature-modulated metaloxide sensors. Arbitrary temperature profiles can be easily programmed or uploaded
into the system as text files (e.g., generated with MATLAB). An example of a particular
programmed feature extraction and square heating profile is shown in fig 3. The use of
solid-state hard drives allows the system to be used as a huge capacity smell logger, a
�portable intelligent volatile detector or a smell/data-acquisition instrument for
processing data in the laboratory.
Value of T 2
3 Landfill preliminary data
In following section a test is done in
order to evaluate feasibility of an array of
commercial metal oxide sensors for
landfill site mal odour detection. Results
presented correspond to application of
gaussian mixture model [MCLA88]
computed against FIGARO sensors array
data. The aim of this section is to study the
feasibility of remote bad odour detectors in
landfill sites with the signal processing
available in ipNose. This is a non trivial Fig 4 Experimental set up picture
problem as long as any in-field instrument
has to suffer strong environmental
conditions that will surely introduce strong variability in sensor array signals.
Experimental Set up
Here, dataset gently provided by FUL was collected during week at the end of July
and three days at beginning of August. All measurements were taken from 9 am to 18
pm. Also assessment made by the operator nose and values coming from CH4 and H2S
analysers are provided with data. Some meteorological conditions are measured, like
wind speed, wind direction, rainfall, temperature and atmospheric pressure in a weather
station.
Electronic nose, gas analysers and weather station are locate in the same shelter at
the periphery of the landfill, 10 meters far from the selective odour sources in the East
direction. Target odours are biogas odour and waste odour.
The electronic nose used is an array of six Figaro sensors placed in a tight metal
enclosure (16x5cm). Electronics provide temperature lectures at two points inside the
chamber by means of thermistors (NTC
Value of T 2 with 95 Percent Lim it Based on 4 PC Model
type). One sensor is located inside and the
50
other one is located outside sensor
chamber. Both electronic nose and gas
40
analysers collect ambient air from 3.5
meters high PFA tubing. Only operator
30
nose smells in the shelter. The electronic
nose cycle is as follows: reference air
20
coming from a Tedlar bag is taken among
5 minutes, and ambient air sampled during
10
another 5 minutes at 150ml/min. Tedlar
0
bags contained odourless synthetic air,
0
20
40
60
80
100
filled at laboratory. Some data (last 14
Sample Number
samples)
were
obtained
without Fig. 5 Hotelling confidence statistics for dataset
regeneration with pure air prior
measurement.
Data Analysis
�We build features dataset using all six sensor signals and two temperatures. A first
sight to data distribution is done by means of PCA, showing that most information is
contained in the first five components as shown in table II.
Table I Percentage Variance Captured by PCA. All data
Principal
Component
Number
1
2
3
4
5
6
7
8
As shown in fig. 6, were T2 are plotted values
against confidence limit we observe that there
is a severe outlier corresponding to last sample.
This sample is manually removed although T2
defines a distance measure of the sample to
multivariate mean, and thus, within PCA plane.
% Variance
Captured
Total
60.59
84.88
95.90
98.24
99.45
99.75
99.97
100.00
% Variance
Captured
60.59
24.30
11.02
2.34
1.21
0.30
0.22
0.03
Percentual
The distribution of data after removing the
outlier is show in scores plot, fig 7. It can be
seen that although some data is homogeneously
distributed like biogas samples, waste odour is somehow confused with odourless air.
To show the behaviour of GMM over this dataset we also plot the distribution that
would be created when using two
100
principal components (84% variance
Gmm
Knn
95
captured). A picture of the component
distribution can be also observed in fig
90
6b.
85
Data is mean centred, scaled to unit
80
variance and PCA is used as first step to
slightly reduce the dimensionality of
75
sensor space to a d=5 dimension space.
70
The optimum number of components d is
65
determined with help of leave-one-out
cross validation, as shown in fig. 6. Top
60
2
3
4
5
6
7
8
Number of PC
classification performance (86.4% in
training set) is found when including all
Fig. 6 Classifier performance with validation
sensor resistance values and both
data (leave one out)
temperature sensors and in feature space.
A significant dependence of GMM
performance with the number of principal components is found. This is a normal
phenomena related to the peaking phenomenon [JAIN87] and could be improved using
S c o res for PC# 1 versus PC# 2
MultiClass Mixture Model using 2 PC
3
b
Scores on PC# 2
w
o
oo
1
b
o
w
w
o ow
oo
w
w
ww
w
o
o
w
w
wo
o
o
o
-1
o
w
1
-2.5
w
-2
2
-2
o
w
-3
-4
1
-1.5
o
w w
w
2
-0.5
ooo
o o
w
w
o
1
0
w
w
1
0.5
w
w
-2
o
w
w
-1
3
2
1
w
w w
wwww w w
ww
o
w
w
1.5
b
b
b
w
w
0
b
b
b
3
2
bb
b
2
0
S c o res on PC# 1
2
4
-3
-2
-1
0
1
2
Fig. 7 PCA Score Plot for 2 principal components and corresponding mixture model
3
�discriminant analysis instead of principal component analysis as dimensionality
reduction step.
Resulting confusion matrix for leave one out validation is shown in table II.
Table II Confusion Matrix for landfill data(VS=Validation Set, TS=Training Set)
Predicted\Real
(VS)Waste
(VS)Odourless
(VS)BioGas
(TS)Waste
(TS)Odourless
(TS)BioGas
3-NN (VR=85.1%, TR=88.9%)
Waste
Odourless
38
4
6
21
1
0
40
4
3
21
1
0
BioGas
1
0
10
1
0
10
GMM (VR=86.4%, TR=91.3%)
Waste
Odourless
BioGas
42
6
2
3
19
0
0
0
9
38
2
0
6
23
0
0
0
11
Note than although results are similar the resources necessaries to calculate the EM loop
both in memory and computationally are quite lower than for K-nn. Using K-nn we are
forced to have all data table in memory while using a Mixture Model only an easy
parametric set of normal distributions is hold on memory.
4 Conclusions
An exploration of the landfill malodour detection problem is done. Preliminary test
using six commercial metal oxide sensors shows that on-field discrimination of biogas
and waste odour can be done with signal processing available in ipNose instrument.
Mixture models predicts a multi-modal probability density function which adapts
reasonably to the variability produced by wind direction, temperature and humidity
variation. Further work will comprise real remote test using ipNose and temperature
modulation techniques to reduce variability in data.
5 References
[PER01]
A. Perera, R. Gutierrez-Osuna, S. Marco “ipNose: a portable electronic
nose nose based on embedded technology for intensive computation and time dependent
signal processing” International Symposium Of Electronic Noses (ISOEN2001) abs.
1082
[KAL97]
E. Kalman, F. Winquist, I. Lundström “A new pollen detection method
based on an electronic nose” Atmospheric environment. Vol. 31 No. 11, (1997) 17151719.
[BYU97]
H. G. Byun, K. C. Persaud, S. M. Khaffaf, P. J. Hobbs, T. H.
Misselbrook “Aplication of unsupervised clustering methods to the assessment of
malodour in agriculture using an array of conducting polymer odour sensors”
Computers and Electronics in Agriculture 17 (1997) 233-247
[ROM00]
A. C. Romain, J. Nicolas, V. Wiertz, J. Maternova, P. André “Use of
simple tin oxide sensors array to identify five malodours collected in the field” Sensors
and Actuators B 62 (2000) 73-79
[MAG00]
N. Magan, P. Evans “Volatiles as an indicator of fungal activity and
differentiation between species, and the potential use of electronic nose technology for
early detection of grain spoilage” J. of Stored Products Research 36 (2000) 319-340
[JON97]
A. Jonsson, F. Winquist, J. Schnürer, H. Sundgre, I. Lunström
“Electronic nose for microbial quality classification of grains” Int. Journal of Food
Microbiology 35 (1997) 187 193
[MCLA88] McLachlan G. J., amd Basford K. E. “Mixture Models: Inference and
Applications to Clustering.” New York: Marcel Dekker, 1988
�
 Santiago Marco