Indian Journal of Economics and Development, Vol 3 (8), August 2015
ISSN (online): 2320-9836
Eco o ic evaluatio of Foy’s lake, Chittago g usi g travel cost
method
Kamrul Islam *1, Sahadeb Chandra Majumder2
1
Graduate student at Institute of Forestry and Environmental Science (IFES), University of Chittagong, Chittagong-4331,
Bangladesh.
2
Undergraduate student at Institute of Forestry and Environmental Science (IFES), University of Chittagong, Chittagong4331, Bangladesh.
1
2
ksujonifescu@gmail.com , sahadeb.ifescu@gmail.com
Abstract
Background: Economic evaluation of non- a ket goods is halle gi g a d a t e al ulated usi g t aditio al
ethod. I this stud , T a el Cost Method TCM as used to e aluate the e o o i alue of Fo s Lake of
Chittagong.
Methods: A total of 200 respondents from the visitor of this lake were interviewed on the basis of day of visit (week
day: 100, weekend: 100) using structured questionnaire. The collected data were analyzed using SPSS v 20 and R v
3.2.1
Findings: A multiple regression model was developed using the analysis which had a R2 value of 0.084. Family size and
Total cost of visitors were found significant with a p- alue of . . The esti ated alue fo Fo s Lake fo
as
worth 294165270 BDT (Bangladeshi Taka) (or 3792034.49 US $).
Applications: By applying the model, derived from this study can be used to assess the economic value by revealed
preference method of artificial lakes in this region.
Keywords: Economic Evaluation, Travel Cost Method, Revealed P efe e e, Fo s Lake
1. Introduction
Fo s Lake is o e of the i po ta t a -made lakes in Chittagong, Bangladesh that was made by building a dam
over the stream that descended from the slopes in the northern region of Chittagong in 1924. This artificial lake was
created with an aim to provide water to the residence of railway colony [1]. But at present, to meet the increasing
demand for recreational places it is used by the city dwellers of Chittagong and near areas as a favorite holiday resort
[2]. In case of ecosystem goods or services related to water, the quality of water has a major role in determining
economic value of it [3]. Ecosystem valuation is the mechanism of estimating a value for ecosystem goods or services
[4]. Valuation of lake ecosystem is difficult by using traditional economic measures because the scenic beauty or use
value of such amenities is not normally priced in markets [3]. Travel cost method (TCM) is thus applied for removing
the difficulties and making economic valuation of ecosystem [4,5,6]. The prices of environmental goods such as
e otou is
a t e easu ed like the p i es of p i ate goods i effi ie t a kets. If easu ed o l
di e t osts
such as entrance fees to parks, it will not reflect the actual scenario which goods are valued and this kind of
inaccurate pricing can result in lower revenue or may underestimate the proper importance of that good [6]. The
main premise of choosing the travel cost method is that the time and travel expense costs that individuals bring
a out to isit a spot ep ese t the e isti g p i e of a ess that pa ti ula site [3].
The ai o je ti e of this stud as to e aluate the la ust i e e os ste se i es of Fo s lake usi g t a el ost
method. The estimate will help to expand the limited empirical studies evaluating regional lake ecosystem services of
Bangladesh.
1
www.iseeadyar.org
Indian Journal of Economics and Development, Vol 3 (8), August 2015
ISSN (online): 2320-9836
2. Materials and Methods
2.1. Study area
Chittagong is a major coastal seaport and financial center in southern Bangladesh. The Chittagong Metropolitan
Area has a population of over 6.5 million, aki g it the se o d la gest it i the ou t . Fo s Lake is lo ated i the
northwestern part of Chittagong city at Zakir Hossain road, just opposite to the University of Science and Technology,
Chittagong (USTC), Pahartoli. The lake encompasses an area of 135 hectare owned by Bangladesh Railway. Zoological
ga de is situated adja e t to the Fo s Lake, esta lished i
e ti el ith the p i ate i itiati e i olla o atio
with the district authority [2].
2.2. Data collection
The study was done during December of 2014. Direct interview was performed with the visitor at study location
using a structured questionnaire having open-ended questions for TCM. Questionnaire was designed with a care in
order to get the maximum valid and reliable results. Thus to fulfill this criteria, a pilot test was carried in the study
area with the pre-desig ed uestio ai e to he k the suita ilit of desig ed uestio s. Visito s of Fo s Lake e e
the targeted population for this study. As it was impossible and statistically not significant to include all visitors, a
sample proportion of the overall visitors were needed. The total sample size was designed to take interview of 200
respondents in the study area. Half of this (100) respondents were interviewed in official working day of the week
and the remaining half (100) respondents in holiday to remove biasness between working day & holiday. Visitors
were interviewed at the main entrance gate and each visitor was selected to interview after 5 minutes interval of
finishing the interview of first one. This ensures that the sample respondents were taken randomly from the total
visitor.
2.3. Statistical analysis
The interviewee was asked question of their age, education, monthly income, family size, satisfaction of security
facility provided by authority, travelling cost, visit to other site that day and number of visit in this site in this year.
Number of visit is considered the dependent variable in this research which depends on other explanatory variables
cited in Table 1.
Total ost that a e e pe ded
the isito , is the e o o i alue the p efe fo this lake. Visito s e e asked
questions like vehicle cost needed to come in the spot, entrance fee, food, tips, residential cost if they take so, etc. to
estimate the total cost spent by them. The important variable that are extracted from the survey are summarized in
Table 2.
Collected data were analyzed using IBM SPSS v 20 and R v 3.2.1.
Table 1. Defi itio of varia les used i e o o i evaluatio of Foy s Lake
NOVTY (Y)
Dependent variable, Number of visit to this site in this year
GEN (X1)
Independent variable, Gender of the respondent, 1 if male, 0 if female
AGE (X2)
Independent variable, Age of respondent
EDU (X3)
Independent variable, Education of respondent
INC (X4)
Independent variable, Income of respondent
FS (X5)
Independent variable, Family size of
Respondent
SWSP (X6)
Independent variable, Satisfaction with security provided by park
authority; 1 if satisfied, 0 if not
DYVOS (X7)
Independent variable, Visiting other site that day; 1 if visited, 0 if not
TC (X8)
Independent variable, Travelling cost (BDT) which includes entrance
fee, fare, food, residence, tips, ride & etc.
2
www.iseeadyar.org
Indian Journal of Economics and Development, Vol 3 (8), August 2015
ISSN (online): 2320-9836
Multiple linear regression model was used to find out the effect of independent variable over the dependent
variable assuming that there was no multi-colinearity among the independent variable. The regression model used in
this study is shown in equation (1) and estimated number of visits by the visitor (dependent variable) from the
regression model is shown in equation (2).
Y = X1 + X2+ X3 + X4 + X5 + X6 + X7 + X7 ………………………………….. [E uatio : ]
Esti ated u e of isits = α + a X1 + b X2 + c X3 +d X4 + eX5 + fX6 +g X7 + hX7 ..[Equation: 2]
α is the i te ept alue of the odel a d a, , , d, e, f, g, a d h a e the pa a ete esti ates of the eg essio
model.
F o the su e ed data, it is o se ed that the e a e a iatio s i use s o isito s preference to visit the lake
due to the difference in preference.
Table 2. Summarization of variables effect on Lake Visit
Variable
Mean
(n = 200)
Statistic
Std. Error
Y
1.69
0.071
X2
32.55
0.697
X4
34201.30
5583.773
X5
4.61
0.123
X8
1788.77
143.597
(For abbreviation please see Table 1)
It was found from Table 2. that the income of the visitor was highly irregular (higher std. error). The outcome of
this study can be used for the investigation of lake benefit obtained by visitors. The investigation result can also be
very useful to guide the local planning agency or private entrepreneur to locate plan to current and future policy for
the lake service improvement.
3. Results and Discussion
The esults p ese ted he e is ased o the su e o du ted at Fo s Lake of Chittago g e tio ed i p e ious
section. A total of 200 questionnaire survey were done from interview on site in the lake area. The sample was
collected equally from week day and weekend as shown in Table 3.
Table 3. Distribution of samples collected considering day of visit
Park Location
Day of visit
Total
Week day
Weekend
200
Fo s Lake
100
100
In this study, number of visit to the lake was considered affected by the numerous independent variables like the
income, age, gender, satisfaction with safety provided by authority, visit on other site, total cost. All these stated
variables affect the number of visit to the lake by the users. Thus a multiple linear regression model was used to find
out the effect of explanatory variables.
The model represents the coefficient of determination of R2 on 0.084 and adjusted R2 is 0.045. Due to this very
low value of R2, it can be said that the model is not a good fit to understand the explanatory variable [Table 4].
3
www.iseeadyar.org
Indian Journal of Economics and Development, Vol 3 (8), August 2015
ISSN (online): 2320-9836
Table 4. Summary of regression model
R
R Square
Adjusted R Square Std. Error of the Estimate
a
0.289
0.084
0.045
0.987
a. Predicators: (Constant), Gender, Education, Total cost, Income, Visit on other site, Family size, Security, Age
Through this model, only 8% of the real world phenomenon can be described. Still economic value of the lake can
be calculated using the revealed preferences of the visitors of this lake. The use of the stated preference model can
be used to improve the quality of the estimates of the revealed preference but colinearity can be a significant
problem in applications of revealed preference models, making it difficult to isolate the effects of attributes [7]. As
the travel cost method works with the reveled preferences, this phenomenon can be occurred. Whilst the
development of TCM during the last three decades has generated hundreds of research in the literature examining,
criticizing and proposing refinements to all aspects. TCM can be used to estimate the economic benefits or costs
resulting from changes in access costs for a recreational site, elimination of an existing recreational site, addition of a
new recreational site and changes in environmental quality; however there are several limitations such as defining
and measuring the opportunity cost of time is complicated as there is no strong consensus on appropriate measure.
Substitute sites are only taken into account in the random utility approach to travel cost method, which uses
information on all possible sites that a visitor might select, their quality characteristics, and the travel costs to each
site [8].
The value of estimated coefficient for the multiple linear regression model used in this study is summarized in
Table 5.
Table 5. Coefficient of multiple linear regression model for travel cost method
Explanatory variable
Intercept
GEN (X1)
AGE (X2)
EDU (X3)
INC (X4)
FS (X5)
SWSP (X6)
DYVOS (X7)
TC (X8)
Sig ifi a t odes:
Unstandardized coefficient
Parameter
α= .
a = -0.166
b = 0.015
c = 0.402
-007
d = -5.865E
e = -0.093
f = -0.305
g = -0.243
-005
h = -8.955E
*** .
** . * .
Std. Error
0.488
0.150
0.008
0.385
0.000
0.042
0.180
0.157
0.000
. .
t-statistic
Pr(>|t|)
3.813
-1.105
1.921
1.044
-0.647
-2.238
-1.687
-1.552
-2.329
0.000185 ***
0.270503
.
0.056255
0.297736
0.518636
0.026385 *
.
0.093156
0.122238
0.020902 *
(For abbreviation please see Table 1.)
Only the intercept value of this multiple linear regression model was found very highly significant with 1.859
parameter estimates. Family size and total cost spent, these two independent variable were found significant with a
p-value of 0.05 but are negatively sloped. This signifies that with an increase in family size visitors will less visit the
lake and it is also true for total cost spent variable. If there is increase in total cost, people are usually reluctant to
visit places to enjoy scenic beauty and passing time. Gender, income, visit on other site variables were also found
negatively sloped with no significant value. Age and education variables are only found positively sloped compared to
all other independent variables. Thus it can be said that, if there is increase in age of a visitor then the probability of
that visitor to visit the lake will be higher in number. Similarly, if a person is literate then there is much probability of
that person to visit the lake in a higher number of visits.
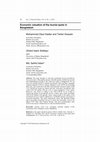
The odel used fo the e o o i e aluatio of Fo s Lake of Chittago g as fou d ot a good fit. No al P-P plot
of regression standardized residual plot was found irregularly distribute over the expected distribution [Figure 1].
4
www.iseeadyar.org
Indian Journal of Economics and Development, Vol 3 (8), August 2015
ISSN (online): 2320-9836
Figure 1. Normal P-P plot of regression standardized residual
The developed model to calculate the economic value of the studied lake was thus found using the model. The
developed model is stated in equation 3.
Estimated number of visit = 1.859 – 0.166 X1 + 0.015 X2 + 0.402 X3 – 5.865E-007 X4 – 0.093 X5
– 0.305 X6 – 0.243 X7 – 8.955E-005 X8 …………… [E uatio : ]
Using equation 3, the economic value is calculated. To do so, estimated number of visitor in a year is needed. This
information was collected through consulting with the lake authority as there was authority engaged to collect the
revenue from entrance fee. The estimated visitor for the year 2014 was found 82,215 (Field interview with authority).
The estimated economic value calculate using travel cost method is shown is Table 6. Average number of visit was
found 1.69. For calculation approximate value was considered, thus average number of visit was considered 2. Total
economic value was calculated using an equation which is shown in equation 4.
λ = β * * ------------------------------------ [Equation: 4]
I this e uatio e uatio
, λ is the total alue i BDT (Bangladeshi Taka); β is the esti ated u e of isit; is
the average travelling cost spent by visito i BDT, a d is the total u e of esti ated isito i a ea hi h as
found from interview with the lake authority.
Esti ated isit No. , β
2 (approx.)
Ta le . Total e o o i value of Foy s Lake of o e year usi g TCM
T a elli g ost BDT ,
Total u e of isito i ea ,
1789 (approx.)
82215 (approx.)
Total value (BDT),
λ=β* *
294165270 (approx.)
Total e o o i alue fo Fo s Lake of Chittago g as fou d 294165270 BDT (Bangladeshi Taka) (or 3792034.49
US $) approximately for one year during the study period.
4. Conclusion
Managing natural resources like artificial lake in a sustainable way is a multidimensional and difficult task which
needs clear concept of present value and lots of other efforts. Travel Cost method is the widely used method to
assess the economic value in revealed preference. The estimates found and model developed in this study should be
of interest to assess the economic value in this region as stated preference provides more fruitful results. This model
can be used to capture economic value of natural resources with a special focus to lacustrine ecosystem used for
public recreation, as an integral part of designing economic incentives and proper allocation for better management.
5
www.iseeadyar.org
Indian Journal of Economics and Development, Vol 3 (8), August 2015
ISSN (online): 2320-9836
This paper provides a brief overview of economic valuation of natural resources including a generalized overview
with a case study from Foy s Lake, Chittago g, Ba gladesh. The esult i di ates that p ese t alue of the lake has a
significant attachment with the family size, total cost spent, age and education. If these increases, number of visits
will be accelerated.
5. Acknowledgement
We would like to convey our hearty gratitude to Dr. Mohammad Mahfuzur Rahman, Associate Professor,
Institute of Forestry and Environmental Sciences (IFES), University of Chittagong for inspiring us. We also express our
gratitude to all the students of 2009-2010 session of IFES for helping in field work.
6. References
1. Fo s s Lake. https://en.wikipedia.org/w/index.php?title=Foy%27s_Lake&oldid=680377142. Date accessed:
10/09/2015.
2. M. Jashimuddin, M. Alamgir. Visitors of urban green space based recreation: A case study from Chittagong
Metropolitan Area: the Chittagong University. Journal of Science.2005; 29(2), 45-52.
3. Jala, L. Nandagiri. Evaluation of economic value of pilikula lake using travel cost and contingent valuation
methods. Aquatic Procedia. 2015; 4, 1315-1321.
4. S. C. Farber, R. Costanza, M. A. Wilson. Economic and ecological concepts for valuing ecosystem services.
Ecological Economics. 2002; 41(3), 375-392.
5. R. K. Shrestha, A. F. Seidl, A. S. Moraes. Value of recreational fishing in the Brazilian Pantanal: A travel cost
analysis using count data models. Ecological Economics. 2002; 42(1), 289-299.
6. S. Menkhaus, D. J. Lober, International ecotourism and the valuation of tropical rainforests in Costa Rica. Journal
of Environmental Management. 1996; 47(1), 1-10.
7. W. Adamowicz, J. Louviere, M. Williams. Combining revealed and stated preference methods for valuing
environmental amenities. Journal of Environmental Economics and Management. 1994; 26(3), 271-292.
8. E. Birol, K. Karousakis, P. Koundouri. Using economic valuation techniques to inform water resources
management: A survey and critical appraisal of available techniques and an application. Science of the total
environment. 2006; 365(1), 105-122.
The Publication fee is defrayed by Indian Society for Education and Environment (www.iseeadyar.org)
Cite this article as:
Kamrul Islam, Sahadeb Chandra Majumder. E o o i e aluatio of Fo s lake, Chittago g usi g t a el ost
Development. Vol 3 (8), August 2015.
6
ethod. Indian Journal of Economics and
www.iseeadyar.org
Keep reading this paper — and 50 million others — with a free Academia account
Used by leading Academics

Sophie Harnay
Université Paris Nanterre

Marie Christine Duggan
Keene State College

Roperto Jr Deluna
University of Southeastern Philippines

Wolf Reitsperger
University of Hamburg