Vol 449 | 27 September 2007 | doi:10.1038/nature06153
ARTICLES
Predicting evolutionary patterns of
mammalian teeth from development
Kathryn D. Kavanagh1{, Alistair R. Evans1 & Jukka Jernvall1,2
One motivation in the study of development is the discovery of mechanisms that may guide evolutionary change. Here we
report how development governs relative size and number of cheek teeth, or molars, in the mouse. We constructed an
inhibitory cascade model by experimentally uncovering the activator–inhibitor logic of sequential tooth development. The
inhibitory cascade acts as a ratchet that determines molar size differences along the jaw, one effect being that the second
molar always makes up one-third of total molar area. By using a macroevolutionary test, we demonstrate the success of
the model in predicting dentition patterns found among murine rodent species with various diets, thereby providing an
example of ecologically driven evolution along a developmentally favoured trajectory. In general, our work demonstrates
how to construct and test developmental rules with evolutionary predictability in natural systems.
A recurring promise of evolutionary developmental biology is the
discovery of the mechanisms and rules that govern the production of
the phenotypic variation available for natural selection1–7. In many
cases, independent evolutionary acquisitions of morphological similarities have been linked to parallel changes in the genome8–11, but
selection may also produce the same phenotypic result in different
evolutionary trials by altering different genes or interactions12–15.
Whereas in the former cases gene-level or low-level rules may have
predictive power across a broad range of taxa, in the latter cases
models may have to be built on a higher level of organization.
Regardless of the organizational levels invoked, explicit or inferred
developmental rules with evolutionary relevance must be shown to
favour specific evolutionary trajectories, and previous demonstrations have ranged from theoretical and computational models to
selection and developmental experiments1–7. Advances in developmental genetics now allow us to identify mechanisms that may bias
the production of phenotypic variation, which in part will help to
move evolutionary developmental biology into the realm of a predictive science.
The mammalian dentition is a classic system in which developmental mechanisms have been used to explain variation in shape and
size16–22. The timing of molar initiation during development has been
extensively studied in primates, not least because molar proportions
are used as a diagnostic feature in palaeontology. Differences in the
timing of molar initiation, mineralization and eruption as well as in
molar size and number have been linked to species-specific traits in
diet, life history, maturation and brain size23–26. In addition, regulation of molar size and number continues to have medical relevance
in connection with human third molars, or wisdom teeth, which are
frequently surgically removed with a risk of complications27.
Mammalian molars develop sequentially in an anterior to posterior direction (Fig. 1a), resembling the development of segmental
structures, but it remains unknown how molar initiation or size is
regulated along the tooth row. Mechanisms including available space
in the jaw and inhibition between developing teeth have both been
proposed to regulate molar initiation21,22,25. Because experimental
evidence and mathematical modelling have implicated a balance
of molecular signals activating and inhibiting the formation of
teeth28–30, here we examine whether inhibitory dynamics could
explain the initiation and size of adjacent molars in mouse (Mus
musculus) and whether these dynamics can account for aspects of
evolutionary patterns of teeth.
Inhibitory dynamics of molar initiation
As in most eutherian mammals, mice have three molars that develop
sequentially over several days31. The development of each individual
tooth is punctuated by the formation of the epithelial signalling
a
b
Day 14
M1
Day 14
M1
Day 16
M1
M2
Day 16
M1
M2
In vivo
In vitro
intact
M2 initiation?
In vitro
cut
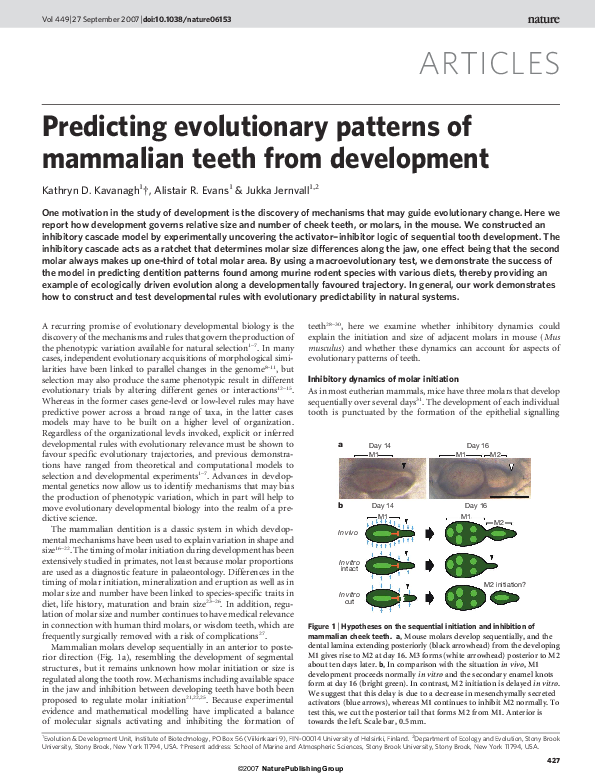
Figure 1 | Hypotheses on the sequential initiation and inhibition of
mammalian cheek teeth. a, Mouse molars develop sequentially, and the
dental lamina extending posteriorly (black arrowhead) from the developing
M1 gives rise to M2 at day 16. M3 forms (white arrowhead) posterior to M2
about ten days later. b, In comparison with the situation in vivo, M1
development proceeds normally in vitro and the secondary enamel knots
form at day 16 (bright green). In contrast, M2 initiation is delayed in vitro.
We suggest that this delay is due to a decrease in mesenchymally secreted
activators (blue arrows), whereas M1 continues to inhibit M2 normally. To
test this, we cut the posterior tail that forms M2 from M1. Anterior is
towards the left. Scale bar, 0.5 mm.
1
Evolution & Development Unit, Institute of Biotechnology, PO Box 56 (Viikinkaari 9), FIN-00014 University of Helsinki, Finland. 2Department of Ecology and Evolution, Stony Brook
University, Stony Brook, New York 11794, USA. {Present address: School of Marine and Atmospheric Sciences, Stony Brook University, Stony Brook, New York 11794, USA.
427
©2007 Nature Publishing Group
�ARTICLES
NATURE | Vol 449 | 27 September 2007
centres, the enamel knots28. A primary enamel knot forms at the onset
of the tooth crown development, followed by secondary enamel
knots that appear at the future positions of major molar features,
the cusps. Because mutations affecting the inhibition of enamel
knots can have fused or extra cusps and molars30, we postulate
that the first developing molar could inhibit the development of
subsequent molars, an effect that we also propose to be accentuated
by culture conditions. In culture, although the first molar (M1)
develops at essentially the same rate as that in vivo, posterior molars
are frequently delayed by several days or never develop at all. The
culture conditions, which involve the dissection of tooth germs from
surrounding tissue, seem to disrupt the mesenchymal influence on
the balance of activator and inhibitor molecules regulating molar
development (Fig. 1b).
To test these ideas, we cultured lower first molar tooth germs from
a mouse that expressed green fluorescent protein (GFP; fused with
Cre-recombinase) in the Sonic Hedgehog (Shh) locus (hereafter
called ShhGFP mice). In the developing tooth crown, Shh is first
upregulated only in the cells of the enamel knots; later, during differentiation, Shh expression is detected in the enamel-secreting ameloblasts throughout the crown28,32. Because enamel knots are difficult
to detect under normal culture conditions, the epifluorescence of
ShhGFP mice allowed us to pinpoint the future positions of the
molars and cusps in vitro, thereby permitting us to follow the sequential odontogenesis continuously (Fig. 2a). The ShhGFP construct is a
Shh-null allele; we therefore cultured heterozygous ShhGFP molars.
Similarly to a previous report on limb development33, we found the
tooth development and morphology of heterozygous ShhGFP mice
to be normal. We also examined the development of wild-type
molars, and the pattern of results remained essentially the same.
Using a standard Trowell culture system34, we first cultured ShhGFP
molars starting from embryonic day 14, at which time the M1 primary
enamel knot has formed. We cultured both intact tooth germs and teeth
in which we surgically separated the developing M1 from its posterior
tail that is fated to give rise to the second (M2) and third (M3) molars
(Figs 1 and 2a). Cultures were monitored daily, and the initiation of
each tooth was reconstructed from time-lapse images (Fig. 2a). For the
cultured intact tooth germs, the results show that only 11% of explants
formed M2 enamel knots after two days in culture, a period equivalent
to the timing of M2 initiation in vivo (Fig. 2b). Additional intact
explants developed M2s during the subsequent days, and 54% of
M2s were initiated by 12 days in culture (Fig. 2b). In contrast to this
delayed initiation of M2 development, M1 development progressed at a
fairly normal rate and all M1s had formed secondary enamel knots by
three days into the culture (Fig. 2a), matching the rate of development
in vivo28. The normal development of M1 implies that nutritional deficiency is unlikely to cause the delay in the posterior molars, but it
supports the hypothesis of inhibition by M1 (Fig. 1b).
For the explants in which the tail had been cut off from the rest of
the tooth germ, the results show that 98% of the separated tails
formed M2s, with 68% of them occurring at the in vivo rate (Fig.
2b). Therefore, rather than inflicting irreversible damage on the small
posterior bud, the separation seems to rescue M2 development from
an inhibitory effect of M1. We interpret this result to also exclude an
inhibitory gradient going through the jaw and teeth, increasing from
anterior to distal, because in that case we would not expect the separation to rescue M2s. Furthermore, in almost half of the cut explants,
M3 development was initiated, often before expected M3 initiation
in vivo (Fig. 2c).
At the day 14 cap stage, when the M1 enamel knot has formed, M1
expresses the genes encoding several signalling molecules28, including
diffusible inhibitors. Of these, at least ectodin (also known as Sostdc1
and wise, inhibitor of bone morphogenetic proteins (BMPs) and
Wnts), Bmp3 and follistatin (both encoding inhibitors of Activin A
and BMPs) are strongly expressed in the enamel knot or anterior
portion of the day 14 M1 (refs 30, 35, 36). Therefore, to test how
an earlier release from inhibition affects posterior molars, we cut the
posterior tails also at day 13, when the M1 primary enamel knot
would only just be forming. These results show that posterior molar
initiation was accelerated further: 90% of M2s were now initiated one
day earlier than in vivo (Fig. 2b). The initiation of M3 development
was also markedly accelerated (Fig. 2c). In addition, in one of the
explants, a fourth molar (M4) formed seven days into the culture. We
note that even though the tails giving rise to M3s were too small to be
dissected from M2s, molar initiation was always sequential and in no
case did we observe a simultaneous initiation of M2 and M3. Thus,
M3 initiation is likely to be inhibited by M2 and, consequently, M4 is
inhibited by M3.
Our results indicate that, as seems to occur with the regulation of
fibroblast growth factors during tooth development37, the balance
Intact
a
M2
Cut
M1
M1
14
M2
15
M3
16
17
18
19
Explant age (days)
100
M3 present (%)
M2 present (%)
100 b
75
50
25
20
21
22
23
c
75
50
25
0
0
13
15
17
19
21
Explant age (days)
23
25
Figure 2 | Posterior molars are initiated earlier in vitro when separated
from M1. a, The epifluorescence of cultured ShhGFP teeth allows daily
monitoring of the enamel knots to test whether cutting the posterior tail
(dashed line) accelerates molar initiation (white arrowheads).
b, c, Cumulative percentage curves show that, in comparison with the intact
explants (solid lines), the cut explants (dashed lines) at day 14 (blue) and day
13
15
17
19
21
Explant age (days)
23
25
13 (red) have an accelerated initiation of M2 (b) and M3 (c). In vivo M2 and
M3 initiation times are marked with dotted vertical lines. Mann–Whitney
U-tests on M2 and M3 age differences between intact and cut explants after
12 days of culture are all P # 0.001 (see Supplementary Information). n 5 28
and n 5 25 for day 14 intact and cut explants, respectively, and n 5 15 and
n 5 10 for day 13 intact and cut explants, respectively. Scale bar, 0.5 mm.
428
©2007 Nature Publishing Group
�ARTICLES
NATURE | Vol 449 | 27 September 2007
Molar initiation and size
To link our results for the process of molar initiation to morphological patterns, we measured from our experiments how tooth size is
affected by changes in tooth initiation (see Methods and Supplementary Information). The results show that the removal of inhibition on
posterior molars results not only in earlier tooth initiation but also in
larger posterior teeth. After 12 days of culture, M2s in the cut explants
were twice the size of M2s in the intact explants (cut versus intact day
14 means are 0.27 and 0.13 mm2, P , 0.001, and day 13 means are
0.23 and 0.11 mm2, P , 0.001; Mann–Whitney U-tests). Furthermore, the cut explant M2s are larger not only as a result of earlier
initiation but also because they grow faster (see Supplementary
Information). In contrast, M1 sizes have marginally decreased in
the cut explants, suggesting that dissection caused disruption and
also that inhibition is always from anterior to posterior (cut versus
intact day 14 means are 0.57 and 0.67 mm2, P 5 0.027, and day 13
means are 0.39 and 0.46 mm2, P 5 0.123; Mann–Whitney U-tests).
Nevertheless, in comparison with the intact explants, both the day 13
and day 14 cut explants produced 15–38% more ‘tooth’, measured as
the sum of the molar surface areas (P 5 0.005–0.012; Mann–Whitney
U-tests).
In the intact day 13 explants, the initiation of posterior molars was
delayed in comparison with that of intact day 14 explants (Fig. 2b, c)
and the M1s were also smaller, perhaps because of decreased
mesenchymal activation that limited development at this earlier
stage. Despite this typical retardation of day 13 tooth development
in vitro (J. Jernvall and K. D. Kavanagh, unpublished observations),
sizes of the day 13 cut explant M2s matched, and that of the M3s
exceeded, the sizes of corresponding teeth from the day 14 cut
explants (Fig. 4a; see Supplementary Information). The earlier separation from M1 therefore seems to lead to a tendency in which molar
sizes become more equal (Fig. 4a). Whereas, for example, the day 14
M3s could in principle catch up with the day 13 M3s, this would
require the former to grow more than twice as long as the latter. We
consider this situation unlikely because in our cultures the onset of
mineralization seemed to be the same in both the day 13 and day 14
cut explants.
M2 and M3/M1 size
between enamel knot activation and inhibition may be more important for tooth initiation than the absolute magnitude of signals themselves. Initially, the in vitro culture seems to decrease the level of
mesenchymal activators required for M2 induction whereas removal
of the inhibitory effect of M1 restores the inductive balance (Figs 1,
2). One obvious assumption linked to these interpretations is that
culture conditions decrease mesenchymal activators required for
enamel knot formation (Fig. 1b). To test this, we explored the effects
of BMP4 and Activin A by using protein-releasing bead experiments.
Both Bmp4 and activin bA are intensely expressed in the mesenchyme
at the onset of primary enamel knot formation, and both have been
implicated as mediators of epithelial–mesenchymal induction events
leading to the formation of enamel knots30,36,38–40. We placed beads
releasing BMP4 or Activin A immediately distally to intact day 14
tooth germs. The results show that both molecules are individually
able to accelerate the formation of M2s, although not to the extent
that separation from M1 achieved (Fig. 3).
Taken together, our experimental results suggest that the initiation
timing of posterior molars depends on previous molars through a
dynamic balance between intermolar inhibition and mesenchymal
activation. Because of the importance of molar size in evolution6,16–29,
we next explored how these developmental dynamics might bias the
production of phenotypic variation available for natural selection.
0.8
a
Day 13
0.6
Day 14
0.4
M2
a
15
1.0
nh
0.4
Activin A
cre
a
0
0
M2 present (%)
100
75
50
25
0
13
15
17
19
21
Explant age (days)
23
25
Figure 3 | Initiation of posterior molars can be stimulated by mesenchymal
activators. a, Protein-releasing beads were placed posteriorly to day 14
explants and the initiation of M2s was monitored (white arrowheads).
b, Both BMP4- (light blue line) and Activin A- (orange line) releasing beads
accelerate M2 initiation, falling between the intact (solid blue line) and cut
explants (dashed blue line). Mann–Whitney U-tests on M2 age differences
between protein and control explants after 12 days of culture are P 5 0.122
(n 5 16) for BMP4 and P 5 0.014 (n 5 19) for Activin A explants (see
Supplementary Information). Scale bar, 0.5 mm.
c
0.8
M1 ≈ M2 ≈ M3
0.6
0.4
M1 > M2 > M3
0.2
M1 >> M2 >> M3
Day 14
M3 missing
0
0.2
b
27
sin
gi
0.6
25
Day 13
De
BMP4
M3/M1 size
0.8
17
17
19
21
23
Explant age (days)
b
ibi
tio
n
Control
1.0
16
Explant age (days)
Day 14
M3
0
13
15
Day 13
0.2
0.2 0.4 0.6 0.8 1.0
M2/M1 size
0
0.2 0.4 0.6 0.8 1.0
M2/M1 size
Figure 4 | From molar initiation to predicting molar proportions in murine
species. a, Removal of inhibition results in earlier initiation and more
equal-sized posterior molars. b, Changes in inhibition provide a trajectory
through the morphospace in which more equal-sized molars are found with
low inhibition (day 13 explants; error bars denote s.e.m). In contrast,
increasing inhibition (day 14 explants) leads to smaller posterior molars and
eventually the lack of M3. c, The molar proportions of 29 species of murine
rodents (black circles; Mus musculus is marked with an open circle) fall close
to the experimental data (crosses and dashed line). We note the lack of M3
when M2 is about half the size of M1, in both the experimental and the
macroevolutionary data. For the experimental data, the slope drawn through
the means of day 14 and day 13 molar sizes is 1.848 and the intercept is
20.833. When the 12 cut explants without M3s (all except one were day 14)
are plotted separately (b), the resulting reduced major axis regression slope
is 1.519 and the intercept is 20.673. When M1 sizes just before they reach
their asymptotic sizes are used, approximating the growth stage of measured
M2s and M3s, the reduced major-axis regression slope is 2.024 and the
intercept is 20.997. For the macroevolutionary data (c), the reduced majoraxis regression slope is 2.150 and the intercept is 21.219 (r2 5 0.740). For
details see Supplementary Information.
429
©2007 Nature Publishing Group
�ARTICLES
NATURE | Vol 449 | 27 September 2007
a 1.0
b 1.0
0.8
0.8
M3/M1size
A macroevolutionary test of the model
Because our model makes broad predictions about the relative sizes
of individual teeth, to test the model we focused on a sample of 29
species of murine rodents covering a wide spectrum of ecological
adaptations and phylogenetic lineages representative of the entire
subfamily41,42 (Supplementary Information). Tooth rows were digitized with a high-resolution laser scanner and the molar crown areas
were measured with the MorphoBrowser database containing the
three-dimensional tooth scans42.
The basic prediction from the experiments is that with an increase
in relative size of M2, M3 should increase more. The results show that
molar proportions follow this expectation closely (Fig. 4c), although
the macroevolutionary patterns seem to show a slightly greater
increase in posterior molars than the experimental prediction
(Fig. 4c). We suspect that this is because our developmental data
were derived from cultured teeth in vitro in which M1 was near
mineralization whereas M2 and especially M3 could grow further,
increasing their relative sizes. Indeed, when ante-asymptotic M1 sizes
are used for the experimental data, the slopes of the molar size relationships are very similar between the experiments (2.02) and species
(2.15). Conversely, in our molar diversity data, we have one species,
golden-bellied water rat (Hydromys chrysogaster), which lacks M3
altogether. Matching the prediction from mouse explants lacking
M3s, M2 in Hydromys is about half the size of M1 (Fig. 4c). Thus,
despite the limitations of in vitro cultures (uncut M3s and incomplete
differentiation), these results may implicate the inhibitory cascade in
regulating tooth proportions.
Next, to test how closely the macroevolutionary data follow the
explicit prediction of the inhibitory cascade model 1 1 [(a 2 i)/i]
(x 2 1), we first calculated the predicted sizes of M3s on the basis
of the relative size of M2s (see Fig. 5a and Methods). Both the slope
(2.0) and the intercept (21.0) of the model prediction are within the
95% confidence intervals of the macroevolutionary data. To examine
further the consistency of the tooth-to-tooth inhibitory relay in our
data, we generated a random relay model, in which the strength of
inhibition changed between teeth, by randomly reshuffling the M2based predictions of M3 sizes 1,000 times (see Fig. 5a, Methods and
Supplementary Information). The results show that whereas the random relay still produces correlated variation between relative M2 and
M3 sizes (because, for example, it is unlikely that a large M2 is followed by a very small M3), its predictions are not congruent with
our macroevolutionary data or model (Fig. 5a and Supplementary
Information). We interpret these results as further implicating the
inhibitory cascade as a ‘ratchet’ generating predictable size differences along the molar row.
One phenotypic outcome of the ratchet is the high variability of
M3, a result that agrees well with data from populations and species18–21,43,44. Whereas the high variability of M3 has been linked to
available space in the jaw and difficulty in measuring small M3s, the
inhibitory cascade may provide null expectations for M3 variability.
Another phenotypic result specific to the model is that M2 makes
up roughly one-third of total molar area, irrespective of molar proportions (M2/(M1 1 M2 1 M3) 5 (a/i)/[1 1 a/i 1 (2a/i 2 1)] 5 1/3;
see Methods). This is noteworthy because previous studies have found
this relationship in primates45, suggesting that the inhibitory cascade
may be expected to apply across mammalian orders.
Even though we have shown here how the inhibitory cascade can
be used to account for the evolutionary diversity of molar proportions, ecological and functional factors are still likely to have an
indirect function in these differences. For example, previous analyses
have shown that the overall crown complexity of rodent molars
closely reflects the species-specific diets42. High crown-feature complexity is associated with herbivory, whereas simpler, smaller crowns
are found in animal-eating taxa42. In our diversity data, the highly
derived species with either specialized animal or fibrous-vegetation
diets are plotted at the far ends of the molar-proportion spectrum
(Fig. 5b). In other words, herbivorous murine species have more
equal-sized teeth, whereas more faunivorous species, such as
Hydromys (Fig. 5b), have progressively more reduced distal teeth.
In comparison with dental complexity42, however, molar proportions seem not to be a measure of diet across mammalian orders
because, for example, many herbivorous primates have progressively
larger distal molars. We propose that molar proportions may not
reflect function itself but may manifest the way in which development, by affecting the variational properties of teeth, responds to
selection on functional features such as complexity and overall size.
Whereas our model predicts evolutionary change based on
development, these predictions should not be taken as constraints
on evolution. One clear exception is herbivorous arvicoline rodents
(voles), in which the anterior part of their M1 is greatly elongated
M3/M1size
An inhibitory cascade model
The inhibitory dynamics (Figs 2, 3) and shifting molar proportions
(Fig. 4a) are indicative of an inhibitory cascade, or a ‘ratchet’ in which
subsequently developing teeth are cumulatively affected by previous
developmental events. The inhibitory cascade can be formalized as a
simple high-level model in which a balance between activation and
inhibition results in equal-sized molars (M1 < M2 < M3) and
increasing inhibition has a cumulative effect on the posterior teeth
giving a distinct M1 . M2 . M3 pattern (Fig. 4b). The relative molar
sizes determined by the model can be stated as 1 1 [(a 2 i)/i](x 2 1),
in which, at each molar position (x), tooth size results from the
relative strengths of activators (a) and inhibitors (i). As a result of
the ratcheting nature of the inhibition, a change in inhibition (or
activation) affects the relative size of M3 more than that of M2
(Fig. 4b). Nevertheless, molars have shared covariance patterns, so
the relative size of adjacent teeth allows one to predict the presence
and size of additional teeth. For example, M3s are missing when
M2 size falls below half that of M1 (Fig. 4b). Conversely, our case
of M4 occurred when the size of M3 equalled that of M2 (Supplementary Information), perhaps indicating that the evolution of
supernumerary teeth is most likely when tooth activation and inhibition are in balance.
0.6
0.4
0.2
Herbivorous
Omnivorous
0.6
0.4
Faunivorous
0.2
0
0
0
0.2
0.4 0.6 0.8 1.0
M2/M1size
0
0.2
0.4 0.6 0.8 1.0
M2/M1size
Figure 5 | The inhibitory cascade and the ecological context of murine
dental diversity. a, From the macroevolutionary data (black line), the M2/
M1 size was used to calculate the predicted M3/M1 size with the inhibitory
cascade model (orange line; examples of molar proportions:
M1 5 M2 5 M3; M1 . M2 . M3; M1 ? M2 ? M3). The random relay
prediction illustrated (blue line: M1 5 M2 . M3; M1 . M2 5 M3;
M1 ? M2 . M3), for which randomized M2/M1 sizes were used to predict
M3/M1 sizes, is the mean of reduced major axis regressions performed on
each of 1,000 random simulations. All correlations, slopes and intercepts of
the diversity data and the prediction of the inhibitory cascade model are
significantly different from those of the 1,000 random relays (P 5 0.005 to
P , 0.001). b, The most equal molar proportions are found in herbivorous
taxa and the least equal in faunivorous taxa, indicating that the inhibitorycascade-influenced phenotypic change is under the control of ecology. The
three examples of molar rows are scaled to body size (scale bar, 0.01 of body
length) and are for Mallomys rothschildi (herbivore, n 5 2), Mus musculus
(omnivore, n 5 22) and Hydromys chrysogaster (faunivore, n 5 3), anterior
towards the left. Error bars denote s.e.m. For details see Supplementary
Information.
430
©2007 Nature Publishing Group
�ARTICLES
NATURE | Vol 449 | 27 September 2007
(refs 28, 46). This change can be considered a developmental novelty
in which the M1 extension is allowed because there are no premolars
in the anterior dental diastema. Nevertheless, we postulate a general
situation in which any developmentally derived rule would predict
that organisms should most often fall on the developmentally
favoured evolutionary trajectory (Figs 4 and 5). In the inhibitory
cascade, for example, many Old World primates and ungulates have
a weak inhibitory cascade resulting in large distal molars (M1 ,
M2 , M3), but are still predicted to fall along the predicted trajectory. In contrast, other kinds of developmental change would be
required for invasion of other parts of the morphospace. For
example, evolving M1 , M2 . M3 proportions can be predicted to
require a combination of low inhibition and specific early arrest of
M3 development. However, for murine molars, the inhibitory cascade seems to have sufficed when murine rodents, the most taxonomically diverse mammalian group living, radiated into multiple
adaptive zones.
Conclusions
The inhibitory cascade model is an activator–inhibitor networkderived model that allows the prediction of evolutionary paths in a
given selective environment. These kinds of mechanistic model differ
from classical correlation-based approaches (for example, genetic
covariance) because the developmental mechanism is identified
and there is greater conceptual continuity from genotype to phenotype3. To this end, the exact genetic underpinnings of the inhibitory
cascade model remain to be identified. Whereas possible molecular
level candidates include signalling molecules (and their inhibitors)
such as BMPs, Activin A (Fig. 3) and Ectodysplasin47, and transcription factors such as Pax9 (ref. 48), the inhibitory cascade may or may
not be centred on the same genes in every species. Ultimately, with
many more than 500 extant species and divergence times extending
from the Pleistocene through to the middle Miocene41, murine
rodents may provide excellent tests for the generality of high-level
and low-level developmental rules. For this task, we would argue that
the best tests of usefulness of identified developmentally derived rules
are both the generality of the rule’s use in other systems or taxa and
the ability to demonstrate how development matters in explaining
the evolution of phenotypes.
Because activator–inhibitor networks are a common mechanism
in development, we suggest that inhibitory cascade-derived rules may
apply in explaining the size relationships in adjacent organs beyond
tooth development, particularly in other systems with sequentially
developing organs or repeating elements. In insects, competition
between developing body parts has been shown to affect the evolution of morphology2,5, and the inhibitory cascade may also be understood as a form of sequential competition between adjacent organs.
In teeth, our model resolves long-standing debates about the regulation of individual molar initiation and size, highlighting the
essential role of inhibitors in shaping the entire dental system.
Furthermore, our strategy of using the experimentally defined logic
of organ systems to develop high-level testable models for predicting
morphological evolution provides a blueprint for further exploration
of evolutionary predictability in natural systems.
images of 61 explants and scans of 29 species. For all measures, statistical
differences between groups were tested by using Mann–Whitney U-tests, each
with two-tailed exact significance levels, performed in SPSS version 11.0 (SPSS
Inc.). Model randomizations and calculations of reduced major-axis regressions49 were performed in a custom Visual Basic 6.0 program (Microsoft
Corp.) and additional calculations of reduced major-axis regressions were
performed in PAST (http://folk.uio.no/ohammer/past/index.html) (see Supplementary Information).
Full Methods and any associated references are available in the online version of
the paper at www.nature.com/nature.
Received 20 April; accepted 7 August 2007.
1.
2.
3.
4.
5.
6.
7.
8.
9.
10.
11.
12.
13.
14.
15.
16.
17.
18.
19.
20.
21.
22.
23.
METHODS SUMMARY
Lower molar tooth germs were dissected from heterozygous ShhGFP mouse
embryos33 at day 13 or 14 after fertilization, as described previously30,34.
Posterior tails (giving rise to M2 and M3) of developing M1s were separated,
and both pieces were cultured a short distance from each other. Explants
were photographed daily from initiation to day 12 of culture, and the molar
initiation date was determined on the basis of the first visible epifluorescence
marking the formation of each primary enamel knot. Recombinant protein
beads30,34 were placed on the posterior end of day 14 tooth germs. Tooth rows
of 29 murine rodent species, representing the range of diets across the phylogeny
within the subfamily, were scanned with a laser scanner and entered into
the MorphoBrowser database (http://morphobrowser.biocenter.helsinki.fi/) as
described previously42. Two-dimensional crown areas were measured from
24.
25.
26.
27.
28.
Alberch, P. & Gale, E. A. A developmental analysis of an evolutionary trend: Digital
reduction in amphibians. Evol. Int. J. Org. Evol. 39, 8–23 (1985).
Nijhout, H. F. & Emlen, D. J. Competition among body parts in the development
and evolution of insect morphology. Proc. Natl Acad. Sci. USA 95, 3685–3689
(1998).
Wagner, G. P., Chiu, C.-H. & Laubichler, M. Developmental evolution as a
mechanistic science: the inference from developmental mechanism to
evolutionary processes. Am. Zool. 40, 819–831 (2000).
Salazar-Ciudad, I. & Jernvall, J. How different types of pattern formation
mechanisms affect the evolution of form and development. Evol. Dev. 6, 6–16
(2004).
Emlen, D. J., Hunt, J. & Simmons, L. W. Evolution of sexual dimorphism and male
dimorphism in the expression of beetle horns: phylogenetic evidence for
modularity, evolutionary lability, and constraint. Am. Nat. 166, 42–68 (2005).
Polly, P. D. Development and phenotypic correlations: the evolution of tooth
shape in Sorex araneus. Evol. Dev. 7, 29–41 (2005).
Brakefield, P. M. & Roskam, J. C. Exploring evolutionary constraints in a task for an
integrative evolutionary biology. Am. Nat. 168, 4–13 (2006).
Colosimo, P. F. et al. Widespread parallel evolution in sticklebacks by repeated
fixation of Ectodysplasin alleles. Science 307, 1928–1933 (2005).
Protas, M. E. et al. Genetic analysis of cavefish reveals molecular convergence in
the evolution of albinism. Nature Genet. 38, 107–111 (2006).
Prud’homme, B. et al. Repeated morphological evolution through cis-regulatory
changes in a pleiotropic gene. Nature 440, 1050–1053 (2006).
Shapiro, M. D., Bell, M. A. & Kingsley, D. M. Parallel genetic origins of pelvic
reduction in vertebrates. Proc. Natl Acad. Sci. USA 103, 13753–13758 (2006).
True, J. & Haag, E. S. Developmental system drift and flexibility in evolutionary
trajectories. Evol. Dev. 3, 109–119 (2001).
Abouheif, E. & Wray, G. A. Evolution of the gene network underlying wing
polymorphism in ants. Science 297, 249–252 (2002).
Kawasaki, K., Suzuki, T. & Weiss, K. M. Phenogenetic drift in evolution: the
changing genetic basis of vertebrate teeth. Proc. Natl Acad. Sci. USA 102,
18063–18068 (2005).
Tanaka, M. et al. Developmental genetic basis for the evolution of pelvic fin loss in
the pufferfish Takifugu rubripes. Dev. Biol. 281, 227–239 (2005).
Bateson, W. Materials for the Study of Variation, Treated with Special Regard to
Discontinuity in the Origin of Species (Macmillan, London, 1894).
Butler, P. M. Studies of the mammalian dentition. Differentiation of the postcanine dentition. Proc. Zool. Soc. London (B) 109, 1–36 (1939).
Kurtén, B. On the variation and population dynamics of fossil and recent mammal
populations. Acta Zool. Fenn. 76, 1–122 (1953).
Van Valen, L. Growth fields in the dentition of Peromyscus. Evol. Int. J. Org. Evol. 16,
272–277 (1962).
Gould, S. J. & Garwood, R. A. Levels of integration in mammalian dentitions: an
analysis of correlations in Nesophontes micrus (Insectivora) and Oryzomys couesi
(Rodentia). Evol. Int. J. Org. Evol. 23, 276–300 (1969).
Sofaer, J. A., Bailit, H. L. & MacLean, C. J. A developmental basis for differential
tooth reduction during Hominid evolution. Evol. Int. J. Org. Evol. 25, 509–517
(1971).
Osborn, J. W. in Development, Function and Evolution of Teeth (eds Butler, P. M. &
Joysey, K. A.) 171–201 (Academic, London, 1978).
Smith, B. H. Dental development and the evolution of life-history in Hominidae.
Am. J. Phys. Anthropol. 8, 157–174 (1991).
Godfrey, L. R., Samonds, K. E., Jungers, W. L. & Sutherland, M. R. in Primate Life
Histories and Socioecology (eds Kappeler, P. M. & Pereira, M. E.) 177–203 (Univ. of
Chicago Press, Chicago, 2003).
Boughner, J. C. & Dean, M. C. Does space in the jaw influence the timing of molar
crown initiation? A model using baboons (Papio anubis) and great apes (Pan
troglodytes, Pan paniscus). J. Hum. Evol. 46, 253–275 (2004).
Macchiarelli, R. et al. How Neanderthal molar teeth grew. Nature 444, 748–751
(2006).
Silvestri, A. R. Jr & Singh, I. The unresolved problem of the third molar: Would
people be better off without it? J. Am. Dent. Assoc. 134, 450–455 (2003).
Jernvall, J., Keränen, S. V. E. & Thesleff, I. Evolutionary modification of
development in mammalian teeth: Quantifying gene expression patterns and
topography. Proc. Natl Acad. Sci. USA 97, 14444–14448 (2000).
431
©2007 Nature Publishing Group
�ARTICLES
NATURE | Vol 449 | 27 September 2007
29. Salazar-Ciudad, I. & Jernvall, J. A gene network model accounting for
development and evolution of mammalian teeth. Proc. Natl Acad. Sci. USA 99,
8116–8120 (2002).
30. Kassai, Y. et al. Regulation of mammalian tooth cusp patterning by Ectodin.
Science 309, 2067–2070 (2005).
31. Gaunt, W. A. An analysis of the growth of the cheek teeth of the mouse. Acta Anat.
54, 220–259 (1963).
32. Gritli-Linde, A. et al. Shh signaling within the dental epithelium is necessary
for cell proliferation, growth and polarization. Development 129, 5323–5337
(2002).
33. Harfe, B. D. et al. Evidence for an expansion-based temporal Shh gradient in
specifying vertebrate digit identities. Cell 118, 517–528 (2004).
34. Sahlberg, C., Mustonen, T. & Thesleff, I. Explant cultures of embryonic
epithelium: Analysis of mesenchymal signals. Methods Mol. Biol. 188, 373–382
(2002).
35. Åberg, T., Wozney, J. & Thesleff, I. Expression patterns of bone morphogenetic
proteins (Bmps) in the developing mouse tooth suggest roles in morphogenesis
and cell differentiation. Dev. Dyn. 210, 383–396 (1997).
36. Wang, X. P. et al. Modulation of activin/bone morphogenetic protein signaling by
follistatin is required for the morphogenesis of mouse molar teeth. Dev. Dyn. 231,
98–108 (2004).
37. Klein, O. D. et al. Sprouty genes control diastema tooth development via
bidirectional antagonism of epithelial–mesenchymal FGF signaling. Dev. Cell 11,
181–190 (2006).
38. Ferguson, C. A. et al. Activin is an essential early mesenchymal signal in tooth
development that is required for patterning of the murine dentition. Genes Dev. 12,
2636–2649 (1998).
39. Jernvall, J., Åberg, T., Kettunen, P., Keränen, S. & Thesleff, I. The life history of an
embryonic signaling center: BMP-4 induces p21 and is associated with apoptosis
in the mouse tooth enamel knot. Development 125, 161–169 (1998).
40. Plikus, M. V. et al. Morphoregulation of teeth: modulating the number, size, shape
and differentiation by tuning Bmp activity. Evol. Dev. 7, 440–457 (2005).
41. Jansa, S. A., Barker, F. K. & Heaney, L. R. The pattern and timing of diversification
of Philippine endemic rodents: Evidence from mitochondrial and nuclear gene
sequences. Syst. Biol. 55, 73–88 (2006).
42. Evans, A. R., Wilson, G. P., Fortelius, M. & Jernvall, J. High-level similarity of
dentitions in carnivorans and rodents. Nature 445, 78–81 (2007).
43. Garn, S. M., Lewis, A. B. & Kerewsky, R. S. Third molar agenesis and size reduction
of the remaining teeth. Nature 200, 488–489 (1963).
44. Polly, P. D. Variability in mammalian dentitions: size-related bias in the coefficient
of variation. Biol. J. Linn. Soc. 64, 83–99 (1998).
45. Lucas, P. W., Corlett, R. T. & Luke, D. A. Sexual dimorphism of tooth size in
anthropoids. Hum. Evol. 1, 23–29 (1986).
46. Guthrie, R. D. Variability in characters undergoing rapid evolution, an analysis of
Microtus molars. Evol. Int. J. Org. Evol. 19, 214–233 (1965).
47. Kangas, A. T., Evans, A. R., Thesleff, I. & Jernvall, J. Nonindependence of
mammalian dental characters. Nature 432, 211–214 (2004).
48. Kist, R. et al. Reduction of Pax9 gene dosage in an allelic series of mouse mutants
causes hypodontia and oligodontia. Hum. Mol. Genet. 14, 3605–3617 (2005).
49. Sokal, R. R. & Rohlf, F. J. Biometry (Freeman, New York, 1995).
Supplementary Information is linked to the online version of the paper at
www.nature.com/nature.
Acknowledgements We thank C. K. Chapple, G. Evans, M. Fortelius,
I. Salazar-Ciudad, M. Mikkola, I. Thesleff, G. P. Wilson and P. C. Wright for
comments, discussions and support with this work; P. Munne, M. Mäkinen,
E. Penttilä, I. Pljusnin, R. Santalahti and R. Savolainen for technical help; M. Hyvönen
for activin A recombinant protein; C. Tabin and A. Gritli-Linde for the ShhGFPCre
mice; and the following museum curators and collection managers for loans:
O. Grönwall, R. Asher, M. Hildén and I. Hanski. This study was supported by the
Academy of Finland.
Author Contributions K.D.K. and J.J. conceived the study; K.D.K. performed
developmental experiments; A.R.E. acquired three-dimensional data; K.D.K., A.R.E.
and J.J. performed quantitative analyses; A.R.E. and J.J. constructed the model;
A.R.E. performed computer simulations; K.D.K., A.R.E. and J.J. wrote the paper; and
J.J. coordinated the study.
Author Information The three-dimensional scans for this study are deposited in
the MorphoBrowser database, at http://morphobrowser.biocenter.helsinki.fi/.
Reprints and permissions information is available at www.nature.com/reprints.
The authors declare no competing financial interests. Correspondence and
requests for materials should be addressed to K.D.K.
(kathryn_kavanagh@yahoo.com) or J.J. (jernvall@fastmail.fm).
432
©2007 Nature Publishing Group
�doi:10.1038/nature06153
METHODS
Tooth cultures. Lower M1 tooth germs were dissected from heterozygous
ShhGFP mouse Shhtm1(EGFP/Cre)Cjt/1 embryos33 at day 13 or 14 after fertilization
and cultured at 37 uC and 5% CO2 with a Trowell-type organ culture as described
previously30,34. In brief, teeth were placed on 0.1 mm Nucleopore filter paper
(Whatman) on a raised wire grid in a small Petri dish containing 2 ml of tissue
medium (45% DMEM (Gibco), 45% F12/Glutamax (Gibco), 10% fetal bovine
serum (PAA Laboratories GmbH) and 1% penicillin–streptomycin (10 U ml21;
Gibco)]. Medium was replaced every two to three days, and ascorbic acid
(100 mg ml21) was added. The epifluorescence of ShhGFP teeth closely follow
the patterns of Shh expression detected with in situ hybridization techniques28.
In vitro experiments. Tooth germs were separated from the jaw tissue, which, if
left in place, would grow and stunt the development of teeth in culture. Posterior
tails of tooth germs in culture were separated from the tooth germ with a 25gauge needle, and both pieces were cultured a short distance (about 100 mm)
from each other on the same filter paper. For a clean cut, the filter paper with the
tooth germ was briefly placed on a glass Petri dish for the cutting, taking care to
avoid desiccation, then returned to the grid over medium. For day 13 tooth
germs, the tail was cut from the point at which the initial anterior broadening
stopped, or one-quarter of the way from the end of the tail. Digital images of 80
explants were taken daily (except for 80 out of 1,040 cases) from initiation to day
12 of culture under a fluorescence microscope (Leica MZFLIII microscope and
Olympus DP50 digital camera system at magnifications of 33.2 and 34.0,
resulting in 0.44 and 0.55 pixel mm21 resolutions, respectively). Molar initiation
date was tabulated by tracking backwards from the final M2 or M3 to the first
visible epifluorescence marking the formation of the primary enamel knot.
Recombinant protein bead experiments were performed as described
previously30,34. Agarose beads (Affi-Gel-Blue beads, catalogue no. 153-7302;
Bio-Rad) were washed three times in PBS, then soaked in Activin A
(100 ng ml21)50, BMP4 (100 ng ml21; R&D Systems) or BSA control (1 mg ml21;
Sigma). Roughly 50 beads were soaked in 5 ml of 100 ng ml21 protein solution for
45 min at 37 uC and a bead was placed with fine forceps on the posterior end of
the day 14 tooth germ.
Quantitative analyses of experimental and macroevolutionary data. We chose
the day 12 culture point for morphological measurements because at this stage
M1 has reached, and M2 is close to reaching, asymptotic size and because after
this day teeth are often difficult to measure accurately in vitro because of superfluous tissue growth and differentiation. From digital images we measured the
two-dimensional areas of developing tooth crowns. Even when teeth have rolled
onto their side this gives a reasonably consistent measure of size because
cultured teeth have a tendency to flatten. However, explants in which M1 was
pointing vertically, thus providing a considerable underestimate of its size relative to other molars, were excluded from measurements. The areas of 61 M1s, 48
M2s and 17 M3s were measured with NIH Image 1.63 and ImageJ (http://
rsb.info.nih.gov/ij/). In addition, molar sizes were measured on alternate days
of culture for 21 explants.
The 29 murine rodent species used in the macroevolutionary analysis
were selected to represent the range of diets across the phylogeny within the
subfamily and were determined from published literature sources described
previously42. A tooth row of each species was scanned with a Nextec Hawk
three-dimensional laser scanner and entered into the MorphoBrowser database
at http://morphobrowser.biocenter.helsinki.fi/ (ref. 42). Teeth were oriented
manually to maximize crown–base projection and crowns were captured with
the JavaView viewing utility in MorphoBrowser. Two-dimensional areas
were measured with NIH Image 1.63 and ImageJ. All ratios were plotted with
the use of non-transformed mm2 areas.
Developmental models. We assumed a linear effect of the activator and inhibitor ratio on tooth proportions, namely (a 2 i)/i 5 (a/i) 2 1. Other relationships (for example, log(a/i)) would alter the amount by which teeth changed
along the inhibitory cascade trajectory but not the trajectory itself. Solving
the molar sizes from 1 1 [(a 2 i)/i](x 2 1) gives M1 5 1, M2 5 a/i and
M3 5 2a/i 2 1. Molar proportions (of all the molars) are M1 5 i/3a, M2 5 1/3
and M3 5 (2a 2 i)/3a. From these formulae, the relationship between the
M2/M1 ratio and the M3/M1 ratio is M3/M1 5 2(M2/M1) 2 1. Note that the
constant 1/3 proportion of M2 is lost if the tooth row has four molars.
Progressively larger posterior molars may still be initiated sequentially if their
growth rates are correspondingly faster. Even though the model may apply to
volumes (or numbers of cells), we present our measurement data with twodimensional surface areas because we consider these more reliable and because
they are commonly used in morphological research. We note, however, that
transforming the two-dimensional areas to volumes does not change the pattern
of results. In the random relay model, we randomly reshuffled the M2/M1 sizes
(in effect, the strength of (a 2 i)/i) before determining M3/M1 sizes. A total of
1,000 randomizations were performed in a custom Visual Basic 6.0 program and
calculations of reduced major axis regressions were performed as described49.
50. Harrington, A. E. et al. Structural basis for the inhibition of activin signalling by
follistatin. EMBO J. 25, 1035–1045 (2006).
©2007 Nature Publishing Group
�
 Kathryn Kavanagh