J Food Sci Technol (April 2015) 52(4):1896–1910
DOI 10.1007/s13197-013-1222-5
ORIGINAL ARTICLE
Rheological behaviour of enzyme clarified sapota (Achras
sapota L) juice at different concentration and temperatures
Pranjal S. Deshmukh & S. S. Manjunatha & P. S. Raju
Revised: 3 October 2013 / Accepted: 21 November 2013 / Published online: 19 December 2013
# Association of Food Scientists & Technologists (India) 2013
Abstract Rheological behaviour of enzyme clarified sapota
(Achras sapota L.) juice at different temperatures (10 to
85 °C) and total soluble solid content (10.2 to 55.6 °brix)
corresponding to a water activity (aw) (0.986 to 0.865) was
studied using controlled stress rheometer by coaxial cylinders
attachment. The rheological parameter shear stress (Pa) was
measured upto a shear rate of 1,000 s−1. The investigation
showed that the enzyme clarified sapota juice and its concentrates behaved like a Newtonian liquid and the viscosity (η)
values were in the range 4.340 to 56.418 mPa s depending
upon temperature and concentration studied. The temperature
dependency of viscosity of enzyme clarified sapota juice was
described by Arrhenius equation (r >0.94) and activation
energy (Ea) for viscous flow was in the range 5.218 to
25.439 KJ/mol depending upon concentration. The effect of
total soluble solid content on flow activation energy was
described by exponential relationship (r > 0.95, rmse%
<13.5, p <0.01) and that of water activity was described by
power law relation (r >0.99, rmse% <5.80, p <0.01). The
effect of total soluble solid content on viscosity of enzyme
clarified sapota juice followed second order exponential type
relationship (r >0.99, rmse%<3.53) at the temperature used.
The effect of water activity on viscosity of enzyme clarified
sapota juice followed power law equation (r >0.98, rmse%<
4.38). A single equation representing combined effect of
temperature and total soluble solid content/water activity on
viscosity of enzyme clarified sapota was established.
P. S. Deshmukh
Department of Food Processing and Engineering,
Karunya University, Coimabatore 614 114, India
S. S. Manjunatha (*) : P. S. Raju
Department of Fruits and Vegetables Technology, Defence Food
Research Laboratory, Siddarthanagar, Mysore 570 011, India
e-mail: shringarimanju@gmail.com
Keywords Sapota juice . Achras sapota L . Rheology .
Viscosity . Arrhenius equation . Activation energy . Enzyme
clarification
Introduction
In recent developments in the design and control of food
processes, utilization of computer aided designing, modelling
and simulation require extensive data on the physical and
engineering properties of foods. The rheological properties
of fluid food is an important aspect in the field of food
processing and engineering such as, in developing food process techniques, design of processing equipments, structural
understanding and quality evaluation of food and raw agricultural materials in the field of food science and technology. Due
to the complex physical, chemical and biological structures of
food material it is difficult to arrive at theoretical prediction of
rheological properties of foods. Therefore, experimental determination of rheological properties is important in the understanding and characterisation of food. The rheological
properties of fluid food products are important in determining
the power requirements for unit operations such as, pumping,
sizing of pipes, design of processing equipment of heat exchangers, chilling, evaporation, concentration, mixing, filling,
agitation etc. It is also important in calculation of heat, mass
and momentum transfer phenomena during food processing
(Krokida et. al 2001; Rao 2007; Steffe 1992; Telis-Romero
et al. 1999). The quality parameter of fluid food which is
related to rheology is known as mouth-feel, is defined as the
mingled experience deriving from the sensation of skin of the
mouth after ingestion of a food or beverage and is related to
physical properties such as viscosity, density, surface tension
and other related properties of the fluid foods. The physical
properties of fluid foods have gained more importance as
rheological attributes of fluid foods have been developed
�J Food Sci Technol (April 2015) 52(4):1896–1910
1897
and quantified (Ingate and Christensen 1981). Fluid foods
were subjected to different temperatures and concentrations
during processing, storage, transportation, marketing etc.
where the rheological properties were more essential in handling and processing of the liquid food material. Among the
liquid foods, fruit products such as pulp, juice, concentrate,
serum and filtered/clarified juices are of commercial importance. The development of concentrated fluid foods is more
advantageous than single strength liquid as concentration of
liquid foods lead to decrease in water content and water
activity. The reduction in water activity of food helps its
stability and makes it convenient during storage, handling,
transportation and preparation of novel products with suitable
dilution/modifications to make convenient products such as
ready to serve (RTS) beverage, squash and concentrates etc.
Water activity of food is defined as the ratio of the equilibrium vapour pressure exerted in the food to the vapour pressure of pure water at constant temperature and also measure of
the amount of water available for microbial growth. It is also
refered as the ratio of escaping tendency of water fugacity in
the system to the escaping tendency of pure water. The fugacity of food system was closely approximated by vapour
pressur of food. The water activity is a measure of the energy
state of the water in the system and it is measure of free,
unbound and available water in the food system. There are
several factors that control the water activity in a food system,
the colligative effect of dissolved species (salts, sugars and
acids) interact with water through dipole-dipole, ionic and
hydrogen bonds. Influence of water activity may induce profound changes in the quality and stability of a food product
and is also an important requirement for packaging of food
material. Water activity is a critical factor that determines the
shelf life of the food. The water activity of food is a more
important factor than total moisture content for deciding the
quality and stability of food (Fennema 2005).
The rheological behaviour of fluid foods is evaluated by the
measurement of shear stress, shear rate data and representing
the experimental data by rheograms and empirical equations
as a function of concentration, temperature, particle size,
processing techniques etc. These properties are very much
helpful in understanding the flow mechanism of complex fluid
systems. The viscosity of fluid is markedly affected by temperature, concentration of solute, its molecular weight, pressure and suspended matter (Bourne 2002). The relationship
between shear stress and shear rate was described by OstwaldDe-Waele model or power law equation (Tavares et al. 2007;
Sanchez et al. 2009)
σ ¼ Kγ n
ð1Þ
where σ is shear stress (Pa), K is consistency index (Pa sn), γ
is shear rate (s−1) and n is flow behaviour index (-). If the fluid
is Newtonian in nature, n =1 and hence K becomes viscosity η
(Pa s) of the fluid. In general, liquid food such as fruit and
vegetable juices behave like Newtonian fluids; so their flow
behaviour would be Newtonian in nature. Several investigators reported that clarified and depectinated juices and their
concentrates exhibit Newtonian flow behaviour. (Juszczak
and Fortuna 2004; Cepeda and Villaran 1999; Ibarz et al.
1992a, b, 1987)
σ¼η γ
ð2Þ
where σ is shear stress (Pa), η is coefficient of viscosity (Pa s)
and γ is the shear rate (s−1). Several authors have used Newtonian equation for describing rheological behaviour of liquid
food products like pomegranate juice (Altan and Maskan 2005;
Kaya and Sozer 2005), Pekmez (Kaya and Belibagli 2002),
lime juice (Manjunatha et al. 2012a), gooseberry juice
(Manjunatha et al. 2012b), Tender coconut water (Manjunatha
and Raju 2013), liquorice extract (Maskan 1999).
Enzyme clarification is one of the most important techniques
to enhance qualitative and quantitative characteristics of juice.
Several authors studied the effect of enzyme clarification on
physicochemical characteristics of fruit juices were reported
(Rai et al. 2004; Lee et al. 2006; Sin et al. 2006; Abdullah
et al. 2007). The effect of the enzyme pectinase, incubation time
and temperature on rheological characteristics of mango pulp
was studied (Bhattacharya and Rastogi 1998). The effect of
temperature, total soluble solid content, pH and α-amylase concentration on rheological properties of papaya puree was studied
using response surface methodology (Ahmed and Ramaswamy
2004). The rheological behavior of enzyme treated goldenberry
(Physalis peruviana) juice was studied at two concentrations and
at wide range of temperatures (Sharoba and Ramadan 2011).
There are several studies reported that depectinisation using
enzymatic treatment such as pectinase enzymes, which could
effectively clarify the fruit juices (Chamchong and Noomhorm
1991; Ceci and Lozano 1998; Brasil et al. 1995; Kashyap et al.
2001; Vaillant et al. 2001; Yusof and Ibrahim, 1994; Aliaa et al.
2010; Matta et al. 2004; Singh and Gupta 2004; Cassano et al.
2007; Vandana and Das Gupta 2006).
Sapota (Achras sapota L.) is a tropical fruit belonging to
the family Sapotaceae native to Mexico, Central America, and
is extensively grown in other parts of world such as southern
Florida in the U.S., India, Sri Lanka, Indonesia, Philippines
and Caribbean Islands (Salunkhe and Desai 1984). The chemical composition and antioxidant activity of sapota juice was
reported by Kulkarni et al. (2007). The phenolic content and
antioxidant activity of mamey sapota (pouteria sapota) in
postharvest were evaluated and hydrophilic extract of sapota
fruit showed higher antioxidant capacity than that of lipophilic
portion. The appreciable amount of total soluble phenolic
content which contain mainly p-hydroxy benzoic acid had
been reported (Rodriguez et al. 2011; Yahia et al. 2011). The
sapota juice can be used as nutritional and nutraceutical health
�1898
beverage, which contains large amount of polyphenols.
Sapota juice can be used as a health-promoting beverage due
to its multifunctional properties. There is a lack of information
on rheological characteristics of enzyme clarified sapota juice
and its concentrates, which is essentially required for development of novel sapota juice products on large scale commercial production. The present investigation was aimed at studying the rheological behaviour of enzyme clarified sapota juice
and its concentrate at different temperatures and modeling of
these properties.
Material and methods
Raw material
The sapota fruits were purchased from local market in Mysore, India and allowed 24 h to ripen at room temperature
J Food Sci Technol (April 2015) 52(4):1896–1910
paar, Gmbh, Austria) equipped with coaxial cylinders
(CC 27) and the radii ratio of coaxial cylinders was
1.08477. The rheometer was equipped with an electric
temperature controlled peltier system (TEZ-15P-C) to
control the experimental temperature with an accuracy
of 0.01 °C and a circulating water bath was used
(Viscotherm VT-2, Paar Physica, Anton paar Gmbh,
Austria). The rheological parameter shear stress (Pa)
was measured linearly increasing up to a shear rate of
1,000 s−1 with 10 min duration and 30 shear stressshear rate data points were collected and analyzed using
universal software US200 (Paar Physica, Anton paar
Gmbh, Austria). The shear rate range used encompasses
most of the food processing applications such as
pumping, in-pipe flow, mixing, stirring and grinding
(Steffe 1992). The rheological measurements were carried out at different temperatures. All the measurements
were done in triplicate and fresh sample was used in
each measurement.
Juice extraction
Total soluble solid content
Fruits were washed with water twice and allowed to dry at room
temperature. The washed and dried fruits were peeled, deseeded
and blended using a waring blender (Model:W, Waring Laboratory, Torrington, CT) for 5 min until a homogenous fruit pulp
was obtained. The sapota pulp was pasteurized in water bath at
95 °C for 5 min to inactivate the enzymes. The enzyme based
clarification was carried out using commercial enzyme, pectinex
ultra SPL (Novozyme, Denmark). The concentration of enzyme, incubation temperature and time was fixed and clarification carried out as reported (Sin et al. 2006). The enzyme was
inactivated by placing the material in water bath maintained at
temperature 95 °C for 3 min and quickly cooled in ice cold
water. The sapota pulp was filtered with four fold muslin cloth
and pressed in tincture press (Hafio, West Germany). The
filtered sapota juice was centrifuged at a relative centrifugal
force of 15,000 rpm using continuous centrifuge (Model: LE
711368, CEPA, Lahr/Baden, and West Germany). The clarified
sapota juice was subjected to various concentrations.
The total soluble solids content of sapota juice was determined
using digital hand-held refractometer (Model: PAL-1, Atago
co, Ltd., Tokyo, Japan) with an accuracy of 0.1 and calibrated
using distilled water and total soluble solid content was
expressed as °brix.
pH
A digital pH meter was used to measure the pH of sapota juice
(Model: pH tutor, P/N 54X002606, Cyber scan, India) at
25 °C with an accuracy of 0.01. The instrument was calibrated
using standard buffers provided by manufacturer.
Moisture
Moisture content of enzyme clarified sapota juice was carried
out by vacuum oven method as reported (Ranganna 1986).
Juice concentration
Ash
The enzyme clarified sapota juice was concentrated by vacuum evaporation technique using laboratory rotary vacuum
evaporator (Model: Laborata 4001, Heidolph, Germany) with
reduced pressure, at temperature of 60 °C and rotation speed
of 60 rpm. Sapota juice was concentrated to different concentration levels and subjected to rheological measurements.
The ash content of the juice was measured gravimetrically by
drying the juice in hot air oven in silica crucible, ignited in hot
plate and placed in muffle furnace at 550 °C for 16 h and the
ash content was calculated by difference in weight and
expressed as % (Ranganna 1986).
Protein
Rheological measurements
The rheological measurements were carried out using
MCR100 controlled stress rheometer (Paar Physica, Anton
The protein content of enzyme clarified sapota juice was
estimated by micro-Kjeldahl method as reported (Ranganna
1986).
�J Food Sci Technol (April 2015) 52(4):1896–1910
Water activity
The water activity of sapota juice at different concentration
was measured using digital water activity meter at 25 °C
(Aqua Lab, model: 3 T E, Decagon devices, USA). The water
activity meter was calibrated using standard solutions at water
activity levels of 0.250, 0.500, 0.760 and 0.984 obtained from
original manufacturers (Decagon, Pullman WA, USA).
Acidity
The acidity of enzyme clarified sapota juice was determined
by titration method with standard 0.01 N NaOH solution using
phenolphthalein as indicator and expressed as % citric acid
(Ranganna 1986).
Sugars
Reducing sugar and total sugar of enzyme clarified sapota
juice were determined colorimetrically using 3–5, dinitro
salicylic acid reagent and expressed as percentage (Miller
1959).
Ascorbic acid
Ascorbic acid content of the juice was determined by titration
method using 2, 6 - dichloro-phenol Indo-phenol dye as
indicator and expressed as mg/100 ml of juice (Ranganna,
1986).
1899
refers to greenness, b* refers to yellowness and ‘-b’ refers to
blueness. The saturation index (Chroma) C* and hue angle h*
were calculated using following equations:
�0:5
Saturation indexðChromaÞ : C� ¼ a�2 þ b�2
hue angle : h� ¼ tan−1 ðb� =a� Þ
ð3Þ
Statistical analysis
The experimental results and data analysis was carried out
using statistical software (Statistica 7.0, Stat Soft Tulsa, USA).
The fitting and estimates were calculated at p≤0.05 significance level. The suitability of the models fitting was evaluated
by determining the correlation coefficient (r) and root mean
square error percent (rmse %) which was evaluated by the
following equation:
rmse % ¼ 100=n
hX
Wexp −Wcal =Wexp
�2 i1=2
ð4Þ
where Wexp is the experimental value, Wcal is the calculated
value and n is number of data sets. The suitability of the model
was decided based on higher correlation coefficient (r) and
low percent root mean square error (rmse %) values and level
of significance (p <0.05).
Results and discussion
Physicochemical characteristics
Total phenolics
The total phenolics content of the enzyme clarified sapota
juice was determined spectrophotometrically using FolinCiocalteu reagent and expressed as mg/100 ml as gallic acid
equivalent (Singleton et al. 1999).
Total flavonoids
The total flavonoids content of the enzyme clarified sapota
juice was determined spectrophotometrically using the method and expressed as mg/100 ml as catechin equivalent
(Zhishen et al. 1999).
Colour measurement
The color parameters of clarified sapota juice were measured
using Hunter color meter (Mini scan XE plus, model 45/0-S
Hunter laboratory Inc, Baton). Measurement was carried out
at 10° observations, D65 illuminant source and instrument
was calibrated using standard black and white tile provided
by manufacturer. The colour values were expressed in CIE
scale. where L* refers to lightness, a* refers to redness, -a*
The physicochemical characteristics of enzyme clarified
sapota (Achras sapota L.) juice is reported in Table 1. The
moisture content was found to be 81.31 % (wet basis) and total
soluble solid content was about 18.0 °brix. The solid content
of enzyme clarified sapota juice was mainly of soluble solids,
which constitutes mainly sugars and marginally organic acids.
The protein and ash content was 0.093 % and 0.446 % respectively. The sapota juice had appreciable amount of minerals mainly potassium, calcium and sodium. The pH and
acidity of sapota juice was 4.72 and 0.196 % as citric acid
respectively. The reducing sugar and total sugars was found to
be 11.17 % and 17.03 % respectively. The ascorbic acid
content of sapota juice was 3.72 mg/100 ml which was low
compared to reported values. This may be due to heat treatment during pasteurization and clarification processes, the
ascorbic acid being heat sensitive and water soluble in nature.
The enzyme clarified sapota juice had good amount of phenolics and flavonoids, which accounts for appreciable
amounts of antioxidant potential. The CIE colour values such
as lightness (L*), redness (a*) and yellowness (b*) were very
low which indicates appreciable extent of clarification. The
chroma (C*) and hue angle (h*) were found to be 3.064 and
�1900
J Food Sci Technol (April 2015) 52(4):1896–1910
Table 1 Physico-chemical characteristics of enzyme clarified sapota
(Achras sapota L.) juice
60
Parameter
Quantity
50
Moisture (%)
Ash (%)
Protein (%)
TSS (ºBrix)
81.31±0.060
0.446±0.047
0.093±0.001
18.0±0.05
Water activity (aw)
pH
Acidity (% citric acid)
Ascorbic acid (mg/100 ml)
Total phenolics (mg/100 ml Gallic acid)
Flavonoids (mg/100 ml catechin)
Reducing sugars (%)
Total sugar (%)
Colour values
L*
a*
b*
c*
h*
0.980±0.001
4.72±0.01
0.196±0.007
3.72±0.06
48.91±0.38
7.52±0.28
11.17±0.16
17.03±0.16
Shear stress (Pa)
40
30
20
10
0
0
200
400
600
800
1000
-1
Shear rate (s )
3.003±0.001
0.053±0.025
3.063±0.189
3.064±0.189
88.98±0.54
Mean ± S D (n =3)
* Indicate the colour values in CIE scale
88.98 respectively. The values reported were within the range
as reported with marginal variations. This deviation may be
due to processing, varietals difference, agro climatic conditions, maturity level etc. (Kulkarni et al. 2007; Gopalan et al.
2000; Pawar et al. 2011; Ganjayal et al. 2005; Ahmed et al.
2011; Mahattanatawee et al. 2006; Ma et al. 2004; Jain and
Jain 1998; Ilamaran and Amutha 2007; Rodriguez et al. 2011;
Almeida et al. 2011).
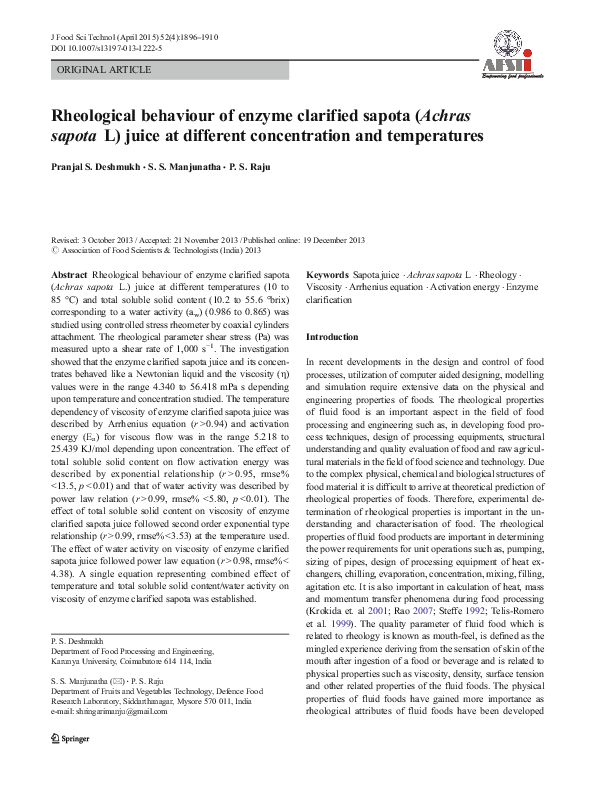
Fig. 1 Rheogram of enzyme clarified sapota (Achras sapota L.) juice at
constant total soluble solid content of 55.6 °B at temperature of 10 °C (black
square), 25 °C(black up-pointing triangle), 40 °C(black diamond suit),
55 °C(white up-pointing triangle), 70 °C (white square) and 85 °C (Plus sign)
showed that temperature and total soluble solid content or
water activity had a marked and significant effect on viscosity
of sapota juice. The viscosity of enzyme clarified sapota juice
was increased significantly (p <0.05) with the increase in
soluble solid content, whereas a significant (p <0.05) decrease
was observed with increase in water activity. The water activity of juice was dependant on solid content, nature of solute,
its physicochemical properties and solute-solvent interactions.
30
25
Flow behaviour
Figure 1 shows the relation between shear stress and shear rate
of enzyme clarified sapota juice of 55.6o brix at different
temperatures and Fig. 2 shows the relation between shear
stress and shear rate of enzyme clarified sapota juice at
25 °C at different soluble solid contents. The rheograms of
enzyme clarified sapota juice showed that there was linear
increase in shear stress with respect to increase in shear rate,
passed through origin while indicating the flow is Newtonian
in nature. The Newtonian model was able to describe the
relationship between shear stress and shear rate data. The
viscosity of clarified sapota juice could be estimated using
Newtonian model (σ=ηγ) and the correlation coefficient
values were greater than 0.969. The viscosity values of enzyme clarified sapota juice and its concentrates vary from
4.340 mPa s to 56.416 mPa s at different temperatures and
total soluble contents are reported in Table 2. The results
Shear stress (Pa)
20
15
10
5
0
0
200
400
600
800
1000
-1
Shear rate (s )
Fig. 2 Rheogram of enzyme clarified sapota (Achras sapota L.) juice at
constant temperature of 25 °C at total soluble solid content of 10.2 °brix
(Plus sign), 18.0 °brix (white square), 28.5 brix (white up-pointing
triangle), 38.9 °brix (black diamond suit), 49.4 °brix (black up-pointing
triangle) and 55.6 °brix (black square)
�J Food Sci Technol (April 2015) 52(4):1896–1910
1901
Table 2 Newtonian viscosity values of enzyme clarified sapota (Achras
sapota L.) juice at different temperatures and total soluble solid content/
water activity levels
Total soluble
solid content
(ºbrix)
Water
activity
(aw)
Temperature Newtonian
(°C)
viscosity (η)
(mPa s)
r
10.2
0.986
10
6.803±0.002
0.9847
25
40
55
70
85
10
25
40
55
70
85
10
25
40
55
70
85
10
5.828±0.002
5.206±0.002
4.808±0.002
4.541±0.003
4.340±0.002
7.910±0.002
6.576±0.003
5.773±0.003
5.284±0.005
4.942±0.006
4.676±0.005
9.484±0.003
7.981±0.005
6.856±0.006
6.083±0.005
5.692±0.003
5.425±0.008
12.487±0.011
0.9880
0.9882
0.9888
0.9882
0.9878
0.9788
0.9859
0.9877
0.9880
0.9888
0.9882
0.9752
0.9792
0.9839
0.9878
0.9866
0.9857
0.9967
25
40
55
70
85
10
25
40
55
70
85
10
25
40
55
70
85
10.117±0.012
9.034±0.010
7.919±0.002
7.154±0.009
6.833±0.002
30.699±0.029
16.446±0.024
11.763±0.015
10.595±0.016
9.659±0.009
9.362±0.012
56.416±0.064
27.722±0.017
17.067±0.054
12.540±0.023
11.304±0.017
10.236±0.004
0.9771
0.9734
0.9787
0.9829
0.9824
0.9999
0.9993
0.9831
0.9738
0.9704
0.9696
0.9999
0.9998
0.9992
0.9886
0.9748
0.9691
18.0
0.980
28.5
0.958
38.9
0.937
49.4
0.896
55.6
0.865
Mean ± SD (n =3)
The viscosity of enzyme clarified sapota juice decreased significantly (p <0.05) with increase in temperature. The viscosity of liquid foods strongly depends on inter-molecular forces
between molecules and water-solute (sugars and acids) interactions, which result from the inter-molecular spacing and
strength of hydrogen bonds as both are strongly affected by
temperature and concentration. An increased soluble solid
content leads to increase in hydrated molecules and hydrogen
bonding with hydroxyl groups of solute, which would increase
the viscosity of juice. In case of enzyme clarified sapota juice
soluble solids (sugars and acids) content plays a vital role in
magnitude of viscosity. The increase in temperature significantly decreases the magnitude of viscosity, because of increase in
thermal energy of the molecules which enhances mobility of
molecules and increases inter-molecular spacing (Krokida et al.
2001; Steffe 1992; Rao 2007). Several authors have reported
similar type of results with similar magnitude of viscosity
values for different juices and other liquid food products such
as cherry juice (Juszczak and Fortuna 2004), pineapple juice
(Shamsudin et al. 2007), orange juice (Ibarz et al. 2009),
pomegranate juice (Altan and Maskan 2005; Kaya and Sozer
2005), beetroot juice (Juszczak et al. 2010), lime juice
(Manjunatha et al. 2012a), gooseberry juice (Manjunatha
et al. 2012b), tender coconut water (Manjunatha and Raju
2013), kiwi fruit juice (Goula and Adamopoulos 2011), clarified fruit juices such as orange, black currant, peach, pear,
cherry, banana (Ibarz et al. 1994; Ibarz et al. 1992a; 1992b;
Ibarz et al. 1989; khalil et al. 1989), carrot juice (Vandresen
et al. 2009), sole juice (Ibarz et al. 1996), blueberry and raspberry juices (Nindo et al. 2005), apple and pear juices (Ibarz
et al. 1987), black chokeberry juice (Juszczak et al. 2009)
Liquorice extract (Maskan 1999), aqueous carbohydrate solutions (Telis et al. 2007).. The consistency coefficient k is
increased with total soluble solid content as well as particle
size and is decreased with increase temperature of watermelon
juice (Sogi et al. 2010). The viscosity of pomegranate juice is
significantly affected by total soluble content and temperature
while it was not affected by concentration method (Altan and
Maskan 2005). The viscosity of goldenberry juice was markedly affected by enzyme treatment and as well as temperature
(Sharoba and Ramadan 2011). Juszczak et al. (2010) reported
that beetroot juice concentrate had a lower viscosity than concentrated fruit juices with same soluble solid content and at the
same temperature studied. This deviation was due to its different levels of individual constituent sugars present in the juice.
The viscosity of aqueous carbohydrate solutions such as sucrose, glucose and fructose were reported at different temperatures and concentrations and the aqueous solution behaved like
a Newtonian liquid. The magnitude of viscosity decreased in
following order of solutes; sucrose, glucose, and fructose at
same temperature and concentration studied and these differences were reduced with increase in temperature and decreasing solution concentration (Telis et al. 2007) Chetana et al.
(2004) reported that sugar and sorbital solutions behaved like
Newtonian fluids while at other syrups such as polydextrose,
maltodextrin and polydextrose combination behaved like shear
thinning non-Newtonian flow behaviour with yield stress. The
results showed that the flow behaviour of polydextrose and
combination of maltodextrin+polydextrose syrups obeyed
Hershel–Bulkley model. The viscosity of liquid depends on
�1902
J Food Sci Technol (April 2015) 52(4):1896–1910
nature of solute, its molecular weight, molecular size and shape,
solute-solvent interactions, and state of hydration (Nindo et al.
2005; Telis et al. 2007; Fennema 2005).
where η = Viscosity (Pa s), η ∞ = Material constant/preexponential coefficient/frequency factor (Pa s), Ea =Flow activation energy (J/mol), R=Gas constant (J/mol K) and T=
Temperature (K).
The parameters of Arrhenius equation which was determined by least square approximation method is reported in
Table 3. The correlation coefficient was greater than 0.96 and
the activation energy for viscous flow was in the range 5.218
to 25.439 kJ/mol depending upon the soluble solid content.
The flow activation energy (Ea) was defined as minimum
energy required which overcomes the energy barrier before
the elementary flow can occur. The viscous flow occurs as a
sequence of events which are shift of particles in the direction
of shear force action from one equilibrium position to another
position by overcoming a potential energy barrier. The barrier
height determines the free activation energy of viscous flow.
Higher activation energy value indicates a greater influence of
temperature on the viscosity, i.e. more rapid change in viscosity with temperature. The magnitude of energy of activation
for viscous flow increased significantly (p <0.05) with increase in soluble solid content of the sapota juice, indicating
that higher energy was required to overcome potential energy
barrier at higher soluble solids content, where as significant
(p <0.05) increase was observed with decrease in water activity. The frequency factor (η∞) is significantly (p <0.05) decreased with increase in total soluble solid content and reported in Table 3 Therefore, temperature had a greater effect on
viscosity at higher soluble solid contents. When temperature
increased, the thermal energy of the molecules and intermolecular spacing increased significantly, which lead to decrease
in the magnitude of viscosity (Steffe 1992; Rao 2007). The
magnitude of flow activation energy of Newtonian fluids
increased significantly with increase in total soluble solid
content (Krokida et al. 2001). The activation energy for viscous flow was markedly affected by enzyme treatment of
goldenberry juice (Sharoba and Ramadan 2011). The magnitude of activation energy of viscous flow was in conforming to
values reported for other fluid foods (Juszczak and Fortuna
2004; Juszczak et al. 2009; 2010; Altan and Maskan 2005;
Kaya and Sozer 2005; Vandresen et al. 2009; Ibarz et al. 2009;
Manjunatha et al. 2012a, 2012b; Manjunatha and Raju 2013;
Telis et al. 2007; Chetana et al. 2004; Ibarz et al. 1994; Ibarz
et al. 1992a; 1992b; Ibarz et al. 1989; Ibarz et al. 1996; khalil
et al. 1989; Shamsudin et al. 2007; Sharoba and Ramadan
2011). The Arrhenius equation was satisfactorily described
the temperature dependency of viscosity of model solutions
such as sucrose, glucose, fructose and the flow activation
energy was correlated with solute content by unique equation
as a function of an effective volumetric fraction of solute
(Telis et al. 2007). The flow activation energy of concentrated
orange juice was increased marginally with shear rate and a
logarithmic model was reported for variation of flow activation energy with shear rate (Falguera and Ibarz 2010).
Table 3 Parameters of Arrhenius equation relating Newtonian viscosity
of enzyme clarified sapota (Achras sapota L.) juice to temperature at
different total soluble solid content and water activity levels
Effect of soluble solid content and water activity on flow
activation energy
Effect of temperature
The temperature had a major effect on the Newtonian viscosity similar to the effect on the consistency coefficient for nonNewtonian fluids. The increase in temperature of fluid leads to
increased in mobility of the molecules and increase in intermolecular spacing, which decreases the flow resistance. The
viscosity of sapota juice decreased markedly with increase in
temperature. The variation in viscosity of sapota juice with
temperature was significantly high at higher soluble solid
content. The effect of temperature on the viscosity of sapota
juice with different soluble solid contents/water activity was
described using the Arrhenius equation:
η ¼ η∞ ExpðEa =R T Þ
ð5Þ
Total soluble
solid content
(TSS) (ºB)
Water η∞ (mPa s)
activity
(aw)
10.2
18.0
0.986
0.980
28.5
38.9
49.4
55.6
0.958
0.937
0.896
0.865
0.723a ±0.001
0.572b ±0.003
Flow activation r
energy (Ea)
(KJ/mol)
5.218a ±0.003 0.9879
6.115b ±0.013 0.9871
0.541c ±0.003
6.693c ±0.014
d
0.600 ±0.004
7.084d ±0.019
e
0.0202 ±0.0001 17.051e ±0.013
0.00111f ±0.00001 25.439f ±0.001
0.9904
0.9918
0.9474
0.9826
Mean±SD (n =3), Different superscripts in columns show significantly
different at p <0.05
The activation energy for viscous flow of sapota juice increased significantly (p <0.05) with increase in soluble solid
content whereas it decreased significantly (p <0.05) with increase in water activity and both trends were non-linear in
nature. The variation of activation energy with concentration
and water activity could be described by different models,
such as power law and exponential type relations
E a ¼ aðC Þb
Ea ¼ a Expðb C Þ
Ea ¼ aðaw Þb�
Ea ¼ a Expðb� aw Þ
ð6Þ
�J Food Sci Technol (April 2015) 52(4):1896–1910
1903
where Ea is activation energy (kJ/mol), a is empirical constant
(kJ/mol), C is total soluble solid content (obrix), aw is the water
activity (-), a, b,, b* are empirical constants. These models
were fitted with activation energy values which were obtained
by Arrhenius equation with soluble solid content and water
activity by the method of least square approximation at 5 %
significant level (p <0.05). The magnitudes of the parameters
of above four models, correlation coefficient (r) and percent
root mean square error (rmse%) are reported in Table 4. The
results indicated that exponential model (r =0.9588, rmse%=
13.44, p <0.05) was more effective to describe the influence
of total soluble solid content on flow activation energy of
sapota juice. The power law model had lower values of
correlation coefficient (r), higher root mean square error value.
This indicated that the flow activation energy increased exponentially with total soluble solid content. The effect of water
activity on flow activation energy was described by power law
equation (r=0.9909, rmse %=5.80, p <0.01), where as the
exponential model the correlation coefficient was lower and
the percent root mean square error values are higher. The
results showed that the relation between activation energy
for viscous flow of sapota juice with total soluble solid
content/water activity was non-linear. The relationship between flow activation energy and total soluble solid content/
water activity were given by
E a ¼ 1:5603 � Expð0:049 C Þ; ðr ¼ 0:9588; rmse% ¼ 13:44; p < 0:05Þ
E a ¼ 3:890ðaw Þ−12:985
ðr ¼ 0:9909; rmse% ¼ 5:80; p < 0:01Þ
where Ea is the flow activation energy (kJ/mol), C is total
soluble solid content (obrix), aw is the water activity (-). The
variation of flow activation energy increased exponentially
with total soluble solid content. Similar type of exponential
relation was reported relating to flow activation energy to total
soluble solid content. The magnitude of the coefficient concentration was found to be 0.049 and it was within the range as
reported for different fruit juices such as pomegranate, pineapple, cherry, peach, chokeberry, lime, gooseberry and tender
coconut water (Altan and Maskan 2005; Kaya and Sozer
2005; Shamsudin et al. 2007; Giner et al. 1996; Ibarz et al.
1992a; Juszczak et al. 2009: Manjunatha et al. 2012a; 2012b;
Manjunatha and Raju 2013). It was reported that flow activation energy increased significantly with square of total soluble
solid content for blue berry and raspberry juices, where as it
Table 4 Parameters of different
models relating to flow activation
energy (Ea) with total soluble
solid content and water activity of
enzyme clarified sapota (Achras
sapota L.) juice
Mean ± SD (n =3)
increased quadratically with soluble solid content in case of
liquorice (Glycyrrhiza glabra ) extract (Nindo et al. 2005;
Maskan 1999). The flow activation energy was increased
linearly with total dissolved solid content in case of blueberry
puree (Nindo et al. 2007). The deviation in models and model
coefficient was due nature solute, size, shape, solute-solvent
interactions, hydration state and range of temperature and
soluble solid content studied. The flow activation decreased
significantly (p <0.05) with increased in water activity by
power law relation and magnitude of decrease was high,
which indicated that flow activation energy sensitive to water
activity of sapota juice. Similar type of results was reported for
different liquid foods. The magnitude of coefficient (b) of
water activity was found to be −12.985 in case enzyme
clarified sapota juice. The magnitude of power law coefficient
(b) of variation with flow activation energy with water activity
is comparable with values of lime juice and tender coconut
water (Manjunatha et al. 2012a; Manjunatha and Raju 2013).
Effect of total soluble solid content
The concentration of the soluble solids and insoluble solids
had strong effect on the viscosity of the Newtonian fluids,
where as consistency index and apparent viscosity of nonNewtonian fluids (Krokida et al. 2001). The viscosity of a
liquid food depends on the nature of solvent, nature of solute,
their interaction, and amount of solid content in solution,
solute shape, size and state of hydration. The viscosity of
sapota juice increased significantly (p <0.05) with increase
in total soluble solid content. The variation in viscosity with
soluble solid content was due to variation in degree of hydration of solute molecules, increase in hydrogen bonding with
hydroxyl groups of solute and decrease in inter-molecular
spacing. The variation of viscosity of sapota juice with total
soluble solid content was non-linear in nature. The different
models namely power law and exponential model of different
orders were used to investigate the variation in viscosity with
soluble solid content at particular temperature used. Several
investigators had used these models to investigate the effect of
soluble solid content on viscosity of different fluids (Ibarz
et al. 2009; Ibarz et al. 1989; Manjunatha et al. 2012a; 2012b;
Manjunatha and Raju 2013; Altan and Maskan 2005; Kaya
and Sozer 2005; Shamsudin et al. 2007; Giner et al. 1996;
Juszczak et al. 2009; Ibarz et al. 1992a; Juszczak et al. 2010;
Juszczak and Fortuna 2004; Nindo et al. 2005).
Model
a (KJ/mol)
b (Brix−1)/(−)
r
rmse%
Ea =a(C)b
Ea =a Exp (bC)
Ea =a (aw)b
Ea =a Exp (b aw)
0.0055±0.0001
1.5603±0.0031
3.890±0.002
5795063.25±31718.73
2.079±0.005
0.0492±0.0001
−12.985±0.005
−14.260±0.006
0.9089
0.9588
0.9909
0.9903
20.44
13.44
5.80
6.20
�1904
J Food Sci Technol (April 2015) 52(4):1896–1910
Power law type :
η ¼ a ðC Þb
Exponential type; First order :
η ¼ a Expðb C Þ
Exponential type; second order :
η ¼ a Exp b C þ c C 2
juice and tender coconut water (Ibarz et al. 1989;
Manjunatha et al. 2012a; Manjunatha and Raju 2013).
�
Effect of water activity
ð7Þ
where η is the viscosity (mPa s), a is constant (mPa s), b is
constant (brix−1), c is a constant (brix−2) and C is total soluble
solid content (o brix).
The parameters of the above models were estimated by
least square approximation method at 95 % confidence level
(p <0.05). The parameters of variation in viscosity of sapota
juice with soluble solid content by three models namely power
law; exponential first order and exponential second order at
different temperatures are shown in Tables 5, 6, and 7 respectively. The correlation coefficients were 0.9075≤r ≤0.9614,
0.9612≤r ≤0.9922 and 0.9944≤r ≤0.9992 for power law, exponential first order and exponential second order models
respectively. The root mean square error percentage values
were 5.47≤rmse%≤24.4, 2.24≤rmse%≤17.02 and 0.52≤
rmse%≤3.52 for power law, exponential first order and exponential second order models respectively. The parameter ‘b’ in
power law and exponential models decreased significantly
(p <0.05) with increase in temperature. This indicated that at
lower temperatures, the viscosity of sapota juice increases
rapidly when concentration increases, which could be due to
marked change in thermal energy of the molecules and
inter-molecular spacing. The exponential type of second
order was better to describe the influence of total soluble solid content on viscosity of sapota juice at different
temperatures (r ≥0.99, rmse%≤3.53). The parameters of
second order exponential model are shown in Table 7
and parameter ‘a’ decreasing significantly with increasing temperature. The suggested model result indicated
that the variation viscosity of sapota juice was sensitive
to total soluble solid content because the parameter ‘c’
which relates the viscosity quadratically with concentration. The second order exponential model was better to
describe the relation between total soluble solid content
on viscosity of sapota juice at different temperatures.
Similar type of results was reported for pear juice, lime
Table 5 Parameters of power law
model relating Newtonian viscosity with total soluble solid
content of enzyme clarified sapota
(Achras sapota L.) juice at different temperatures
Mean ± SD (n =3), Different superscripts in columns show significantly different at p <0.05
The water activity of fluid was dependent on amount of solid
content, nature of solute, its physicochemical properties such
as molecular weight, size, shape and solute-solvent interactions. The variation in viscosity of sapota juice to water
activity was non linear in nature and several authors were
suggested by two model equations namely power law and
exponential type models as (Ibarz et al. 1992b; 1994;
Manjunatha et al. 2012a; Manjunatha and Raju 2013)
Power law ;
η ¼ a ð aw Þ b
Exponential type; η ¼ a expðb aw Þ
ð8Þ
where η is the viscosity (mPa s), a is constant (mPa s), b is
constant (-) and aw is water activity (-). The parameters of the
power law and exponential models were estimated by the
method of least squares at 95 % confidence level (p <0.05).
The parameters of the models correlation coefficient and
percent root mean square error and are shown in Tables 8
and 9 respectively. The correlation coefficient was in 0.9808≤
r ≤0.9985 and 0.9836≤r ≤0.9981; whereas percent root mean
square error values 1.46≤rmse%≤4.38 and 1.52≤rmse%≤
5.19 for power law and exponential models respectively.
The results indicated that power law model suitable for describing the viscosity of sapota juice with specific water
activity level. The parameter ‘b’ of power law model was
negative which indicated that the viscosity would decrease
with increase in water activity as water activity mainly depends on solid content of the sapota juice. The water activity
of liquid foods is dependent on concentration of the soluble
solids, insoluble solids, nature of solute and solute-solvent
interactions reported to have a strong non-linear effect on the
viscosity of Newtonian fluids (Krokida et al. 2001). The
magnitude of parameter ‘b’ of models decreased significantly
(p <0.05) with increase in temperature which indicated that
the effect of water activity on viscosity markedly high at lower
Power law model: η =a (C)b
Temperature (°C)
a (mPa s)
b (Brix−1)
r
rmse%
10
25
40
55
70
85
1.088×10⁻⁵a ±2.702×10⁻⁷
0.032b ±0.001
0.376c ±0.003
0.668d ±0.006
0.709e ±0.002
0.745f ±0.001
3.838a ±0.007
1.645b ±0.004
0.912c ±0.002
0.709d ±0.003
0.668e ±0.001
0.638f ±0.001
0.9614
0.9075
0.9178
0.9460
0.9415
0.9476
24.40
15.83
8.48
6.10
5.88
5.47
�J Food Sci Technol (April 2015) 52(4):1896–1910
1905
Table 6 Parameters of first order exponential model relating Newtonian
viscosity with total soluble solid content of enzyme clarified sapota
(Achras sapota L.) juice at different temperatures
Table 8 Parameters of power law model relating Newtonian viscosity
with water activity of enzyme clarified sapota (Achras sapota L.) juice at
different temperatures
First order exponential model: η =a Exp (bC)
Power law Model : η=a (aw)b
Temperature (°C) a (mPa s)
10
25
40
55
70
85
b (%−1)
0.815a ±0.004 0.0755a ±0.0001
2.191b ±0.004 0.0440b ±0.0001
3.136c ±0.006 0.0284c ±0.0012
3.367d ±0.007 0.0233d ±0.0001
3.218e ±0.003 0.0222de ±0.00003
3.165f ±0.001 0.0212e ±0.00001
r
rmse%
0.9796 17.02
0.9612 9.40
0.9729 4.43
0.9922 2.48
0.9906 2.49
0.9907 2.24
Temperature (°C) a (mPa s)
b (-)
r
rmse%
−17.300a ±0.014
−12.198b ±0.009
−8.684c ±0.022
−6.981d ±0.019
−6.713e ±0.012
−6.359f ±0.001
0.9985
0.9965
0.9956
0.9909
0.9922
0.9808
4.38
2.36
1.46
2.08
1.75
2.41
4.579a ±0.004
4.626b ±0.002
4.779c ±0.005
4.692d ±0.004
4.395e ±0.003
4.237f ±0.001
10
25
40
55
70
85
Mean±SD (n =3), Different superscripts in columns show significantly
different at p <0.05
Mean ± SD (n =3), Different superscripts in columns show significantly
different at p <0.05
temperatures. At lower temperatures the change in viscosity of
sapota juice was more rapid compared to that at higher temperatures. Similar type of results was reported for other liquid
foods (Ibarz et al. 1994; Ibarz et al. 1992b; Manjunatha et al.
2012a; Manjunatha and Raju 2013). The second order polynomial equation was reported for variation of viscosity with
water activity of some model solutions such as sodium chloride, glycerol, sucrose, and urea (Mazurkiewicz et al. 2001).
These variations may be due nature of solute, its molecular
weight, molecular size and shape, solute-solvent interactions,
and state of hydration (Nindo et al. 2005; Telis et al. 2007;
Fennema 2005).
Raju 2013; Juszczak and Fortuna 2004; Nindo et al.
2007). The model equations were
Combined effect of temperature and total soluble solid content
From the food process engineering point of view, it is
important to obtain a single equation which describes
both temperature and soluble solid content on viscosity
of sapota juice. Several authors have used different
equations to describe the combined effect of temperature
and soluble solid content on viscosity of the fluids
(Juszczak et al. 2009; Juszczak et al. 2010; Ibarz
et al. 2009; Altan and Maskan 2005; Kaya and Sozer
2005; Giner et al. 1996; Ibarz et al. 1996; Nindo et al.
2005; Manjunatha et al. 2012a, 2012b; Manjunatha and
Table 7 Parameters of second
order exponential model relating
Newtonian viscosity with total
soluble solid content of enzyme
clarified sapota (Achras sapota
L.) juice at different temperatures
Mean ± SD (n =3), Different superscripts in columns show significantly different at p <0.05
Power law type :
η ¼ aðC Þc � ExpðEa =RT Þ
Exponential type first order :
η ¼ a ExpðE a =RT þ c C Þ
Exponential type second order : η ¼ a Exp Ea =RT þ c C þ d C 2
�
ð9Þ
where η is the viscosity (mPa s), a is pre-exponential constant
(mPa s), b=Ea/R, Ea is the flow activation energy (J/mol), R is
universal gas constant (J/mol K), T is absolute temperature
(K), c is constant (brix−1), d is constant (brix−2) and C is total
soluble solid content (obrix).
The values of viscosity shown in Table 2 were fitted to the
above equations by the method of least squares using multiple
regression analysis. The fits and estimates of the parameters
were determined at 5 % significant level (p <0.05). The suitability of the model was decided based on correlation coefficient (r) and percent root mean square error (rmse%) values.
Table 10 shows the parameters for the different models, correlation coefficients and percent root mean square errors. The
correlation coefficients were 0.9042, 0.9344 and 0.9553 for
power law, exponential first order and exponential second
order models, whereas percent root mean square error values
9.22, 7.22 and 5.90 respectively. The second order exponential
Second order exponential Model: η=a Exp (b C+c C2)
Temperature (°C)
a (mPa s)
b (Brix−1)
c (Brix−2)
r
rmse%
10
25
40
55
70
85
10.575a ±0.007
8.201b ±0.009
5.661c ±0.024
4.367d ±0.003
4.205e ±0.016
3.755e ±0.010
−0.0479a ±0.0001
−0.0338b ±0.0001
−0.0092c ±0.0003
0.0060d ±0.0001
0.0043e ±0.0003
0.0097f ±0.0002
0.00140a ±0.00001
0.000996b ±0.000001
0.000515c ±0.000006
0.000236d ±0.000003
0.000246d ±0.000004
0.000246d ±0.000004
0.9990
0.9957
0.9944
0.9992
0.9992
0.9945
3.53
3.11
1.78
0.63
0.52
1.24
�1906
Table 9 Parameters of exponential model relating Newtonian
viscosity with water activity of
enzyme clarified sapota (Achras
sapota L.) juice at different
temperatures
Mean ± SD (n =3), Different superscripts in columns show significantly different at p <0.05
J Food Sci Technol (April 2015) 52(4):1896–1910
Exponential Model : η=a exp (baw)
Temperature (°C)
a (mPa s)
10
849162102.2a ±12773932.89
25
40
55
70
85
b
2815305.33 ±26342.11
60603.79b ±1370.57
9365.69b ±186.17
6535.42b ±79.00
4344.59b ±1.63
equation was better to describe the combined effect of temperature and total soluble solid content on viscosity of sapota juice,
because of high correlation coefficient and low percent root
mean square error values, where the values of other models
were low correlation coefficient (r) and high root mean square
error percent (rmse%) compared to second order exponential
model. The final equation which represents the combined effect
of temperature and total soluble solid content on viscosity of
enzyme clarified sapota juice was given by
�
η ¼ 2:809 � 10−3 Exp 2382:48=T −0:0366 C þ 0:0011 C 2 ;
b (-)
r
rmse%
−19.112a ±0.016
0.9981
5.19
−13.358b ±0.010
−9.471c ±0.024
−7.618d ±0.021
−7.322e ±0.013
−6.942f ±0.001
0.9951
0.9951
0.9928
0.9940
0.9836
2.84
1.61
1.85
1.52
2.18
Ibarz et al. 1989; Manjunatha et al. 2012a; Manjunatha and
Raju 2013). Altan and Maskan (2005) reported that the viscosity of pomegranate juice was strongly depends on total soluble
solid content and temperature irrespective of method of concentration. The viscosity of fluid depends on nature solute, size,
and shape state of hydration of the molecules in juice. The
solute and solvent interaction was different for different types
of solutes. In case of sapota juice the soluble solids were mainly
sugars, such as glucose, fructose and sucrose. The state of
hydration was different for different sugars and magnitude of
viscosity depends on type of sugar and fractions present in the
juice (Nindo et al. 2005; Telis et al. 2007).
ðr ¼ 0:9553; rmse% ¼ 5:90; p < 0:05Þ
Combined effect of temperature and water activity
where η is viscosity in mPa s, T is temperature in Kelvin (K)
and C is total soluble solid content in oBrix. The viscosity of
enzyme clarified sapota juice was significantly (p <0.05) affected by temperature and total soluble solid content of sapota
juice. The surface plot that described the combined effect of
temperature and total soluble solid content on viscosity of
sapota juice at different temperatures and concentrations is
shown in Fig. 3. The magnitude of viscosity depends on both
temperature and total soluble solid content of sapota juice. At
lower temperatures the magnitude of viscosity increased rapidly with soluble solid content and increased marginally at higher
temperatures, this was due to increase in thermal energy of the
molecules and increase in intermolecular spacing at higher
temperatures this strongly affected the viscosity. Similar type
of results was reported for other fluid foods (Nindo et al. 2005;
It was also very important to establish a combined single
equation relating temperature and water activity on viscosity
of sapota juice. The two models were used to obtain a single
equation for describing the combined effect of temperature
and water activity on viscosity of sapota juice. Generally,
power law and exponential type equation were used to describe the combined effect of temperature and water activity
on viscosity of juices.
Power law model : η ¼ a ExpðE a =RT Þ � ðaw Þc
Exponential model : η ¼ a ExpðE a =RT þ c aw Þ
ð10Þ
where η is the viscosity (m Pa s), a is pre-exponential constant
(m Pa s), b=Ea/R, Ea is flow activation energy (J/mol), R is the
Table 10 Parameters of different models relating combined effect of temperature and total soluble solid content on Newtonian viscosity of enzyme
clarified sapota (Achras sapota L.) juice
c (Brix−1)
Model
a (mPa s)
b=Ea/R (K)
Power Law: η=a (C)c Exp(Ea/RT)
First order exponential
η=a Exp(Ea/RT+c C)
Second order exponential
η=a Exp(Ea/RT+c C+d C2)
1.183×10⁻⁶ ±3.465×10⁻⁸
5.945×10⁻⁴ ±4.618×10⁻⁶
2390.54±1.72
2366.68±1.36
2.244±0.006
0.0523±0.0001
2.809×10⁻³ ±1.102×10⁻⁵
2382.48±1.29
−0.0366±0.0001
Mean ± SD (n =3)
d (Brix−2)
r
rmse%
–
–
0.9042
0.9344
9.22
7.22
0.0011±0.00001
0.9553
5.90
�J Food Sci Technol (April 2015) 52(4):1896–1910
Fig. 3 Surface plot for combined effect of total soluble solid content and
temperature on viscosity of enzyme clarified sapota (Achras sapota L.)
juice
universal gas constant, T is absolute temperature (K), aw is the
water activity (-) and c is constant (-).
The viscosity of sapota juice at different temperature
and water activity in Table 2 were fitted using multiple
regression analysis by method of least squares at 5 %
significant level. The parameters of combined effect of
temperature and water activity were reported in Table 11.
The correlation coefficients were 0.9553 and 0.9547 for
power law and exponential models, whereas percent
root mean square error was 5.93 and 5.98 respectively.
Both the models were able to describe the combined
effect of temperature and water activity on sapota juice,
since the correlation coefficients and root mean square
value were almost similar magnitude. The parameter ‘c’
of the model was negative, which indicated that viscosity of sapota juice decreased with increase in water
activity. The water activity of fluid mainly depends on
nature of solute and its concentration, solute-solvent
interactions. The combined equations which related to
temperature and water activity on viscosity of sapota
juice were given by
1907
Fig. 4 Surface plot for combined effect of water activity and temperature
on viscosity of enzyme clarified sapota (Achras sapota L.) juice
η ¼ 1:513 � 10−3 ðaw Þ−13:695 Expð2380:02=T Þ; ðr ¼ 0:9553; rmse% ¼ 5:93Þ
η ¼ 4913:16 � Expð2379:47=T −15:040 aw Þ; ðr ¼ 0:9547; rmse% ¼ 5:98Þ
where η is the viscosity (mPa s), a is pre-exponential constant
(mPa s), T is temperature (K) and aw is water activity (-).
Figure 4 shows the surface plot for the combined effect of
temperature and water activity on viscosity of sapota juice at
different temperature and water activity levels. The magnitude
of viscosity of sapota juice increased rapidly at lower water
activities where as increased marginally at higher water activity levels. This indicated that both temperature and water
activity had significant effect on viscosity of sapota juice
and at higher temperatures the mobility of molecules was
higher due to its higher kinetic energy and also increase in
inter-molecular spacing. Similar types of results were reported
for different fruit juices (Ibarz et al. 1994; Ibarz et al. 1992b;
Manjunatha et al. 2012a; Manjunatha and Raju 2013). These
results were very useful in processing, designing of equipments and up scaling of process of sapota juice and their
concentrates in large scale commercial production.
Table 11 Parameters of different models relating combined effect of temperature and water activity on Newtonian viscosity of enzyme clarified sapota
(Achras sapota L.) juice
Model
a (mPa s)
b=Ea/R (K)
c (-)
r
rmse%
Power Law: η=a (aw)c Exp(Ea/RT)
Exponential model: η=a Exp(Ea/RT+c aw)
1.513×10⁻³ ±7.550×10⁻⁶
4913.16±50.77
2380.02±1.25
2379.47±1.26
−13.695±0.014
−15.040±0.016
0.9553
0.9547
5.93
5.98
Mean ± SD (n =3)
�1908
J Food Sci Technol (April 2015) 52(4):1896–1910
The enzyme clarified sapota juice and its concentrates behaved like Newtonian fluid. The Newtonian viscosity of enzyme clarified sapota juice and its concentrates were in the
range 4.340 to 56.416 mPa s depending upon temperature (10
to 85 °C) and total soluble solid content (10.2 to 55.6 °brix)
corresponding water activity (0.986 to 0.865). The viscosity of
enzyme clarified sapota juice was increased significantly (p <
0.05) with increase in solid content whereas it decreased
significantly (p <0.05) with increase in water activity. The
viscosity of sapota juice decreased significantly (p <0.05)
with increase in temperature. The effect of temperature on
viscosity of enzyme clarified sapota juice followed Arrhenius
equation (r >0.94) and activation energy for viscous flow was
in the range from 5.218 to 25.439 kJ/mol depending upon the
total soluble solid content studied. The effect of total soluble
solid content on flow activation energy followed exponential
type relation (r >0.95) where as it followed power law equation with water activity (r >0.99). The effect of total soluble
solid content on viscosity of enzyme clarified sapota
juice followed by second order exponential type equation (r > 0.99) at temperature studied. The effect of
water activity on viscosity of enzyme clarified sapota
juice followed power law type equation (r > 0.98) at
temperature studied. The combined effect of temperature
and total soluble solid content/water activity on viscosity was described by the equations
�
η ¼ 2:809 � 10−3 Exp 2382:48=T −0:0366 C þ 0:0011 C 2 ;
η ¼ 1:513 � 10−3 ðaw Þ−13:695 Exp ð2380:02=T Þ ;
η ¼ 4913:16 � Exp ð2379:47=T −15:040 aw Þ ;
ðr ¼ 0:9553; rmse% ¼ 5:90Þ
ðr ¼ 0:9553; rmse% ¼ 5:93Þ
ðr ¼ 0:9547; rmse% ¼ 5:98Þ
where, η is the viscosity (mPa s), a is pre-exponential constant
is mPa s, T is temperature in Kelvin (K) and C is the total
soluble solid content in °brix, aw is water activity (-).
Bourne MC (2002) Food texture and viscosity: Concept and measurement. Academic press, London
Brasil IM, Mala GA, Figueiredo RW (1995) Physical chemical changes
during extraction and clarification of guava juice. Food Chem 54(4):
383–386
Cassano A, Donato L, Drioli E (2007) Ultrafiltration of kiwifruit juice:
Operating parameters, juice quality and membrane fouling. J Food
Eng 79:613–621
Ceci L, Lozano J (1998) Determination of enzymatic activities of commercial pectinases for the clarification of apple juice. Food Chem
61:237–241
Cepeda E, Villaran MC (1999) Density and viscosity of malus floribunda
juice as a function of concentration and temperature. J Food Eng 41:
103–107
Chamchong H, Noomhorm A (1991) Effect of pH and enzymatic treatment on microfiltration and ultra filtration of tangerine juice. J Food
Process Eng 14:21–34
Chetana R, Krishnamurthy S, Reddy SRY (2004) Rheological behaviour
of syrups containing sugar substitutes. Euro Food Res Technol 218:
345–348
Falguera V, Ibarz A (2010) A new model to describe flow behaviuor of
concentrated orange juice. Food Biophy 5:114–119
Fennema OR (2005) Food Chemistry, 3rd edn. Marcel Dekker Inc, New
York
Ganjayal GM, Hanna MA, Devadattam DSK (2005) Processing of
Sapota (Sapodilla): Powdering. J Food Technol 3(3):326–330
Giner J, Ibarz A, Garza S, Xhian-Quan S (1996) Rheology of clarified
cherry juice. J Food Eng 30:147–154
Gopalan C, Rama Sastri BV, Balasubramanian SC (2000) Nutritive value
of Indian foods. National Institute of Nutrition, Indian Council for
Medical Research, Hyderabad
Goula AM, Adamopoulos KG (2011) Rheological models of kiwifruit
juice for processing applications. Food Process Technol 2(1) (DOI:
10.4172/2157-7110.1000106)
Ibarz A, Vicente M, Graell J (1987) Rheological behaviour of apple and
pear juice and their concentrates. J Food Eng 6:49–61
Ibarz A, Pagan J, Gutierrez J, Vicente M (1989) Rheological properties of
clarified pear juice concentrates. J Food Eng 10:57–63
Conclusions
Acknowledgments The authors thank Dr P S Raju, Head, Department
of Fruits and vegetable technology, Defence Food Research Laboratory,
Mysore, India and Dr H V Batra, Director, Defence Food Research
Laboratory, Mysore, India to carryout the experimental work and permission for publication of the research work.
References
Abdullah AGL, Sulaiman NM, Aroua MK, Noor MJMM (2007)
Response surface optimization of conditions for clarification of
carambola fruit juice using a commercial enzyme. J Food Eng 81:
65–71
Ahmed J, Ramaswamy HS (2004) Response surface methodology in
rheological characteristization of papaya puree. Int J Food Prop
7(1):45–58
Ahmed T, Burhanuddin M, Haque MA, Hossain MA (2011) Preparation
of jam from Sapota (Achras Zapota L.). The Agriculturist
9(1&2):1–7
Aliaa ARN, Mazlina MKS, Taip FS, Abdullah AGL (2010) Response
surface optimization for clarification of white pitaya juice using a
commercial enzyme. J Food Process Eng 33(2):333–347
Almeida MMB, Sousa PHMD, Arriaga AMC, Prado GMD, Maghalhaes
CEDC, Maia GA, Lemos TLGD (2011) Bioactive compounds and
antioxidant activity of fresh exotic fruits from northeastern Brazil.
Food Res Int 44:2155–2159
Altan A, Maskan M (2005) Rheological behaviour of pomegranate
(Punica granatum L) juice and concentrate. J Texture Stud 36:68–77
Bhattacharya S, Rastogi NK (1998) Rheological properties of enzymetreated mango pulp. J Food Eng 36:249–262
�J Food Sci Technol (April 2015) 52(4):1896–1910
Ibarz A, Gonzales C, Espluguas S, Vincente M (1992a) Rheology of
clarified juices 1: Peach Juices. J Food Eng 15:206–216
Ibarz A, Pagan J, Miguelsanz R (1992b) Miguelsanz R (1992b) Rheology
of clarified fruit juices. II: Blackcurrant juices. J Food Eng 15:63–73
Ibarz A, Gonzalez C, Esplugas S (1994) Rheology of clarified fruit juices.
III: Orange juices. J Food Eng 21:485–494
Ibarz A, Garvin A, Costa J (1996) Rheological behaviour of Sloe (Prunus
spinosa) fruit juices. J Food Eng 27:423–430
Ibarz R, Falguera V, Garvin A, Garza S, Pagan J, Ibraz A (2009) Flow
behaviour of clarified orange juice at low temperatures. J Texture
Stud 40:445–456
Ilamaran M, Amutha S (2007) Effect of total soluble solids and CO2
pressure on physico-chemical and sensory qualities of carbonated
banana and sapota beverages. J Food Sci Technol 44(2):178–182
Ingate MR, Christensen CM (1981) Perceived textural dimensions of fruit
based beverages. J Texture Stud 12:121–132
Jain RK, Jain SK (1998) Sensory evaluation of an intermediate
moisture product from sapota (Achras Zapota L.). J Food
Eng 37:323–330
Juszczak L, Fortuna T (2004) Effect of temperature and soluble solid
content on the viscosity of cherry juice concentrate. Int Agrophy 18:
17–21
Juszczak J, Witczak M, Galkowska D (2009) Flow behaviour of black
chokeberry (Aronia melanocarpa) juice. Int J Food Eng 5(1):Article
1 (DOI: 10.2202/1556-3758.1305)
Juszczak J, Witczak M, Fortuna T, Solarz B (2010) Effect of temperature
and soluble solids content on the viscosity of beetroot (Beta
vulgaris) juice concentrate. Int J Food Prop 13:1364–1372
Kashyap DR, Vohra PK, Chopra S, Tewari R (2001) Application of
pectinases in the commercial sector: A review. Bioresource
Technol 77:215–227
Kaya A, Belibagli KB (2002) Rheology of solid Gaziantep Pekmez. J
Food Eng 54:221–226
Kaya A, Sozer N (2005) Rheological behaviour of sour pomegranate
juice concentrates (Punica granatum L.). Int J Food Sci Technol 40:
223–227
Khalil KE, Ramakrisna P, Nanjundaswamy AM, Patwardhan MV (1989)
Rheological behaviour of clarified banana juice: Effect of temperature
and concentration. J Food Eng 10:231–240
Krokida MK, Maroulis ZB, Saravacos GD (2001) Rheological properties
of fluid fruit and vegetable puree products: Compilation of literature
data. Int J Food Prop 4(2):179–200
Kulkarni AP, Policegoudra RS, Aradhya SM (2007) Chemical composition and antioxidant activity of Sapota (Achras Sapota L.) fruit. J
Food Biochem 31:399–414
Lee WC, Yusof S, Hamid NSA, Baharin BS (2006) Optimizing conditions for enzymatic clarification of banana juice using response
surface methodology (RSM). J Food Eng 73:55–63
Ma J, Yang H, Basile MJ, Kennelly EJ (2004) Analysis of polyphenolic
antioxidants from the fruits of three pouteria species by selected ion
monitoring liquid chromatography-mass spectrometry. J Agri Food
Chem 52:5873–5878
Mahattanatawee K, Manthey JA, Luzio G, Talcott ST, Goodner K,
Baldwin EA (2006) Total antioxidant activity and fiber content of
select Florida-grown tropical fruits. J Agri Food Chem 54:7355–
7363
Manjunatha SS, Raju PS (2013) Modelling the rheological behaviour of
tender coconut (Cocos nucifera L.) water and its concentrate. Int
Food Res J 20(2):731–743
Manjunatha SS, Raju PS, Bawa AS (2012a) Modelling the rheological
behaviour of enzyme clarified lime (Citrus aurantifolia L) juice
concentrate. Czech J Food Sci 5:456–466
Manjunatha SS, Raju PS, Bawa AS (2012b) Rheological behaviour of
enzyme clarified Indian gooseberry juice. Int Agrophy 26:145–151
Maskan M (1999) Rheological behaviour of liquorice (Glycyrrhiza
glabra) extract. J Food Eng 39:389–393
1909
Matta VM, Moretti RH, Carbal LMC (2004) Microfiltration and reverse
osmosis for clarification and concentration of acerola juice. J Food
Eng 61:477–482
Mazurkiewicz J, Tomasik P, Zaplotny J (2001) Relationship between
water activity and viscosity of solutions. Food Hydrocol 15:43–46
Miller GL (1959) Use of dintrosalicylic acid reagent for determination of
reducing sugar. Anal Chem 31:426–428
Nindo CI, Tang J, Powers JR, Singh P (2005) Viscosity of blueberry and
raspberry juices for processing applications. J Food Eng 69:343–350
Nindo CI, Tang J, Powers JR, Takhar PS (2007) Rheological properties of
blueberry puree for processing applications. LWT-Food Sci Technol
40:292–299
Pawar CD, Patil AA, Joshi GD (2011) Physico-chemical parameters of
sapota fruits at different maturity stages. Karnataka J Agri Sci 24(3):
420–421
Rai P, Majumdar GC, Dasgupta S, De S (2004) Optimizing pectinase
usage in pretreatment of mosambi juice for clarification by response
surface methodology. J Food Eng 64:397–403
Ranganna S (1986) Hand book of analysis and quality control fruits and
vegetable products, 2nd edn. Tata McGraw-Hill Publication company Limited, New Delhi
Rao MA (2007) Rheology of fluid and semisolid foods, Principles and
Applications, 2nd edn. Springer Science, USA
Rodriguez AT, Moreno YS, Guadarrama VS, Tejacal IA (2011)
Soluble phenols and antioxidant activity in mamey sapote
(Pouteria sapota) fruits in postharvest. Food Res Int 44:
1956–1961
Salunkhe DK, Desai BB (1984) Sapota. Postharvest biotechnology of
fruits, Vol. II. CRC Press, Boca Raton, p 59
Sanchez C, Blanco D, Oria R, Sanchez-Gimeno AC (2009) White guava
fruit and puree: Textural and rheological properties and effect of
temperature. J Texture Stud 40:334–345
Shamsudin R, Wan Daud WR, Takrif MS, Hassan O, Mustapha Kamal
Abdullah AGL (2007) Influence of temperature and soluble solid
contents on rheological properties of the josapine variety of pineapple fruit (Ananas comsus L). Int J Eng Technol 4(2):213–220
Sharoba AM, Ramadan MF (2011) Rheological behaviour and physicochemical characteristics of Goldenberry (Physalis peruviana) juice
as affected by enzymatic treatment. J Food Proces Preserv 35:201–
219
Sin HN, Yusof S, Hamid NSA, Abd. Rahman R (2006) Optimization of
enzymatic clarification of sapodilla juice using response surface
methodology. J Food Eng 73:313–319
Singh S, Gupta R (2004) Apple juice clarification using fungal
pectinolytic enzyme and gelatin. Ind J Biotechnol 3:573–
576
Singleton VL, Orthofer R, Lamucla-Raventos RM (1999) Analysis
of total phenolics and other oxidative substrates and antioxidant by means of folin-ciocalteau reagent. Methods Enzymol
299:152–176
Sogi DS, Oberoi DPS, Malik S (2010) Effect of particle size, temperature
and total soluble solid on rheological properties of watermelon juice:
A response surface approach. Int J Food Prop 13:1207–1214
Steffe JF (1992) Rheological methods in food process engineering.
Freeman Press, East Lansing
Tavares DT, Alcantara MR, Tadini CC, Telis-Romero J (2007)
Rheological properties of frozen concentrated orange juice (FCOJ)
as a function of concentration and subzero temperatures. Int J Food
Prop 10:829–839
Telis VRN, Telis-Romero J, Mazzotti HB, Gabas AL (2007) Viscosity of
aqueous carbohydrate solutions at different temperature and
concentrations. Int J Food Prop 10:185–195
Telis-Romero J, Telis VRN, Yamashita F (1999) Friction factors and
rheological properties of orange juice. J Food Eng 40:101–106
Vaillant F, Millan A, Dornier M, Decloux M, Reynes M (2001)
Strategy for economical optimization of the clarification of
�1910
pulpy fruit juices using cross flow microfiltration. J Food
Eng 48:83–90
Vandana T, Das Gupta DK (2006) Optimization of enzyme concentration,
reaction time and temperature for carrot juice extraction. J Food Sci
Technol 43(5):470–473
Vandresen S, Quadri MGN, Souza JAR, Hotza D (2009) Temperature
effect on the rheological behaviour of carrot juices. J Food Eng 92:
269–274
J Food Sci Technol (April 2015) 52(4):1896–1910
Yahia EM, Gutierrez-Orozco F, Leon CA (2011) Phytochemical and
antioxidant characterization of mamey (Pouteria sapota Jacq H.E.
Moore and Stean) fruit. Food Res Int 44:2175–2181
Yusof S, Ibrahim N (1994) Quality of soursop juice after pectinase
enzyme treatment. Food Chem 51:83–88
Zhishen J, Mengcheng T, Jianming W (1999) Determination of
Flavonoid contents in mulberry and scavenging effects on super
oxide radicals. Food Chem 64:555–559
�
 Soumya Purohit