PA23B-2226
Mapping Extreme Heat Vulnerability and Health Outcomes to inform the District of
Columbia's Climate Adaptation Plan: Progress Report
Juan
1
Declet-Barreto ,
Olga
2
Wilhelmi ,
and Alexis
3
Goggans
1: Union of Concerned Scientists, Washington, DC, USA; 2: NCAR, Boulder, CO, USA; 3: Government of the District of Columbia, Washington, DC, USA
[ CLIMATE CHANGE AND EXTREME HEAT
[ SENSITIVITY: WHO IS SUSCEPTIBLE TO HEAT?
Extreme heat presents serious public health and urban planning challenges to cities as
they struggle to adapt to changing climate conditions. Human mortality and morbidity
increases are triggered by summertime extreme heat events. Indeed, among weatherrelated hazards, extreme heat is the number one killer of people in the United States. In
cities, extreme heat and heat waves are magnified by the Urban Heat Island effect, a
phenomenon caused by urbanization and changes in land surface characteristics.
Combined impacts of UHI and projected climate change may further increase risk of
heat-related mortality in the U.S. cities.
This dimension represents the
socio-economic characteristics
of the population that can
magnify vulnerability to extreme
heat, and includes individual
risk factors known to be
associated with increased heat
morbidity or mortality:
Photo credit: fedmanager.com
• Percent Not White
• Percent No High School
Diploma
• Percent Living in Poverty
• Percent Elderly
• Percent Receiving Food
Stamps
• Percent with Disability
• Percent with no AC
[ EXPOSURE: WHERE ARE THE HEAT-PRONE AREAS?
This dimension captures the
elements of the built
environment correlated with
higher temperatures, as well as
20-year average temperatures:
• Percent Impervious Surface
(Mean)
• Percent Impervious Surface
(SD)
• Percent No Tree Canopy
• Mean Daily Maximum Air
Temperature (May-September
1995-2015)
[ CLIMATE ADAPTATION PLANNING IN DC
The District of Columbia’s “Climate Ready DC” Plan revealed the District will
experience climate change impacts, including:
• More frequent and intense heavy rain events
• Higher tides as a result of rising sea level
• Much higher average temperatures
• Two to three times as many dangerously hot days
• Longer, hotter, and more frequent heat waves
However, numerous questions remain about the locations
and characteristics of people and places vulnerable to
extreme heat. The District government partnered with
social and climate scientists to map socio-spatial
distribution of heat-vulnerable populations and elements
of the built environment in the District of Columbia.
AGU’s Thriving Earth Exchange facilitated this
partnership.
[ RESEARCH QUESTIONS
RQ1. What areas of the city contain the most heat-sensitive populations according
to individual heat-health risk factors?
RQ2. What are the areas of the city with the highest outdoor heat exposure potential
due to impervious surfaces and little tree canopy cover?
RQ3. What are the areas of the city most vulnerable to adverse heat-health
outcomes based on sensitivity of the population and exposure in the built
environment?
[ METHODS
We developed a heat vulnerability index (HVI) for Census Block Groups in the District
of Columbia. Our HVI combines the sensitivity and exposure dimensions into an
indicator of cumulative extreme heat vulnerability. We assembled social, economic,
demographic, and built environment variables known in the heat health literature to be
predictors of extreme heat morbidity and mortality (Harlan et al. 2013). Based on an
earlier, unpublished version of the index (Larsen et al. 2014), we built individual
indices to represent sensitivity and exposure. The exposure index provides information
useful for policymakers tasked with modifications of the built environment, while the
sensitivity indicator points out areas of population concern for public health
practitioners. The HVI combines the sensitivity and exposure indices into a cumulative
indicator.
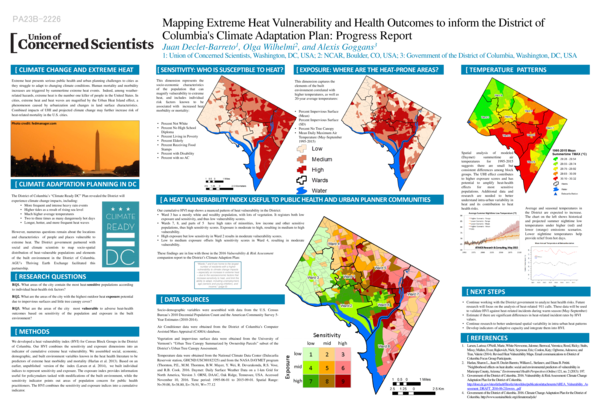
[ TEMPERATURE PATTERNS
[ A HEAT VULNERABILITY INDEX USEFUL TO PUBLIC HEALTH AND URBAN PLANNER COMMUNITIES
Our cumulative HVI map shows a nuanced pattern of heat vulnerability in the District:
• Ward 3 has a mostly white and wealthy population, with lots of vegetation. It registers both low
exposure and sensitivity, and thus low vulnerability scores.
• Wards 7, 8, and parts of 5 have high rates of minorities, low income and other sensitive
populations, thus high sensitivity scores. Exposure is moderate to high, resulting in medium to high
vulnerability.
• High exposure but low sensitivity in Ward 2 results in moderate vulnerability scores.
• Low to medium exposure offsets high sensitivity scores in Ward 4, resulting in moderate
vulnerability.
Spatial analysis of modeled
(Daymet)
summertime
air
temperatures
for
1995-2015
suggests there are small but
consistent differences among block
groups. The UHI effect contributes
to higher exposure scores and has
potential to amplify heat-health
effects
for
most
sensitive
populations. Additional data and
research are needed to better
understand intra-urban variability in
heat and its contribution to heat
health risks.
Average and seasonal temperatures in
the District are expected to increase.
The chart on the left shows historical
and projected summer nighttime low
temperatures under higher (red) and
lower (orange) emissions scenarios.
Lower nighttime temperatures help
provide relief from hot days.
ATMOS Research & Consulting, May 2015
These findings are in line with those in the 2016 Vulnerability & Risk Assessment
companion report to the District’s Climate Adaption Plan:
“Wards 7 and 8 are home to the largest
number of residents with a higher
vulnerability to climate change impacts
– especially an increase in extreme heat
– due to the socioeconomic factors that
increase sensitivity to heat, and limit the
ability to adapt, including unemployment,
age (seniors and young children), and
income.” (page 8)
[ NEXT STEPS
[ DATA SOURCES
Socio-demographic variables were assembled with data from the U.S. Census
Bureau’s 2010 Decennial Population Count and the American Community Survey 5Year Estimates (2010-2014).
Air Conditioner data were obtained from the District of Columbia’s Computer
Assisted Mass Appraisal (CAMA) database.
Vegetation and impervious surface data were obtained from the University of
Vermont’s “Urban Tree Canopy Summarized by Ownership Parcels” subset of the
District’s Urban Tree Canopy Assessment.
Temperature data were obtained from the National Climate Data Center (Dalecarlia
Reservoir station, GHCND:USC00182325) and from the NASA DAYMET program
(Thornton, P.E., M.M. Thornton, B.W. Mayer, Y. Wei, R. Devarakonda, R.S. Vose,
and R.B. Cook. 2016. Daymet: Daily Surface Weather Data on a 1-km Grid for
North America, Version 3. ORNL DAAC, Oak Ridge, Tennessee, USA. Accessed
November 10, 2016. Time period: 1995-06-01 to 2015-09-01. Spatial Range:
N=39.00, S=38.80, E=-76.91, W=-77.12
• Continue working with the District government to analyze heat health risks. Future
research will focus on the analysis of heat-related 911 calls. These data will be used
to validate HVI against heat-related incidents during warm season (May-September)
• Estimate if there are significant differences in heat-related incident rates by HVI
values.
• Continue research to better understand spatial variability in intra-urban heat patterns
• Develop indicators of adaptive capacity and integrate them into HVI.
[ REFERENCES
1. Larsen, Larissa; O'Neill, Marie, White-Newsome, Jalonne; Berrocal, Veronica; Rood, Ricky; Stults,
Missy; Mallen, Evan; Rajkovich, Nick; Seymour, Eric; Conlon, Katy; Ogbomo, Adesuwa; and
Tran, Valerie (2014). Revised Heat Vulnerability Maps. Email communications to District of
Columbia Focus Group Participants.
2. Harlan, Sharon L., Juan H. Declet-Barreto, William L. Stefanov, and Diana B. Petitti.
"Neighborhood effects on heat deaths: social and environmental predictors of vulnerability in
Maricopa County, Arizona." Environmental Health Perspectives (Online) 121, no. 2 (2013): 197.
3. Government of the District of Columbia. 2016. Vulnerability & Risk Assessment: Climate Change
Adaptation Plan for the District of Columbia.
http://doee.dc.gov/sites/default/files/dc/sites/ddoe/publication/attachments/AREA_Vulnerability_As
sessment_DRAFT_2016-06-21lowres_.pdf
4. Government of the District of Columbia. 2016. Climate Change Adaptation Plan for the District of
Columbia. http://www.sustainabledc.org/climatereadydc/
�
 Alexis Goggans
 Juan Declet-Barreto