Synthesis and Characterization of a Cubic Iron Hydroxy Boracite
Stephanie C. Neumaira , Johanna S. Knyrimb, Oliver Oecklerc , Reinhard Kaindld ,
and Hubert Huppertza
a
Institut für Allgemeine, Anorganische und Theoretische Chemie, Leopold-Franzens-Universität
Innsbruck, Innrain 52a, 6020 Innsbruck, Austria
b Süd-Chemie AG, BU Performance Packaging, Ostenriederstraße 15, 85368 Moosburg, Germany
c Department Chemie, Ludwig-Maximilians-Universität München, Butenandtstraße 5 – 13,
81377 München, Germany
d Institut für Mineralogie und Petrographie, Leopold-Franzens-Universität Innsbruck, Innrain 52f,
6020 Innsbruck, Austria
Reprint requests to H. Huppertz. E-mail: Hubert.Huppertz@uibk.ac.at
Z. Naturforsch. 2011, 66b, 107 – 114; received November 16, 2010
The cubic iron hydroxy boracite Fe3 B7 O13 OH ·1.5 H2 O was synthesized from Fe2 O3 and B2 O3
under high-pressure/high-temperature conditions of 3 GPa and 960 ◦C in a modified Walker-type
multianvil apparatus. The crystal structure was determined at room temperature by X-ray diffraction on single crystals. It crystallizes in the cubic space group F 4̄3c (Z = 8) with the parameters
a = 1222.4(2) pm, V = 1.826(4) nm3 , R1 = 0.0362, and wR2 = 0.0726 (all data). The B-O network is
similar to that of other cubic boracites.
Key words: Borate, Crystal Structure, Hydroxy Boracite, High Pressure
Introduction
Boracites have been extensively studied during the
last two centuries [1]. The name boracite, which is
actually used for more than 25 compounds, was attributed to the mineral Mg3 B7 O13 Cl [2]. The general
formula can be written as M3 B7 O13 X with M = Mg,
Cr, Fe, Co, Ni, Cu, Zn, Cd, or monovalent Li and X =
Cl, Br, I [2], or occasionally OH, S, Se, Te, and F. As
it is the rule, the specific boracites will be described
here by their M and X ions, e. g. Mg-Cl stands for the
boracite Mg3 B7 O13 Cl.
Besides varying chemical compositions, there are
different structural modifications of boracite: the cubic high-temperature modification and several lowtemperature modifications, which show either orthorhombic (low- or β -Mg-Cl, Pca21 [3]), trigonal
(Fe-Cl, R3c [3, 4]), tetragonal (Cr-Cl [5], P4̄21 c), or
monoclinic symmetry (Fe-I below 30 K [6]). Due to
their unique structure, some boracites have interesting
physical properties like pyroelectricity (orthorhombic
Mg-Cl [7,8]), piezoelectricity (cubic Mg-Cl [7,8]), ferroelectricity, ferroelasticity, and ferromagnetism (Fe-I
below 30 K [6]). This led to several applications,
e. g. as optic stopper [2, 9], ferroelectric non-volatile
memory (ferroelectric random access memory or
FRAM) [2, 10], and infrared (IR) detector [2, 11, 12].
Up to now, only a few hydroxy boracites are
known, e. g. Ni3 B7 O13 [I1−x (OH)x ] [13], Mn-OH [14],
Mg-OH [14], Fe-OH [13, 15], Cd-OH [16], and
CaMg[B3 O4 (OH)3 ]2 · H2 O [17]. However, structural
investigations were only carried out into the latter
two, and the refinement of hydrogen atoms was successful only for CaMg[B3 O4 (OH)3 ]2 · H2 O. Concerning Fe-OH, Kravchuk et al. [15] published X-ray powder data of crystals with colors from pale-grey to yellow, which do not correspond to our findings. Joubert
et al. [13] only mentioned the successful synthesis of
Fe-OH.
In the course of our research, we synthesized and examined a new blue Fe-OH boracite. In this paper, the
synthesis, crystal structure, and properties of this compound are discussed and compared to those of other
boracites.
Experimental Section
Synthesis
The iron borate Fe-OH was synthesized under highpressure/high-temperature conditions of 3 GPa and 960 ◦C
in a modified Walker-type multianvil apparatus. A mixture
of Fe2 O3 (Merck, Germany, 99 %) and partially hydrolyzed
B2 O3 (Strem Chemicals, Newburyport, USA, 99.9 %) in a
molar ratio of 3 : 11 was ground together and filled into
c 2011 Verlag der Zeitschrift für Naturforschung, Tübingen · http://znaturforsch.com
0932–0776 / 11 / 0200–0107 $ 06.00 �
�108
R
a boron nitride crucible (Henze BNP GmbH, HeBoSint�
S100, Kempten, Germany). The crucible was positioned in
the center of an 18/11-assembly and compressed by eight
tungsten carbide cubes (TSM-10, Ceratizit, Reutte, Austria).
The pressure was applied via a Walker-type multianvil device
and a 1000 t press (both devices from the company Voggenreiter, Mainleus, Germany). A detailed description of the assembly and its preparation can be found in refs. [18–22].
To synthesize Fe-OH, the sample was compressed to 3 GPa
within 65 min and kept at this pressure during the heating period. The temperature was increased in 5 min to 960 ◦C, kept
there for 5 min, and lowered to 640 ◦C in 15 min. The sample
was cooled to room temperature by switching off the heating,
followed by a decompression period of 205 min. The recovered pressure medium was broken apart and the surrounding
boron nitride crucible removed from the sample. The compound Fe-OH was obtained in the form of blue cubes, surrounded by amorphous B2 O3 . The excess of B2 O3 served
as a flux, leading to an increased crystal size of the Fe-OH
boracite. To purify the air- and water-resistant Fe-OH, the
sample was washed in hot water, which dissolved the boron
oxide.
During the reaction of Fe2 O3 and B2 O3 , the iron cations
were reduced to the oxidation state 2+. A reduction of the
metal ions to lower oxidation states or to the corresponding
metal is often observed in the multianvil high-pressure assembly when hexagonal boron nitride and graphite are used
as crucible and furnace materials, respectively [23], especially at elevated temperatures. A precise explanation of the
redox mechanism with hexagonal boron nitride and graphite
as reducing agents is still to be found.
The elemental analysis of Fe-OH through energy dispersive X-ray spectroscopy (Jeol JFM-6500F, Jeol. Ltd, Tokyo,
Japan) led to values of 9.3 % Fe (12 %), 32 % B (28 %) and
58 % O (60 %) (theoretical values in parentheses).
Crystal structure analysis
For the single-crystal structure analysis, small irregularly shaped crystals of Fe-OH were isolated by mechanical
fragmentation (unwashed). The measurements of the singlecrystal intensity data were performed at r. t. on a Stoe IPDS-I
diffractometer with graphite-monochromatized MoKα (λ =
71.073 pm) radiation.
The determination of the metrics yielded a cubic Fcentered unit cell. The Laue symmetry m3̄m and systematically absent reflections hhl with h, l = 2n indicated the possible space groups F 4̄3c and Fm3̄c. As no solution could
be obtained by Direct Methods, the structure was solved by
trial and error. Taking into account the multiplicity of the
Wyckoff positions in an F-centered unit cell with the Laue
symmetry m3̄m, it is clear that the maximum multiplicity of
an iron site is limited to 24, because otherwise an unreasonably high density of > 4 g cm−3 would result. The re-
S. C. Neumair et al. · A Cubic Iron Hydroxy Boracite
Table 1. Crystal data and numbers pertinent to data collection
and structure refinement of Fe3 B7 O13 OH ·1.5 H2 O (standard
deviations in parentheses where applicable).
Empirical formula
Molar mass, g mol−1
Crystal system
Space group
Crystal size, mm3
Temperature, K
Single crystal diffractometer
Radiation
Single-crystal data
a, pm
V , nm3
Formula units per cell Z
Calculated density, g cm−3
Absorption coefficient, mm−1
F(000), e
θ range, deg
Range in hkl
Total no. of reflections
Independent reflections / Rint / Rσ
Reflections with I ≥ 2σ (I)
Data / ref. parameters
Absorption correction
Transm. ratio (min / max)
Goodness-of-fit on F 2
Final R1 / wR2 [I ≥ 2σ (I)]
R1 / wR2 (all data)
Flack parameter x
Largest diff. peak / hole, e Å−3
Fe3 B7 O13 OH ·1.5 H2 O
495.25
cubic
F 4̄3c
0.07 × 0.10 × 0.12
293(2)
Stoe IPDS-I
MoKα (λ = 71.073 pm)
1222.4(2)
1.8266(4)
8
3.60
4.8
1928
3.3 – 30.2
−7 ≤ h ≤ 17, −17 ≤ k ≤ 10,
−17 ≤ l ≤ 17
1930
238 / 0.0352 / 0.0195
211
238 / 25
numerical [24, 25]
0.667 / 0.703
1.088
0.0312 / 0.0714
0.0362 / 0.0726
−0.02(7)
0.7 / −0.4
finement of an Fe position on the 24c site (0 1/4 1/4) in the
space group F 4̄3c yielded an R1 value of ≈ 0.25. From this
starting point, the light atoms could be located from subsequent Fourier and difference Fourier syntheses. However,
the displacement parameter of Fe indicated a strong deviation from the 24c site. Assuming a half occupied split position 48g (x 1/4 1/4) with x ≈ 0.03, the R values dropped significantly. No additional symmetry could be found, so the
structure is non-centrosymmetric in accordance with all other
cubic boracites; the Flack parameter converged to a value
of −0.02(7).
A numerical absorption correction was applied to the intensity data [24, 25]. The iron, boron, and oxygen atoms
were refined with anisotropic displacement parameters [26].
Final difference Fourier syntheses did not reveal any significant peaks in the refinements. Details of the data collection and structure refinement are listed in Table 1. The
positional parameters, anisotropic displacement parameters,
interatomic distances, and interatomic angles are given in
Tables 2 – 5.
Further details of the crystal structure investigation may
be obtained from the Fachinformationszentrum Karlsruhe,
76344 Eggenstein-Leopoldshafen, Germany (fax: +497247-808-666; e-mail: crysdata@fiz-karlsruhe.de, http://
�S. C. Neumair et al. · A Cubic Iron Hydroxy Boracite
Atom
Fe
B1
B2
O1
O2
O3
O4
Atom
Fe
B1
B2
O1
O2
O3
O4
W. position
48g
32e
24d
96h
8a
8b
32e
U11
0.0343(6)
0.025(2)
0.007(2)
0.0162(9)
0.026(2)
0.054(4)
0.099(5)
x
0.03073(8)
0.0797(3)
1/4
0.0231(2)
0
1/4
0.3103(7)
U22
0.0188(6)
U11
0.012(2)
0.0162(8)
U11
U11
U11
y
1/4
x
0
0.0965(2)
0
1/4
x
U33
0.0211(6)
U11
U22
0.0111(7)
U11
U11
U11
109
z
1/4
x
0
0.1821(2)
0
1/4
x
U23
−0.0034(6)
0.012(2)
0
0.0044(7)
0
0
−0.019(5)
U13
0
U23
0
0.0047(6)
0
0
U23
Table 4. Interatomic distances (pm) in Fe-OH (space group:
F 4̄3c) calculated with the single-crystal lattice parameters
(standard deviations in parentheses).
sof
0.5
1
1
1
1
0.5
0.5
Table 2. Atomic coordinates and equivalent isotropic displacement parameters Ueq (Å2 ) of Fe-OH (space group:
F 4̄3c) with standard deviations in
parentheses. Ueq is defined as one third
of the trace of the orthogonalized Uij
tensor.
U12
0
U23
0
0.0062(7)
0
0
U23
Table 3. Anisotropic displacement parameters of Fe-OH (space group: F 4̄3c)
with standard deviations in parentheses.
Ueq
0.0248(3)
0.025(2)
0.0105(7)
0.0145(4)
0.026(2)
0.054(4)
0.099(5)
www.fiz-informationsdienste.de/en/DB/icsd/depot anforderung.html) on quoting the deposition number CSD-422340.
stage mounted to the Raman spectrometer. The crystals were
placed in a quartz crucible and heated at a rate of 50 ◦C per
minute up to 500 ◦C.
The FTIR-ATR (Attenuated Total Reflection) spectra of
single crystals were recorded with a Bruker Vertex 70 FTIR spectrometer (spectral resolution 4 cm−1 ) attached to
a Hyperion 3000 microscope in the spectral range 600 –
4000 cm−1 . A frustrum-shaped germanium ATR-crystal with
a tip diameter of 100 µ m was pressed on the surface of the
borate crystal with a power of 5 N, which crushed it into
pieces of µ m-size. 64 scans of the sample and of the background were acquired. Beside the spectra correction for atmospheric influences, an enhanced ATR-correction [27], using the O PUS 6.5 software, was performed. A mean refraction index of the sample of 1.6 was assumed for the ATRcorrection. Background correction and peak fitting were applied using polynomial and convoluted Gaussian-Lorentzian
functions.
Vibrational spectra
Results and Discussion
The confocal Raman spectra of single crystals were obtained with a Horiba Jobin Yvon LabRam-HR 800 Raman
micro-spectrometer. The samples were excited using the 488
nm emission line of a 14 mW Ar+ laser and the 532 nm line
of a 100 mW Nd-YAG laser. The size and power of the laser
spot on the surface were approximately 1 µ m and 2 – 5 mW,
respectively. The spectral resolution, determined by measuring the Rayleigh line, was about 2 cm−1 . The dispersed light
was collected by a 1024 × 256 open electrode CCD detector. The spectra were recorded unpolarized. Background and
Raman bands were fitted by the built-in spectrometer software LabSpec to second order polynomial and convoluted
Gaussian-Lorentzian functions, respectively. The accuracy of
the Raman line shifts, calibrated by regularly measuring the
Rayleigh line, was in the order of 0.5 cm−1 . Heating experiments were performed with a Linkam THMS 600 heating
Crystal structure of Fe3 B7 O13 OH · 1.5 H2 O
Fe–O1a
Fe–O1b
Fe–O4
Fe–O3
205.5(2)
215.5(2)
+
220.5(2)
or
268.0(2)
2×
2×
2×
B1–O1
B1–O2
av.
B2–O1
144.5(2)
168.7(6)
150.6
1.469(2)
3×
1×
4×
1×
Table 5. Interatomic angles (deg) in Fe-OH (space group:
F 4̄3c) calculated with the single-crystal lattice parameters
(standard deviations in parentheses).
O1–B2–O1
O1–B2–O1
av.
108.6(1)
111.2(2)
109.9
3×
3×
O1–B1–O1
O1–B1–O2
av.
111.1(2)
107.8(3)
109.5
3×
3×
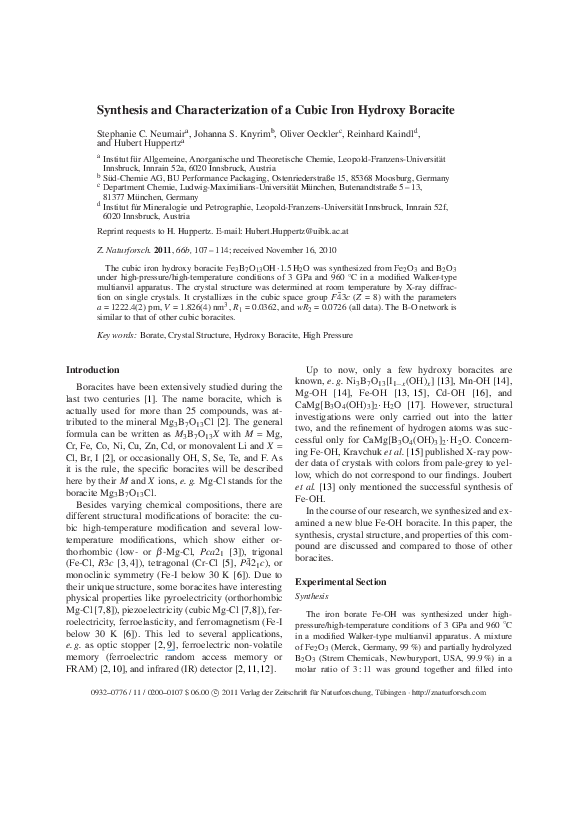
The boracite structure of Fe-OH (Fe3 B7 O13 OH ·
1.5 H2 O) is built up from star-like units of four
distorted BO4 tetrahedra sharing one common corner (oxygen). These star-shaped units are connected
via additional, undistorted BO4 tetrahedra to form a
network structure. Fig. 1 shows the cubic unit cell
of Fe-OH with the star-shaped unit (light polyhedra, yellow) and the connecting BO4 tetrahedra (dark
polyhedra, blue). The structure exhibits channels of
achter rings (rings consisting of eight tetrahedral centers) [28], running along all three spatial directions, so
that an open network is generated. Inside these channels, iron and oxygen ions are accomodated. Some of
�110
Fig. 1 (color online). Projection of the crystal structure of
Fe3 B7 O13 OH ·1.5 H2 O. BO4 tetrahedra: light (yellow) tetrahedra: star-like units; dark (blue) tetrahedra: connecting BO4
tetrahedra; large (yellow) spheres: Fe2+ ; corners of polyhedra and small dark spheres (blue spheres): O2− ; center of
polyhedra (red spheres): B3+ .
the positions inside the channels show a specific disorder, e. g. a displacement of the metal ions along the
4̄ axis of site 24c in Cd-S [29], or a four-fold disorder around the site 8b in Cd-S [29] and Li-Cl [30]. The
same applies to our compound, where the iron and oxygen ions are disordered. For many cubic boracites it is
argued that the disorder of the metal and halogen ions
found in the structures is in doubt.
Nelmes and Hay [31] have shown that the metal
cations in the cubic halogen boracites Cr-Cl [32],
Ni-I [33], Cu-Cl, Co-I, and Cu-Br are not necessarily disordered. Several years later, R. O. Gould, R. J.
Nelmes, and S. E. B. Gould [29] reported new results
about the above mentioned cubic cadmium sulfur boracite Cd-S, where the Cd ions are clearly disordered
over two sites more than 100 pm apart. The authors
concluded that the occurrence of disorder in the cubic
boracites seems to depend on the constituting elements
and their interactions. So, obviously, the authors’ most
probable explanation seems to be the higher affinity of
the Cd2+ ions for sulfur in contrast to the lower affinity of the above mentioned metal cations to the halide
anions (Cr-Cl, Ni-I, Cu-Cl, Co-I, Cu-Br). A simple geometrical reason for the displacement to the off-center
sites could not be given.
The iron boracite presented here exhibits a very
pronounced disorder. Fig. 2 shows the two split positions of Fe2+ (view along [110]) shaded (colored) dark
S. C. Neumair et al. · A Cubic Iron Hydroxy Boracite
Fig. 2 (color online). Split position of Fe2+ in Fe3 B7 O13 OH ·
1.5 H2 O; view along [110].
(violet) and light (orange). The oxygen anions inside
the channels (O3) were positioned and refined on the
site 8b. Further difference Fourier syntheses resulted
in four peaks of electron density (site 32e) tetrahedrally arranged around the oxygen position O3. These
peaks were already reported by Ito et al. for cubic
Mg-Cl [8]. In order to explain these electron density
peaks in Fe-OH, we assume a disorder of oxygen over
the central site (O3, 8b) and the site 32e (O4). Fig. 3
shows the tetrahedral array of the partially occupied
oxygen positions O3 and O4. The refinements with a
variable occupation of the two different sites led to site
occupation factors (sof ) of 54 % for the “inner” position (O3, site 8b) and 44 % for the “outer” position
(O4, 32e) (R1 = 0.0356 and wR2 = 0.0706 (all data)).
Obviously, the distance between the two sites is too
short (128(2) pm) for a simultaneous occupation with
oxygen atoms, which corresponds to the refined sof.
Thus, either site 8b or site 32e is occupied. Due to
the fact that the sof were close to a 50 % occupation
of the two sites, the occupancies were constrained to
50 % in the final refinements. This led to the formula
Fe3 B7 O15.5 .
The IR and Raman spectra revealed intense O-H
modes. As all known boracites show metal atoms in
the oxidation state +2 and +1 (Li boracite), we also
assume the oxidation state +2 for the iron boracite described here. Thus, for charge balance reasons, four
H ions are required per formula unit. As O3 and O4
are not part of the B-O network, it is likely that these
two oxygen ions bind to the hydrogen ions, forming
�S. C. Neumair et al. · A Cubic Iron Hydroxy Boracite
111
Fig. 3 (color online). Detail of the crystal structure of Fe3 B7 O13 OH ·1.5 H2 O: partial occupation of O3 and O4; left: the O3 site (small dark
sphere, dark blue) is occupied, while the O4 site
(small light spheres, light blue) remains unoccupied; right: the O3 site (small light sphere, light
blue) is unoccupied, while all O4 sites (small
dark spheres, dark blue) are occupied.
OH− or water molecules. In cubic boracites, site 8b
(O3) typically represents the anion site (position of Cl
in Mg-Cl). Thus, hydroxyl groups seem plausible at
this site. A possible structural model would suggest an
equilibrium of the negative charges on the two sites
(O3, 8b; O4, 32e). Therefore, we propose a model in
which the oxygen atoms O3 (site 8b) bind to hydrogen atoms, forming hydroxyl groups. Concerning the
32e site (O4), one negative charge has to be shared
by four occupied oxygen positions, which can be
achieved by a model of one OH− group and three H2 O
molecules for the site 32e (O4). Due to the half occupied sites 8b (0.5 OH− ) and 32e (0.5 OH− + 1.5 H2 O),
this sums up to the formula “Fe3 B7 O13 OH ·1.5 H2 O”.
As it was not possible to locate the position of
the hydrogen atoms by X-ray crystal structure analysis, this model relies on vibrational spectroscopic
measurements and the above reasoning. The shortest O4· · · O1 distances have values of 281.14(2) (3×)
and 284.02(3) pm (3×), which is in good agreement
with the O· · · O distances in solid water (275 pm [34]).
Thus, hydrogen ions can be expected to lie between O4
and O1, forming hydrogen bridges. The interatomic
distance between the O4 sites is 208.65(2) pm, which is
rather short for HO-H· · · OH− distances (229 pm [34]).
As stated above, crystals of Fe-OH had to be washed
in water to gain larger quantities of the pure phase. The
open network structure possibly has a variable content
of water, influenced by the washing with water. Thus,
measurements of the H2 O content in Fe-OH by means
of DTA would not be informative.
As pointed out above, Fe-OH exhibits a pronounced
split position of the Fe2+ ions. Fig. 4 depicts the coordination sphere of the iron ions in Fe-OH; Table 4 lists
the Fe-O distances. Due to the displacement to the offcentered sites, the iron ions show a distorted sixfold coordination or a distorted 4+1 coordination determined
Fig. 4 (color online). Coordination spheres of the Fe2+ ions
(partial occupation of O3 and O4; see Fig. 3).
by the occupation of the sites O4 (32e) or O3 (8b), respectively. The enlarged coordination sphere as compared to the usually fourfold coordinated metal sites
in cubic boracites (C.N. = 4, distorted tetrahedron),
appears to be favored under high-pressure conditions,
which thus may also be a reason for the splitting. As
stated in ref. [31] for Cd-S, the most probable explanation for the pronounced positional spliting is the higher
affinity of Fe2+ to oxygen in contrast to the lower affinity of other metal cations to the corresponding halide
anions.
The blue color of the Fe-OH crystals implies
that there is a certain amount of Fe3+ ions incorporated in the structure. The mineral vivianite
(Fe2+ 3 (PO4 )2 ·8 H2 O) has an indigo-blue color, which
results from an Fe2+ → Fe3+ intervalence charge
transfer (IVCT). The chemical formula of this compound does not indicate a mixed-valence, but freshly
prepared pale-green crystals of vivianite rapidly turn
blue, when exposed to air, which is due to the partial oxidation of Fe2+ [35]. As there was no color
change when Fe-OH was exposed to air, the small
amount of Fe3+ ions might come from the starting
material. It is reasonable to suppose that charge imbalances caused by Fe3+ can be compensated by the
�112
generation of OH− from water molecules in the crystal
structure.
In 1981, Gould et al. [29] published a cubic cadmium sulfur boracite with similar features. The Cd
ions are disordered over two sites. The site 8b, where
the S ions are situated, is tetrahedrally surrounded by
four peaks of electron density. In this case, the electron density distribution was interpreted as a disordered “S2 2− ” ion with one S at the central site 8b and
the other one distributed uniformly over the four surrounding sites (32e). In order to compare the model of
Gould et al. with our data set, we refined our single
crystal data by constraining the sof to the values found
for Cd-S (O3: 100 %, O4: 25 %). This resulted in increased residual factors (R1 = 0.045 and wR2 = 0.1066
(all data)) compared to our model (R1 = 0.0362 and
wR2 = 0.0726 (all data)). Thus, the model of Gould et
al. does not fit to our data for Fe-OH. In this context,
it is noteworthy that in the cubic Li-X boracites [30],
the X site is also surrounded by four peaks of electron
density. These peaks are occupied with the additional
lithium ion, disordered over the four positions, which
is needed for charge balance.
Since cubic boracites are usually synthesized in
closed silica glass ampoules at elevated temperatures [4,36], the assumption stands to reason, if Fe-OH
is a normal-pressure phase or a metastable highpressure phase.
Vibrational spectroscopy
The IR-absorbance and Raman spectra of single
crystals of Fe-OH are displayed in Figs. 5 and 6, re-
Fig. 5. ATR (attenuated total reflection) spectrum of a Fe-OH
single crystal in the range 4000 – 500 cm−1 .
S. C. Neumair et al. · A Cubic Iron Hydroxy Boracite
Fig. 6 (color online). Confocal Raman spectra of a Fe-OH
single crystal in the range 4000 – 100 cm−1 before (grey /
red) and after heating to 500 ◦C (black).
spectively. The assignment of the vibrational modes is
based on the comparison with the experimental data
of borate crystals and glasses containing BO3 and
BO4 units [37–42]. According to Moopenn and Coleman [43], internal vibrational modes of the borate
framework occur at wavenumbers above 200 cm−1 .
Bands up to 800 cm−1 can be assigned to bending and
stretching vibrations of various borate arrangements,
while bands in the region 800 – 1600 cm−1 are typical
for stretching vibrations of B-O units. Absorptions of
BO4 tetrahedra are expected at wavenumbers of 800 –
1100 cm−1 [44–46], whereas those of BO3 groups
dominate at 1200 – 1450 cm−1 [47–50]. However, due
to the different structure and the interconnecting metal
cations, assignments remain tentative to a certain degree [51].
Several cubic boracites and their phase transitions
were investigated by vibrational spectroscopy in the
last thirty years [52–54]. Interestingly, cubic boracites
show absorption bands in a frequency range of 1200 –
1400 cm−1 , where usually those of BO3 triangles occur. As cubic boracites exhibit only BO4 groups, the
authors in ref. [52] discussed, whether BO3 triangles
do persist in the cubic high-temperature form after
the phase transition. For a better understanding of
the phonon band structure in cubic boracites, Iliev et
al. [54] performed DFT (density functional theory) calculations for Raman modes and showed that for cubic
Co-Cl vibrational bands of distorted OBO3 tetrahedra
can be expected in the range of 1150 – 1300 cm−1 .
Fig. 5 depicts the IR-ATR-spectrum of Fe-OH,
which shows strong absorbance at 800 – 1000, 1200,
�S. C. Neumair et al. · A Cubic Iron Hydroxy Boracite
and 1350 cm−1 . As stated above, the strong modes
can be assigned to vibrations of the B-O network. The
band at 1350 cm−1 is associated with the antisymmetric stretching mode of the distorted BO4 tetrahedra.
Above 1500 cm−1 , several groups of weaker bands are
detected, which confirm the presence of crystal water
in the structure. In the region of 1600 – 1750 cm−1 ,
H-O-H bending of the crystal water occurs [40]. Modes
at 2300 – 2350 and 3600 – 3800 cm−1 can be assigned
to O-H stretching, and bands at 2800 – 3000 cm−1 belong to CH vibrations due to contaminations with silicone oil.
The Raman spectra of Fe-OH (Fig. 6) are characterized by the most intense lines at 700 and 3600 cm−1 .
Additionally, several groups of lines are detected
below 500, around 800, and in the range 1100 –
1400 cm−1 . As this cubic boracite exhibits only regular BO4 and distorted OBO3 tetrahedra, the lines
at 800 cm−1 have to be assigned to the stretching modes of the BO4 tetrahedra, while the stretching modes of distorted OBO3 tetrahedra absorb in
the region of 1100 – 1400 cm−1 . The strong line
at 3600 cm−1 is typical for the OH mode of watercontaining borates, thus confirming the presence of
crystal water in the structure [55]. The weaker lines
around 3250 cm−1 are probably related to CH vibra-
[1] A. G. Werner, Bergmännisches Journal 1789, 393.
[2] J. Campa-Molina, S. Ulloa-Godinez, A. Barrera,
L. Bucio, J. Mata, J. Phys.: Condens. Matter 2006, 18,
4827.
[3] E. Dowty, J. R. Clark, Solid State Commun. 1972, 10,
543.
[4] M.-E. Mendoza-Alvarez, K. Yvon, W. Depmeier,
H. Schmid, Acta Crystallogr. 1985, C41, 1551.
[5] H. K. Mao, F. Kubel, H. Schmid, K. Yvon, Acta Crystallogr. 1991, B47, 692.
[6] F. Kubel, Ferroelectrics 1994, 160, 61.
[7] H. Schmid, J. Phys. Chem. Solids 1965, 26, 973.
[8] T. Ito, N. Morimoto, R. Sadanaga, Acta Crystallogr.
1951, 4, 310.
[9] L. Smart, E. Moore, Solid State Chemistry, An Introduction, Chapman and Hall, London, 1992.
[10] S. Matthews, R. Ramesh, T. Venkatesan, J. Benedetto,
Science 1997, 276, 238.
[11] J. Campa-Molina, A. G. Castellanos-Guzman, M. Barcena-Soto, J. Reyes-Gomez, Solid State Commun.
1994, 89, 963.
[12] J. Campa-Molina, O. Blanco, A. Correa-Gomez,
113
tions of impurities [56] and disappear almost completely after heating (see below). Fig. 6 shows two
Raman spectra: before (grey / red) and after (black)
heating to 500 ◦C. Apparently, the crystal water could
be partly expelled without any obvious structural
changes.
Conclusions
The cubic compound Fe-OH exhibits a B-O network comparable to that of other cubic boracites, with
the iron atoms disordered over two sites, and the OH
position – at the halide position in metal-halogen boracites – tetrahedrally surrounded by partially occupied oxygen atom positions. The model presented here
leads to the formula of Fe3 B7 O13 OH ·1.5 H2 O. IR and
Raman measurements have shown intense O-H modes
that confirm the water content.
Acknowledgements
We gratefully acknowledge the continuous support of
this work by Prof. Dr. W. Schnick, Department Chemie of
the University of Munich (LMU). Special thanks go to Dr.
P. Mayer for collecting the single-crystal data. This work
was financially supported by the Deutsche Forschungsgemeinschaft (HU 966/2-3) and the Fonds der Chemischen
Industrie.
[13]
[14]
[15]
[16]
[17]
[18]
[19]
[20]
[21]
[22]
[23]
[24]
M. Czank, A. G. Castellanos-Guzman, J. Microsc.
2002, 208, 201.
J. C. Joubert, J. Muller, C. Fouassier, A. Levasseur,
Kristall und Technik 1971, 6, 65.
J. C. Joubert, J. Muller, M. Pernet, B. Ferrand, Bull.
Soc. Fr. Minéral. Cristallogr. 1972, 95, 68.
T. A. Kravchuk, Yu. D. Lazebnik, Russ. J. Inorg. Chem.
1967, 12, 21.
U. Werthmann, H. Gies, J. Glinnemann, Th. Hahn,
Z. Kristallogr. 2000, 215, 393.
C. Sabelli, A. Stoppioni, Can. Mineral. 1978, 16, 75.
N. Kawai, S. Endo, Rev. Sci. Instrum. 1970, 8,
1178.
D. Walker, M. A. Carpenter, C. M. Hitch, Am. Mineral.
1990, 75, 1020.
D. Walker, Am. Mineral. 1991, 76, 1092.
D. C. Rubie, Phase Transitions 1999, 68, 431.
H. Huppertz, Z. Kristallogr. 2004, 219, 330.
J. S. Knyrim, J. Friedrichs, S. Neumair, F. Roeßner,
Y. Floredo, S. Jakob, D. Johrendt, R. Glaum, H. Huppertz, Solid State Sci. 2008, 10, 168.
X-S HAPE (version 1.05), Crystal Optimisation for Nu-
�114
[25]
[26]
[27]
[28]
[29]
[30]
[31]
[32]
[33]
[34]
[35]
[36]
[37]
[38]
[39]
S. C. Neumair et al. · A Cubic Iron Hydroxy Boracite
merical Absorption Correction, Stoe & Cie GmbH,
Darmstadt (Germany) 1999.
W. Herrendorf, H. Bärnighausen, H ABITUS, Program
for Numerical Absorption Correction, Universities of
Karlsruhe and Giessen, Karlsruhe, Giessen (Germany)
1993/1997.
G. M. Sheldrick, Acta Crystallogr. 2008, A64, 112.
F. M. Mirabella, Jr. in Internal Reflection Spectroscopy,
Theory and Applications (Ed.: F. M. Mirabella, Jr.),
Marcel Dekker, New York, 1993, p. 17.
F. Liebau, Structural Chemistry of Silicates, SpringerVerlag, Berlin, 1985.
R. O. Gould, R. J. Nelmes, S. E. B. Gould, J. Phys. C:
Solid State Phys. 1981, 14, 5259.
W. Jeitschko, T. A. Bither, P. E. Bierstedt, Acta Crystallogr. 1977, B33, 2767.
R. J. Nelmes, W. J. Hay, J. Phys. C: Solid State Phys.
1981, 14, 5247.
R. J. Nelmes, F. R. Thornley J. Phys. C: Solid State
Phys. 1974, 7, 3855.
F. R. Thornley, N. S. J. Kennedy, R. J. Nelmes, J. Phys.
C: Solid State Phys. 1976, 9, 681.
A. F. Holleman, E. Wiberg, N. Wiberg, Lehrbuch der
Anorganischen Chemie, Walter de Gruyter, Berlin,
New York, 2007.
R. G. Burns, Mineralogical Applications of Crystal
Field Theory, 2nd ed., Cambridge University Press,
Cambridge, 1993.
H. Schmid, J. Phys. Chem. Solids 1965, 26, 973.
F. C. Hawthorne, P. C. Burns, J. D. Grice in Boron:
Mineralogy, Petrology and Geochemistry, Vol. 33, 2nd
ed. (Eds.: E. S. Grew, L. M. Anovitz), Mineralogical
Society of America, Washington, 1996, p. 41.
H. Huppertz, J. Solid State Chem. 2004, 177, 3700.
G. Chadeyron, M. El-Ghozzi, R. Mahiou, A. Arbus,
J. C. Cousseins, J. Solid State Chem. 1997, 128, 261.
[40] L. Jun, X. Shuping, G. Shiyang, Spectrochim. Acta A
1995, 51, 519.
[41] G. Padmaja, P. Kistaiah, J. Phys. Chem. A 2009, 113,
2397.
[42] J. C. Zhang, Y. H. Wang, X. Guo, J. Lumin. 2007, 122 –
123, 980.
[43] A. Moopenn, L. B. Coleman, J. Phys. Chem. Solids
1990, 51, 1099.
[44] M. Ren, J. H. Lin, Y. Dong, L. Q. Yang, M. Z. Su, L. P.
You, Chem. Mater. 1999, 11, 1576.
[45] J. P. Laperches, P. Tarte, Spectrochim. Acta 1966, 22,
1201.
[46] G. Blasse, G. P. M. van den Heuvel, Phys. Stat. Sol.
1973, 19, 111.
[47] S. D. Ross, Spectrochim. Acta A 1972, 28, 1555.
[48] W. C. Steele, J. C. Decius, J. Chem. Phys. 1956, 25,
1184.
[49] R. Böhlhoff, H. U. Bambauer, W. Hoffmann, Z.
Kristallogr. 1971, 133, 386.
[50] K. Machida, H. Hata, K. Okuno, G. Adachi, J. Shiokawa, J. Inorg. Nucl. Chem. 1979, 41, 1425.
[51] L. Nasdala, D. Smith, R. Kaindl, M. Ziemann in Spectroscopic Methods in Mineralogy. Eötvös University
Press, Budapest, 2004, pp. 281 – 343.
[52] P. C. Burns, M. A. Carpenter, Can. Mineral. 1997, 35,
189.
[53] A. F. Murray, D. J. Lockwood, J. Phys. C: Solid State
Phys. 1978, 11, 2349.
[54] M. N. Iliev, V. G. Hadjiev, J. Íñiguez, J. Pascual, Acta
Phys. Pol. 2009, 116, 19.
[55] H.-Y. Sun, W. Sun, Y.-X. Huang, J.-X. Mi, Z. Anorg.
Allg. Chem. 2010, 636, 977.
[56] B. Schrader, Raman/Infrared Atlas of Organic Compounds, 2nd ed. Wiley-VCH, Weinheim, 1989.
�
 pravin shinde