African Journal of Biotechnology Vol. 9 (25), pp. 3949-3954, 21 June, 2010
Available online at http://www.academicjournals.org/AJB
DOI: 10.5897/AJB09.1198
ISSN 1684–5315 © 2010 Academic Journals
Full Length Research Paper
Compensatory growth assessment by plasma IGF-I
hormone measurement and growth performance in
rainbow trout (Oncorhynchus mykiss)
Ruhollah Rahimi1*, Mehrdad Farhangi2, Bagher Mojazi Amiri2, Fatemeh rezaie2, Parisa
Norouzitallab2 and Afshin Afzali2
1
Department of Fisheries, Faculty of Marine Sciences, Chabahar Maritime University, Chabahar, 99717-56499, Iran.
Department of Fisheries and Environment, Faculty of Natural Resources Engineering, Tehran University, Karaj, 315854314, Iran.
2
Accepted 26 October, 2009
This study aimed to show the difference in compensatory growth (CG) with different starvation and
feeding periods replications, depending on the IGF-I hormone level in the blood. There were 4
treatments in 3 replications. Other indexes like food coefficient ratio (FCR), specific growth rate (SGR)
and daily food intake were also examined during the experiment. Fish were fed twice a day ad libitum as
follows during the 65 days. Treatment A (TA): control treatment, continues feeding. Treatment B (TB): 4
weeks of starvation and 5 weeks of re-feeding. Treatment C (TC): 3 weeks of starvation and 5 weeks of
re-feeding. Treatment D (TD): 2 weeks of starvation and 5 weeks of re-feeding. Each tank contained 23
fishes in each unit with an initial mean weight (SD) of 47.19 ± 0.42 (g). Blood was sampled in IGF-I
hormone concentration at the beginning of the experiment, at the end of the starvation period and every
12 days in re-feeding periods. There was no significant difference between the treatments in FCR (P >
0.05). TB and TC had significant difference (P < 0.01) in comparison with other treatments in SGR, but
no significant difference was observed among them (P > 0.05). IGF-I concentrations came down in
comparison with control treatment at the end of the starvation period (Day 29) (P < 0.001), but no
significant difference was observed among the treatments at the end of the re-feeding period (P > 0.05).
According to the results, TB and TC showed more indexes of CG in comparison with TA and TD. Still
IGF-I cannot show the quality of CG alone and other growth relating physiological elements in different
feeding diets and regimes will be evaluated in future studies.
Key words: Compensatory growth, food coefficient ratio, food intake, IGF-I, rainbow trout, special growth ratio.
INTRODUCTION
Most teleost fish species require high levels of dietary
amino acids (300 – 600 g/kg; Cowey, 1995) which comercially meet with fish meal-based feed. The sustainability
of this practice, which requires large inputs of wild fish for
feed, has been questioned (Naylor et al., 2000). Rainbow
trout, Oncorhynchus mykiss, is one of the most
demanded fishes all around the world both from the
production and consumption point of view. The most cost
effective part of trout farming belongs to food due to the
*Corresponding author. E-mail: r_rahimi6083@yahoo.com. Tel:
0098545-2224264. Fax: 0098545-2221025.
high protein requirement. Feeding practices can have
significant effects on trout farming expenses and
productivity. True satiation feeding can be difficult to
achieve economically in ponds, because many factors
can affect daily food intake. Variations in feeding response can result either in over-feeding or under-feeding
of fish, which in turn can have a negative effect on the
production cost (Reigh et al., 2006). Since compensatory
growth (CG) is characterized by accelerated growth and
improved feed conversion, the response has the potential to
improve cultivation of this economically valuable fin fish. CG
is referred to as a period of growth that exceeds normal
rates after animals are alleviated of certain growth-stunting
conditions (Picha et al., 2006).
�3950
Afr. J. Biotechnol.
Compensatory growth has been demonstrated in many,
but not all, teleosts and appears to be dependent on a
variety of factors including the degree of growth
suppression and catabolism prior to the response (for
review see Ali et al., 2003). There are several reports of
CG in fishes, such as brown trout, Salmo trutta (Alvarez
and Nicieza, 2005), Atlantic halibut, Hippoglossus
hippoglossus (Heide et al., 2006), gilthead sea bream,
Sparus auratus (Montcerrat et al., 2007), channel catfish,
Ictalurus punctatus (Reigh et al., 2006), Vimba vimba
(Mycskowsky et al., 2006), Prussian carp, Carassius
auratus gibelio (Misaila et al., 2007) and rainbow trout, O.
mykiss (Nikki et al., 2004). Generally, CG may occur due
to the endocrine system alterations (Hornick et al., 2000);
however, little is known about the endocrine control of
CG in teleosts (Picha et al., 2006). Various studies had
reported hormones as growth controlling factors (Jones
and Clemmons, 1995; Mommsen, 1998), one of the main
being insulin-like growth factor-I (IGF-I) (Duan, 1998;
Perez-Sanchez and LeBail, 1999). The growth hormone
(GH) insulin-like growth factor (IGF) axis is central to the
control of growth in teleost fishes, as well as in other
vertebrates (Jones and Clemmons, 1995; Oksbjerg et al.,
2004; Wood et al., 2005). Insulin-like growth factor-I (IGFI), a 70 aa polypeptide produced primarily in the liver, is
involved in cell differentiation and proliferation and
ultimately body growth (Moriyama et al., 1994). Although
endocrine IGF-I of hepatic origin is thought to account for
the majority of somatic growth, autocrine and paracrine
effect may also play a significant role (Chauvigne et al.,
2003). The foremost role of IGF-I is to regulate
development and growth by mediating growth hormone
(GH) action. However, it has other biological effects, such
as direct effects on cell growth, differentiation and
metabolism (Banos et al., 1999). IGF-I has been reported
to be affected by the nutritional factors.
There are some researches on using hormones as
growth markers (Perez-Zanchez et al., 1999). Dyer et al.
(2004) studied the effects of different diets and feeding
regimes in different fin fishes such as barramundi (Lates
calcarifer), Atlantic salmon (Salmo salar) and Southern
Bluefin tuna (Thunnus maccoyii) by measuring the
plasma IGF-I concentration and suggested that IGF- I
can be a good index for the assessment of diets and
feeding regimes. There are not many studies on CG
ranges which evaluate the physiological indexes,
especially by IGF-I hormone which can be a fast and
easy index to know the CG performance. Therefore, the
present study was conducted to assess compensatory
growth by plasma IGF-I concentration that are affected by
different starvation and re-feeding periods.
MATERIALS AND METHODS
Experimental animals and design
Fingerlings rainbow trout procured from Dr Motamed
Farm (Iran, Karaj) were transported with proper aeration
to the Nutrition Laboratory of Fisheries and Environmental Department, Tehran University, Karaj, Iran. The
fishes were acclimatized to the laboratory conditions for
about 2 weeks during which they were fed with control
diet. The feeding trial was conducted in uniform tanks
(with semi re-circulation system) of 100-L capacity (with
water volume of 90 L). Groups of 23 fishes (average
weight: 47.19 g /fish) were stocked in 12 tanks, which
were randomly distributed in four treatments each with
three replicates. Treatment A (TA): control treatment,
continues feeding; treatment B (TB): 4 weeks of starvation and 5 weeks of re-feeding; treatment C (TC): 3
weeks of starvation and 5 weeks of re-feeding; treatment
D (TD): 2 weeks of starvation and 5 weeks of re-feeding.
Fish were fed with dry pellets (Chineh GFT-1 3.5 mm;
37% protein, 14% fat, 20% carbohydrate, 12% ash, 9%
humidity according to the manufacturer). Feeding was
done twice daily ad libitum. The experiment was conducted in 12:12 h light–dark cycles. Water exchange (30%)
was carried out daily. Water quality parameters
(temperature, 15.2; pH, 7.6; dissolved oxygen, 8.2) were
TM
checked daily using HACH digital portable and were
found within the optimum range.
Growth study
Fishes in each tank were bulk weighed twice, first after
the starvation period and second after the feeding period.
Growth performance of fishes was evaluated in terms of
weight gain, food conversion ratio (FCR) and daily feed
intake (FI) based on the following standard formulae:
Weigth gain % = (Wf – Wi) /Wi × 100
SGR (% per day) = (InWf – InWi) / t x 100; where Wf is
the final wet weight, Wi is the initial wet weight and t is
the number of days.
FCR = total dry feed intake (g) /wet weight gain (g)
FI (%) = Feed intake (g) / biomass (g) day -1 × 100.
Blood sampling
Blood was sampled for IGF-I hormone concentration
examination at the beginning of the experiment, at the
end of the starvation period and every 12 days in refeeding periods. To minimize the effect of handling
stress, fish were anesthetized with clove pink extract at a
dose of 2 ml/l and blood samples were collected taken
from the caudal vein using syringe, which was previously
rinsed with ethylene-diamine-tetra-acetic acid, EDTA (as
an anticoagulant). Blood collected was then transferred
immediately to an eppendorf tube containing a thin layer
�Rahimi et al.
3951
Table 1. Growth, food intake and food coefficient ratio, Initial weight, weights at the end of fasting periods, specific growth rates,
Weight gain, survival rate, FCR, daily food intake results.
Index
Initial weight (g ± sd)
Weight after fasting (g ± sd)
Weight gain (g ± sd)
Final weight (g ± sd)
SGR
Daily feed Intake (%)
FCR
Survival (%)
TA
46.86 ± 0.056 a
a
89.36 ± 1.16
59.24 ± 5.50a
a
148.61 ± 6.61
c
1.53 ± 0.08
1.66 ± 0.08 b
a
1.29 ± 0.08
a
97.10 ± 0.02
TB
47.58 ± 0.11a
d
43.22 ± 0.22
57.89 ± 4.15a
c
101.11± 4.22
a
2.47 ± 0.05
2.15 ± 0.27 a
a
1.08 ±0.01
a
98.55 ± 0.02
TC
46.79 ± 0.76 a
c
53.48 ± 1.07
62.42 ± 6.23a
b
115.91 ± 7.28
a
2.34 ± 0.14
2.16 ± 0.09 a
a
1.24 ± 0.27
a
97.10 ± 0.02
TD
47.52 ± 0.33 a
b
62.55 ± 0.31
62.04 ± 2.45a
b
124.59 ± 2.7
b
2.08 ± 0.05
2.01 ± 0.15 ab
a
1.15 ± 0.02
a
98.55 ± 0.02
p
0.09
0.000
0.62
0.000
0.000
0.02
0.32
0.80
Treatment A (TA): Control treatment, continuous feeding. Treatment B (TB): 4 weeks of starvation and 5 weeks of refeeding. Treatment C
(TC): 3 weeks of starvation and 5 weeks of refeeding. Treatment D (TD): 2 weeks of starvation and 5 weeks of refeeding.
Each tank was containing 23 fishes in each unit with an initial mean weight (SD) 47.19 ± 0.42.
of EDTA powder and shaken well to prevent hemolysis of
blood. The tubes were then centrifuged at 3000 g for 10
min and the plasma was collected and stored at -80°C
until radio-immunoassays (RIA) were performed.
IGF-I assay
Plasma IGF-I level was measured by RIA, using human
recombinant IGF-I as standard and rabbit anti-human
IGF-I antibodies as antiserum (Pérez-Sánchez et al.,
1994) and which had been validated for brown trout
plasma (Baños et al., 1999).
Statistical methods
A Kolmogorov–Smirnov test was used to assess the
normality of distributions. Data of IGF-I, growth and
nutritional parameters were compared using one-way
analysis of variance (ANOVA) and Tukeys multiple range
test. Statistical significance was accepted at P < 0.05
levels. Minitab 13.0 software was used for statistical
analysis.
(without fasting period). Food coefficient ratios data
(Table 1) did not show significant difference between
groups (P > 0.05), but daily food intake percentage data
(Table 1) showed differences between treatments B and
C in comparison with control group (P < 0.05). The
highest daily food intake percentage was recorded in
treatments B and C groups and lowest daily food intake
percentages were recorded in control (without fasting
period).
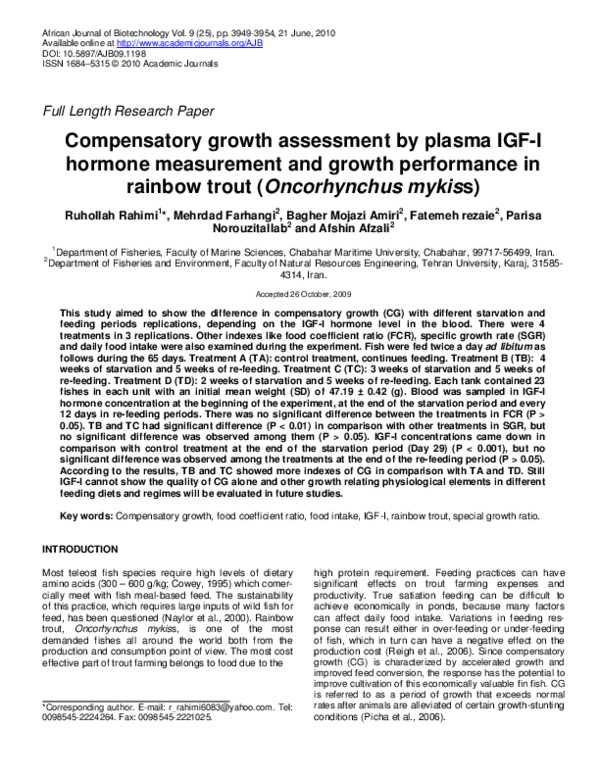
IGF-I
Results (Figure 1) showed IGF-I concentrations and their
changes during fasting and re-feeding periods. The
plasma IGF-I levels of the treatments TB, TC and TD
were significantly (P < 0.05) decreased during fasting;
however, no significant differences were observed
between the fasting groups. In contrast, the plasma IGF-I
level in groups with re-feeding started to increase
gradually, reaching the control level at the end of the refeeding periods.
IGF-I and food intake correlation
RESULTS
Growth performance and survival of rainbow trout
Results (Table 1) showed that final weights, SGR and
daily food intake were significantly (P < 0.05) decreased
by fasting periods, while there were no differences in
comparison altogether. Growth data (Table 1) after refeeding periods showed that weight gain of rainbow trout
fingerlings were not significantly different (P > 0.05) in all
of the groups. Results of SGR (specific growth rates)
were significantly (P < 0.01) improved by re-feeding
practice. The highest SGR was recorded in treatments B
and C groups, and lowest SGR were recorded in control
Plasma IGF-I and food intake data (Figure 2) showed
2
significant correlation (r = 0.81, P = 0.000) between
them.
DISCUSSION
Weight gain was not significantly different between
groups. The SGR results from this study showed that
rainbow trout fingerlings are affected by fasting periods.
SGR was significantly better for the test groups than for
control fish in refeeding period. SGR for the TB and TC
groups were higher than for the TD group. Fasting
periods influenced on growth rate in refeeding periods
�3952
Afr. J. Biotechnol.
19
TA
IGF-I ngml-1
17
TB
15
TC
13
TD
11
9
7
1
2
3
4
5
Day
Figure 1. Plasma IGF-I change trends of different treatments during experiment.
r2 =
p=
Figure 2. IGF-I and daily food intake correlation.
that could induce compensatory growth (CG). SGR of
fasting groups confirm the findings of Quinton and Black
(1990) who found that measures of growth such as SGR
were significantly improved when rainbow trout
fingerlings were re-fed, while some past studies including
Weber and Bosworth (2005) achieved conflict results.
These differences in the findings could be due to
starvation severity or experimental conditions. Fast
growth ability after fasting periods could compensate for
depressed growth in comparism to control group
(Maclean and Metcalf, 2001; Xie et al., 2001; Zhu et al.,
2001; Tian and Qin, 2004; Nikki et al., 2004). Higher SGR
in re-feeding periods is one of compensatory growth
indexes (Gaylord and GatlinIII, 2001; Nikki et al., 2004;
Zhu et al., 2004). Therefore, higher SGR of TB and TC
treatments have higher compensation in comparison to
other groups.
Improved food coefficient could not be seen in all of the
�Rahimi et al.
groups. Results of food coefficient showed that feeding
regimes did not improve but hyperphagia of B and C fish
groups could be seen in comparison with control fishes.
These results confirm some past studies (Gonzalez et al.,
1995; Wang et al., 2005; Heide et al., 2006). Boujard et
al. (2000) recorded reduced food coefficient and
hyperphagia. Li et al. (2006) recorded decreasing of food
conversion efficiency in fasting groups in comparison with
control group. Probably, these differences could be due
to differences in the experimental conditions, experimental design and physiological condition of animal
(Jobling and Koskela, 1996). Hierarchy behavior could be
seen in salmonids that reduce food coefficient (MCItyre et
al., 1979; Jobling and Wansvike, 1983). Hierarchy due to
increase in metabolical activities, energy consumption
and decrease in food intake in dominant fish is because
of their aggressive behaviors in feeding time; also
decrease in food intake in other fishes is because of
inhibiting actions of dominant fishes that reduce food
coefficient (Jobling and Wandsvik, 1983). Causes of this
problem could consist of hierarchy existence or experimental design and physiological conditions of fishes.
Food intake results demonstrate that B and C groups
have higher compensation in comparism to other groups.
Results of SGR and food intake show TB, TC groups
have higher compensation in comparism to D treatment.
But B and C groups have no difference in comparism
altogether.
IGF-I
The plasma IGF-I levels of the treatments, TB, TC and
TD were significantly decreased during fasting and however, no significant differences were observed between
the fasting groups. In contrast, the plasma IGF-I level in
groups with refeeding started to increase gradually
reaching the control level at the end of the re-feeding
periods. Plasma IGF-I concentrations compensate in 12
initial days of refeeding periods then achieved permanent
trend until end of refeeding periods. There were no
differences between treatments. Effects of fasting and
refeeding in mammalian demonstrated similar result like
those in this study This phenomenon has been observed
in higher vertebrata like human, sheep and chick
(Thissen et al., 1994). Changes of IGF-I during starvation
and refeeding confirm some past studies (Duan and
Hirano, 1992; Moriyama et al., 1994). Reduction of IGF-I
concentration induces lipolysis and inhibits degradation of
proteins (Perez-Sanchez and LeBail, 1999). Significant
positive correlation exists between IGF-I and food intake
(Figure 2) that demonstrates IGF-I effect by nutritional
status. These results are confirmed by different studies in
higher vertebrata (Thissen et al., 1994). Study on
salmonids (Duguay et al., 1994), trout (Niu et al., 1993) and
sea bream (Perez- sanchez et al., 1994) confirm synthesis
and releasing of IGF-I, depending on nutritional status.
Several authors had suggested that IGF-I concentra-
3953
tions could be used to assess different diets and feeding
regimes (Perez- Sanchez and LeBail, 1999; Dyer et al.,
2004; Li et al., 2006). Past studies focus on diets assessment by physiological indicators including hormones,
their receptors and else. Past studies on nutritional
assessment by IGF-I were related to diets (PerezSanchez and LeBail, 1999; Dyer et al., 2004; Li et al.,
2006). The major aim of present study was to answer this
question: could IGF-I be used for CG assessment? IGF-I
concentrations show no significant difference between
treatments and control group at the end of experiment
(Figure 1). These results showed that measurement of
IGF-I could not be used as an index for assessment of
CG. Studies of others on diets assessment conflict
present result on CG assessment. These differences may
refer to unclear knowledge and complication of CG
phenomena or physiological conditions of fish and
experiment conditions.
In conclusion, IGF-I could not be used for CG assessment alone. It should be used with other physiological
elements such as other hormones, receptors and/or
binding proteins that may be useful physiological tools for
CG assessment in future studies.
ACKNOWLEDGMENTS
The authors wish to thank Esmaeil soleimani,
Mohammad Babapour, Ardeshir Sheikh Ahmadi
Mohammad Reza Karimi, Majid Bakhtiari, Afshin Afzali
and Ahmad Imani for their assistance during the
experiment.
REFERENCES
Ali M, Nicieza A, Wootton RJ (2003). Compensatory growth in fishes: a
response to growth depression. Fish. Fisher. 4: 147 - 190.
Alvarez D, Nicieza, AG (2005). Compensatory responses ‘defend’
energy levels but not growth trajectories in brown trout, Salmo trutta
L. Proce. Ro. Soc. Ser. B 272: 601 - 609.
Banos N, Planas JV, Gutierrez J, Navarro I (1999). Regulation of
plasma insulin-like growth factor-I levels in brown trout (Salmo trutta).
Com. Biochem. Physiol. Part C, 124: 33-40.
Boujard T, Burel C, Medale F, Haylord G, Moisan A (2000). Effect of
past nutritional in rainbow trout (Oncorhynchus mykiss). Aquac. Liv.
Res. 13: 129 - 137.
Duan C, Hirano T (1992). Effects of insulin like growth factor and insulin
on the in vitro uptake of sulfate by eel branchial cartilage: evidence
for the presence of independent hepatic and panceratic sulfation
factors. J. Endocrinol. 139: 243 - 252.
Duan C (1998). Nutritional developmental regulation of insulin-like
growth factors in fish . J. Nutr. 128, 306 - 314.
Duguay SJ, Swanson P, Dickhoff WW (1994). Differential expression &
hormonal regulation of alternatively spliced IGF-I mRNA transcript in
salmon. J. Mol. Endocrinol. 12: 25 - 37.
Dyer AR, Barlow CG, Bransden MP, Carter CG, Glencross BD,
Richardson N, Thoams PM, Williams KC, Carragher JF (2004).
Correlation of plasma IGF- I concentrations & growth rate in
aquacultured finfish: a tool for assessing the potential of new diets.
Aquaculture, 236: 583 - 592.
Farhangi M, Carter CG (2001). Growth, physiological and
immunological response of rainbow trout (Oncorhynchus mykiss) to
different dietary inclusion levels of dehulled lupin (Lupinus
angustifolius). Aqua. Res. 32(Suppl. 1): 329 - 340.
�3954
Afr. J. Biotechnol.
Gaylord GT, Gatlin III DM (2001). Dietary protein and energy
modifications to maxmize compensatory growth of channel catfish
(Ictalurus punctatus). Aquaculture, 194: 337 - 348.
Heide A, Foss A, Stefansson OS, Mayer I, Norberg B, Roth B, Jenssen
MD, Nortvedt R, Imsland KA (2006). Compensatory growth and fillet
composition in juvenile Atlantic halibut; Effect of short term starvation
periods and subsequent feeding. Aquaculture, 26: 109 - 117.
Hornick JL, Eenaeme CV, Gerard O, Dufrance I (2000). Mechanism of
reduced and compensatory growth. Dom. Anim. Endocrinol. 19: 121 132.
Jobling M, Koskela J (1996). Interindividual variation in feeding and
growth in rainbow trout during restricted feeding and in a subsequent
period of compensatory growth. J. Fish. Biol. 49: 658 - 667.
Jobling M, Wandsvik A (1983). Effect of social interaction on growth rate
and conversion efficiency of Arctic charr, Salvelinus alpinus L. J. Fish
Biol. 22: 577 - 584.
Jones JI, Clemmons DR (1995). Insulin-like growth factors and their
binding proteins: biological actions. Endocrinol. Rev. 16: 3 - 34.
Li MH, Peterson BC, Janes CL, Edwin H, Robinson EH (2006).
Comparison of diets containing various fish meal levels on growth
performance, body composition, and insulin-like growth factor-I of
juvenile channel catfish Ictalurus punctatus of different strains.
Aqauculture, 253: 628 - 635.
Maclean A, Metcalfe NB (2001). Social status, access to food and
compensatory growth in juvenile Atlantic salmon. J. Fish. Biol. 58:
1331 - 1346.
Montcerrat t N, Gómez-Requeni P, Bellini G, Capilla E, Pérez-Sánchez
J, Navarro I, Gutiérrez J (2007). Distinct role of insulin and IGF-I and
its receptors in white skeletal muscle during the compensatory growth
of gilthead sea bream (Sparus aurata). Aquaculture, 267: 188 - 198.
Moriyama S, Swanson P, Nishii M, Takahashi A, Kawaughi H, Dickhoff
W, Plisetskaya E (1994). Development of a homologous
radioimmunoassay for coho salmon insulin- like growth factor- I.
Gen.Comp. Endocrinol. 96: 149 - 161.
Nikki J, Pirhonen J, Jobling M, Karjalainen J (2004). Compensatory
growth in juvenile rainbow trout, Oncorhynchus mykiss, held
individually. Aquaculture, 235: 285 - 296.
Niu PD, Perez- Sanchez J, Le Bail PY (1993). Development of a protein
binding protein assay for teleist insolin- like growth factor (IGF)-like:
relationship between growth hormone (GH) and IGF-like in blood of
rainbow trout (Oncorgynchus mykiss). Fish. Physiol. Bioch. 11: 381 391.
Perez-Sanchez J, Le Bail PY (1999). Growth hormone axis as marker of
nutritional status and growth performance in fish. Aquaculture, 177:
117-128.
Quinton JC, Blake RW (1990). The effect of feed cycling and ration level
on the compensatory growth in rainbow trout, Oncorhynchus mykiss.
J. Fish. Biol. 37: 33 - 41.
Reigh RC, Willaims BM, Jacob JB (2006). Influence of repetitive periods
of fasting and satiation feeding on growth and production
characteristics of channel catfish, Ictalurus punctatus. Aquaculture,
254: 506 - 516.
Thissen JP, Ketelslegers JM, Underwood LE (1994). Nutritional
regulation of the insulin- like growth factors. Endocri. Rev. 15: 80 101.
Tian X, Qin JG (2004). Effects of previous ration restriction on
compensatory growth in arramundi Lates calcarifer. Aquaculture,
235: 273 - 283.
Wang Y, Cui Y, Yang Y, Cai F (2005). Compensatory growth in hybrid
tilapia, Oreochromis mossambicus × O. niloticus, reared in sea water.
Aquaculture, 189: 101 - 108.
Weber TE, Bosworth GB (2005). Effects of 28 day exposure to cold
tempreture or feed restriction on growth, body composition, and
expression of genes related to muscle growth and metabolism in
channel catfish. Aquaculture, 246 : 483 - 492.
Xie S, Zhu X, Cui Y, Wootton RJ, Lei W, Yang Y (2001). Compensatory
growth in gibel carp following feed deprivation: Temporal pattern in
growth, nutrient deposition, feed intake and body composition. Jour.
Fish. Biol. 58: 999 - 1009.
Zhu X, Xie S, Lei W, Cui Y, Yang Y, Wootton RJ (2001). Compensatory
growth in the Chinese long snout catfish, Leiocassis longinostris,
following feed deprivation: Temporal pattern in growth, nutrient
deposition, feed intake and body composition. Aquaculture, 248: 307
- 314.
Zhu X, Xie S, Zou Z, Lei W, Cui Y, Yang Y, Wootton RJ (2004).
Compensatory growth and food consumption in gibel carp, Carassius
auratus gibelio, and Chinese long snout catfish, Leiocassis
longinostris, experiencing cycles of feed deprivation and refeeding.
Aquaculture, pp: 241 - 235-247.
�
 parisa Norouzitallab