PHYSICS AUC
Physics AUC, vol. 31, 43-52 (2021)
Estimating fluctuating volatility time series returns for a cluster
of international stock markets: A case study for Switzerland,
Austria, China and Hong Kong
Suresh BADARLA
Assistant Professor, Department of Mathematics, Amity University Mumbai
Email: sbadarla.iitm@gmail.com
Bharti NATHWANI
Associate Professor, Department of Mathematics, Amity University Mumbai
Email: bharti.nathwani@yahoo.com
Jatin TRIVEDI
Associate Professor, National Institute of Securities Markets, India
Email: contact.tjatin@gmail.com
Cristi SPULBAR
University of Craiova, Faculty of Economics and Business Administration, Craiova, Romania
Email: cristi_spulbar@yahoo.com
Ramona BIRAU
C-tin Brancusi University of Targu Jiu, Faculty of Education Science, Law and Public
Administration, Romania
Email: ramona.f.birau@gmail.com
Iqbal Thonse HAWALDAR
Department of Accounting & Finance, College of Business Administration, Kingdom University,
Sanad, Bahrain, e-mail: i.hawaldar@ku.edu.bh
Elena Loredana MINEA
Faculty of Economics and Business Administration, University of Craiova, Romania
Email: loredana.minea@yahoo.com
Abstract
The major aim of this empirical study is to estimate the volatility time series
returns for a cluster of international stock markets, such as: Switzerland,
Austria, China and Hong Kong. The paper demonstrates statistical modeleling
in order to capture volatility clusters and changes in long and short term
volatility impact. The econometric approch is based on randomly selected
daily closing return collected for the main indices of stock markets in
Switzerland, Austria, China and Hong Kong for the sample period January
2003 to September 2021. We used various statistical properties to test
normalities based on using GARCH family models for estimating financial
market volatility. Moreover, the sampled time interval includes two extreme
events such as the global financial crisis (GFC) of 2007–2008 and the recent
COVID-19 pandemic.
Keywords: volatility forecasting, GARCH family models, COVID-19
pandemic, global financial crisis, extreme event, stock returns, volatility
pattern, investor, risk
43
1. Introduction
Changes in asset prices motivates investors, researchers and observers. Financial
market research provides vital information for present and future prospects. It is also one of
the largest researched area across the world. However, with variation of methods and change
in data structure, it changes the outcome for the analytical property. With rapid investment
and return perception, the role of asset price modeling becomes more crucial. It has become
part of financial risk management and measurement of investment risk with prospective
returns. Considering important role of volatility forecasting, the usage of statistical
applications such as econometrics are very important to abstract outcome from the time series
returns or even data analysis. This paper is aimed to demonstrate usage of statistical tools to
capture volatility impact from four randomly selected financial markets i.e. SMI, Swiss
Market index, ATX, Austria market index, SSE, China market index and HangSang for Hong
Kong market index. We capture daily closing prices from first trading day of January 2003 to
last closing day of September, 2021. The study attempts to model the volatility effect using
statistical applications such as Augmented Dickey Fuller test, KPSS test, Estimate Density,
Loess fitness, Generalize Autoregressive Conditional Heteroskedasticy models (symmetric
and asymmetric) models. Researchers from across the world used GARCH family models to
demonstrate volatility behaviour based on time series returns.
The evaluation of risk and pricing of assets are most vital for any important decision
makings. Hence, it invites detail study to understand the past movements. We propose to
model the volatility and returns using advanced statistical methods. In the financial markets,
it is very important to measure and estimate volatility so the to it can be hedged accordingly.
It also helps to understand how much risk involved in any selective markets. Volatility can be
defined as the changes in asset prices (which are considered unpredictable) over the period of
time. It escalates prices to up and down side instantly. The detail study for specific markets
provides insightful information about the past trends and previous volatility that support in
any prospective decision making. Four financial markets i.e. SMI, ATX, SSE and
HANGSANG considered for the study with their daily adjusted closing prices.
The SMI Swiss index represents Switzerland’s blue-chip stock market index and
considered as most followed index to observe movements financial markets. ATX, known as
Austrian Traded index of Wiener Borse of Austria. SSE represents Shanghai Stock Exchange
of China and HANGSANG considered for Hong Kong Stock exchange. The selection of
financial markets is completely random and further not divided into continent-wise, instead
they are considered to demonstrate usage of statistical tools to estimate empirical outcome.
With introduction to autoregressive conditional heteroscedasticity models, popularly known
as ARCH model and the generalized version GARCH model, both of the models used
extensively to predict and forecast returns and volatility parameters. The main objective of
investors is to gain maximum returns bearing minimum risk parameters. Thus, it is important
to utilize one or more technical methods which allows detail review of returns for time-series
data. Birau et al. (2021) examined the behaviour of stock markets from Spain and Hong Kong
based on GARCH models. In addition, Spulbar et al. (2020) investigated the dynamics of
stock market of Hong Kong based on short term momentum effects.
In another train of thoughts, is there any linkage between physics and financial
markets? At first glance, these seem to be distinct areas of research. Nevertheless, statistical
physics, as well as other tools and techniques in physics provide a complex framework for
understanding the highly dynamic behavior of stock markets. However, researchers with
theoretical and applied expertise in the field of physics can obtain representative results in the
area of stock markets. In the complex area of modeling and forecasting the behavior of
44
international stock markets, the so-called “rocket scientists” are distinguished considering
their ability and knowledge in advanced physics, mathematical tools, technical methods or
applied science. In other words, highly technical expertise in physics is a significant
advantage in modeling stock market volatility, for example, based on advanced models.
2. Literature review
A large number of research studies have been conducted across the world indicating
usage and application of GARCH model type autoregressive models. Each study has its novel
outcome considering time-range and empirical discussion. Though the usage of such
statistical methods makes outcome and interpretation of asset property at highest interest for
researchers, academicians and practitioners. Engle (1982) introduced first ARCH model
which further generalized by Bollerslev (1986) but the model was not capable to capture
stylized facts and thus Nelson (1992), Gujarathi et al. (1993) and Engle (1993) introduced
asymmetric GARCH models such as EGARCH, GJR and Asymmetric GARCH models that
follows long process and captures leverage effect from time-series returns.
Alam and Rashid (2015) used GARCH type models to demonstrate impact of
macroeconomics variables with KSA, Karachi Stock Exchange. Belcaid and El Ghini (2019)
worked on changes in volatility pattern with international economic policy and related
uncertainty and also capturing impact of global financial crisis. Kim and Won (2018) used
GARCH models with neural network as an integrated model which delivered lowest
prediction errors. Li and Wang (2013) studied Chinese stock markets using GARCH and
GARCH type family models whereas Wong & Cheung (2011) studies Hong Kong Stock
markets using GARCH models. Ejaz et al. (2020) highlighted the opportunity international
diversified portfolio used by global investors.
Ardia et al. (2019) worked with Markov switching GARCH type models the proposed
GARCH allows user to perform simulations and maximum likelihood. On the other hand,
Endri et al. (2020) modelled Indonesian stock market with GARCH type models and
concluded impact of positive and negative news on the stock market. Whereas Mohsin et al.
(2020) used symmetric and asymmetric GARCH models to measure the volatility of bak
stock prices and macroeconomic fundamental framework and policy. They concluded that
market returns determine the various dynamics of conditional returns for banking sector
stocks. Also, Sun and Yu (2020) worked with SVR – GARCH models worked on S&P500 index and
daily exchange rate of British pound compared with the US dollars. GARCH and GARCH type
models also used to forecast and estimate prices for cryptocurrencies. For instance, Kyriazis et al.
(2019), Caporale and Zekokh (2019). Ardia et al. (2019) used traditional GARCH single regime
specifications in predicting a day ahead value at risk. They found presence of strong evidence of
regime changes in GARCH modelling process.
Haque and Shaik (2021) used GARCH models to predict crude oil prices during the pandemic
period. They worked with comparative methodology with GARCH and ARIMA. Further financial
modelling estimation also indicates explanatory variables with significance degree that helps
researchers, investors and observers for further study and decision makings. With development of
series of GARCH family models such as EGARCH, TGARCH, PGARCH, QGARCH and IGARCH
models have been also used together to deliver best fitness of results. For instance, Kim et al. (2021)
used series of GARCH family models to demonstrate best fit models. Also Ardia et al. (2019) worked
with single-regime process using GARCH modelling to forecast volatility. On the other hand, Meher
et al. (2020) used mixed ARIMA model for stock market prediction.
Trivedi et al. (2021) investigated volatility spillovers, cross-market correlation, and
co-movements using a cluster of both developed and emerging stock markets, such as: Spain,
UK, Germany, France, Poland, Hungary, Croatia, and Romania based on GARCH (1, 1)
45
models for the time period from January 2000 to July 2018. Spulbar et al. (2019) investigated
volatility patters and causality between selected developed stock markets of USA, Canada,
France and UK for the sample time period from January 2000 until June 2018 by applying a
variety of statistical tools and techniques and econometric models, including GARCH (1, 1)
model, AF test, BDS test, Granger causality test/ Vector AutoRegression (VAR) model.
Moreover, Spulbar and Birau (2018) investigated weak-form efficiency and long-term
causality for a cluster of emerging capital markets, such as: Romania, India, Poland and
Hungary for the selected period from January 2000 to July 2018.
Meher et al. (2020) investigated the impact of ESG criteria, such as: Environment,
Society and Governance on Indian stock market returns and volatility and argued that a
robust base model cannot be designed using ESG factors as independent variables in order to
forecast financial returns and stock market volatility.
3. Data collection and research methodology
We used daily closing prices of selected stock market indices and applied Augmented
Dickey Fuller (ADF) test, KPSS test and GARCH type models. First, we convert all series
returns into log returns;
Augmented Dickey Fuller test
Δyt = α + γyt-1 + λt + vt
GARCH (1,1) model represents a model introduced by Bollerslev in 1986 that
contains conditional variance represented as linear function of lags. ARCH coefficient (a1)
suggests that there is significant impact of previous period volatility shocks on current period.
Where the other coefficient GARCH (βi) measures the impact of previous period variance on
present volatility and also indicates presence of volatility clustering in series returns. GARCH
(1,1) model by Bollerslev (1986) represented by following:
As a result of conversion of log returns, we confirm significance of modeling and
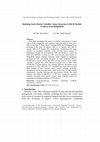
there is no longer any unit root problem with series returns. Figure 1 indicates stationary
property of selected financial markets.
46
d_l_SMISwiss
d_l_ATXClose
0.08
0.06
0.04
0.02
0
-0.02
-0.04
-0.06
-0.08
-0.1
-0.12
0.15
0.1
0.05
0
-0.05
-0.1
-0.15
20
20
20
20
20
20
20
20
20
20
-0
21
-0
20
-1
19
-0
19
-0
18
-0
21
-0
20
-1
19
-0
19
-0
18
2-
7-
2-
4-
9-
2-
7-
2-
4-
9-
01
01
01
01
01
01
01
01
01
01
d_l_SSEClose
d_l_HANGSANGClose
0.06
0.06
0.04
0.04
0.02
0.02
0
-0.02
0
-0.04
-0.02
-0.06
-0.04
-0.08
-0.1
-0.06
20
20
20
20
20
20
20
20
20
20
21
20
19
19
18
21
20
19
19
18
2
-0
-0
-0
-0
-0
-0
-0
-0
-0
-0
-0
7
-0
2
-1
4
-0
9
-0
2
-0
7
-0
2
-1
4
-0
9
-0
1
1
1
1
1
1
1
1
1
1
Figure 1. The trend of the stock return series of Switzerland, Austria, China and Hong Kong
from January 2003 to September 2021
In the selected samples described in figure 1, Hang Sang, a Hong Kong financial
market indicates the highest number of negative and positive volatility shocks compared to
the stock markets from Switzerland, Austria and China. However, the global financial impact
appears clearly on all sample data.
Table 1. Belsly-Kul-Welsch collinearity test statistics
Belsley-Kuh-Welsch collinearity diagnostics:
lambda
1.823
1.030
0.968
0.771
0.408
cond
1.000
1.331
1.372
1.537
2.114
const
0.000
0.503
0.496
0.000
0.000
SMIS~ ATXC
0.002 0.112
0.465 0.000
0.531 0.001
0.001 0.701
0.002 0.185
SSEC HANG
0.128 0.138
0.000 0.001
0.000 0.001
0.296 0.011
0.576 0.849
47
Where
lambda = eigenvalues of inverse covariance matrix (smallest is 0.407817)
cond = condition index
note: variance proportions columns sum to 1.0
According to BKW, cond >= 30 indicates "strong" near linear dependence, and cond between
10 and 30 "moderately strong". Parameter estimates whose variance is mostly associated
with problematic cond values may themselves be considered problematic.
Count of condition indices >= 30: 0
Count of condition indices >= 10: 0
There was no evidence of excessive collinearity found.
0.15
d_l_SMISwiss
d_l_ATXClose
d_l_SSEClose
0.1
0.05
0
-0.05
-0.1
-0.15
-0.04
-0.02
0
0.02
0.04
d_l_HANGSANGClose
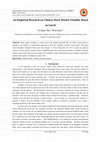
Figure 2. Correlation and market movement plot
The property of Table 1 indicates there is no evidence of excessive collinearity among the
selected stock markets. Figure 2 demonstrates relevance of other financial market movements
compared with Hang Sang which is the stock market of Hong Kong and provides scattered
returns.
Table 2. Correlation coefficients
SMISwiss
1.0000
ATXClose
-0.0239
1.0000
SSE
-0.0391
0.2391
1.0000
HANG
-0.0190
0.4212
0.5504
1.0000
SMIS
ATX
SSE
HANGSANG
Note: Author’s computation for correlation coefficients using the observations 5% critical value (two-tailed) = 0.0663 for n
= 875
48
The correlation matrix indicated in Table 2 provides relevance of market movement
from one country and its relevance to other country. Most relevance correlation found
between China and Hong Kong at 55% correlation, whereas the other two European market
negatively correlated.
Correlation matrix
1
d_l_SMISwiss
1.0
-0.0
-0.0
-0.0
0.5
d_l_ATXClose
-0.0
1.0
0.2
0.4
0
d_l_SSEClose
-0.0
0.2
1.0
0.6
-0.5
d_l_HANGSANGClose
-0.0
0.4
0.6
1.0
se
e
lo
os
GC
EC
l
SA
N
HA
NG
d_
l_
d_
l_
SS
AT
XC
l_
d_
d_
l_
SM
IS
w
lo
is
se
s
-1
Figure 3. Correlation Matrix for selected stock market indices from Switzerland, Austria,
China and Hong Kong
Table 3. Statistical property of GARCH (1, 1) model
Austria
China
Hong Kong
Switzerland
Constant 0.000624
5% 0.000436
8.84E-05
-0.0001
Omega
5.77E-06
1% 5.85E-06
5% 7.95E-06
5% 6.52E-06
Alpha
0.176284
1% 0.140828
1% 0.055316
1% 0.051784
Beta
0.760508
1% 0.825378
1% 0.888499
1% 0.906208
AIC
-5870.94
-5807.2
-5718.3
-5623.64
BIC
-5851.84
-5787.79
-5698.93
-5604.25
1%
1%
Table 3 regarding statistical property indicates that GARCH type models can be used
to forecast and estimate financial market returns. We found that European market – SMI,
financial market of Switzerland only fits with GARCH type models with lowest degree of
Beta and highest degree of significant alpha. Other financial markets such as Austria, China
and Hong Kong could not be estimated using GARCH model. Moreover, as a result statistics
49
have not provided significant p-value, while outcome property exceeded the statistical
parameters.
Table 4. Statistical property of EGARCH model
Austria
China
Hong Kong
Switzerland
Constant 0.000102
0.000577
1% 0.000384
1% 0.000307
Omega
-0.421303 1% -0.3395
1% -0.1444
1% -0.22692
Alpha
0.157253
1% 0.16361
1% 0.1152
1% 0.11959
1% 0.003083
1% -0.05246
Gamma -0.145689 1% -0.09587
Beta
0.968153
1% 0.976012
1% 0.99273
1% 0.98455
AIC
-31099.85
-28894.33
-27773.94
-28991.97
BIC
-31067.57
-28861.97
-27741.59
28959.62
5%
1%
1%
1%
1%
Considering the sample data for a cluster of four stock markets, the property of Table
4 indicates significant information about movement pattern and volatility clusters in financial
markets. Sample markets of Switzerland, Austria and Hong Kong found presence of
asymmetry (leverage effect) and only market SSE – China does not have leverage effect.
Leverage effect considered as important measurement to look at the prospects in financial
markets. It suggests reaction of negative news in past, and whether the market has tendency
to carry forward negative shocks longer period of time than the positive shocks.
Conclusions
In this research paper we have investigated the long-term behaviour of a cluster which
includes four randomly selected stock markets, such as: Switzerland, Austria, China and
Hong Kong. We employed various statistical tools and econometric models in order to
process the outcome. We found there is significant and valuable outcome can be derived
using statistical property with data analysis. The use of correlation helped to understand the
existing correlation between selected financial markets, the same also plotted and
demonstrated as results. The ADF used with constant and trend and provides stationarity for
all financial markets. GARCH (1,1) model was employed and fitted well with Switzerland
stock market (SMI). Moreover, the stock markets of Switzerland, Austria and Hong Kong
found with presence of leverage effect, and only SSE China have no significant presence of
leverage effect. Stock markets represent a high challenge for physicists given the theoretical
and applied background based on methods and techniques of advanced mathematics and
applied sciences. For future research we aim to investigate the accuracy of statistical physics
tools compared to financial econometrics advanced models based on a complex empirical
study focused on European stock markets during COVID-19 pandemic.
50
References
[1] Alam, Z., & Rashid, K. (2015). Time Series Analysis of the Relationship between
Macroeconomic Factors and the Stock Market Returns in Pakistan. Journal of Yaşar University.
https://doi.org/10.19168/jyu.55431
[2] Ardia, D., Bluteau, K., Boudt, K., Catania, L., & Trottier, D.A. (2019). Markov-switching
GARCH models in R: The MSGARCH package. Journal of Statistical Software.
https://doi.org/10.18637/jss.v091.i04
[3] Ardia, D., Bluteau, K., & Rüede, M. (2019). Regime changes in Bitcoin GARCH volatility
dynamics. Finance Research Letters. https://doi.org/10.1016/j.frl.2018.08.009
[4] Bollerslev, T. Generalized autoregressive conditional heteroskedasticity. J. Econ. 1986, 31,
307–327.
[5] Belcaid, K., & El Ghini, A. (2019). U.S., European, Chinese economic policy uncertainty and
Moroccan
stock
market
volatility.
Journal
of
Economic
Asymmetries.
https://doi.org/10.1016/j.jeca.2019.e00128
[6] Birau, R., Spulbar, C., Trivedi, J., & Florescu, I. (2021) Modeling volatility in the stock
markets of Spain and Hong Kong using GARCH family models in the context of COVID - 19
pandemic, Revista de Științe Politice. Revue des Sciences Politiques, 72, 3 - 21.
[7] Ejaz, A., Birau, R., Spulbar, C., Buda, R., Tenea, A.C. (2020) The impact of domestic portfolio
diversification strategies in Toronto stock exchange on Canadian textile manufacturing
industry, Industria Textila, 71, 3, 215–222, http://doi.org/10.35530/ IT.071.03.1696.
[8] Engle, R.F. Autoregressive conditional heteroskedasticity with estimates of the variance of
U.K. Inflation.Economics 1982, 50, 987–1008.
[9] Endri, E., Abidin, Z., Simanjuntak, T. P., & Nurhayati, I. (2020). Indonesian stock market
volatility: GARCH model. Montenegrin Journal of Economics. https://doi.org/10.14254/18005845/2020.16-2.1
[10] Haque, M. I., & Shaik, A. R. (2021). Predicting crude oil prices during a pandemic: A
comparison of arima and garch models. Montenegrin Journal of Economics.
https://doi.org/10.14254/1800-5845/2021.17-1.15
[11] Kim, J. M., Kim, D.H. & Jung, H. (2021). Estimating yield spreads volatility using GARCHtype models. North American Journal of Economics and Finance. https://doi.org/
10.1016/j.najef.2021.101396.
[12] Kim, H. Y., & Won, C. H. (2018). Forecasting the volatility of stock price index: A hybrid
model integrating LSTM with multiple GARCH-type models. Expert Systems with
Applications. https://doi.org/10.1016/j.eswa.2018.03.002
[13] Liu, H.-C., Hung, J.-C. (2010) Forecasting S&P-100 stock index volatility: The role of
volatility asymmetry and distributional assumption in GARCH models/ Expert Systems with
Applications, 37, 4928–4934
[14] Li,W., & Wang, S.S. (2013) Empirical studies of the effect of leverage industry
characteristics. WSEAS Trans. Bus. Econ., 10, 306–315.
[15] Meher, B.K., Hawaldar, I.T., Mohapatra, L., Spulbar, C., & Birau, R. (2020) The Effects of
Environment, Society and Governance Scores on Investment Returns and Stock Market
Volatility, International Journal of Energy Economics and Policy, 10(4), 1-6, DOI:
https://doi.org/10.32479/ijeep.9311.
[16] Meher, B.K., Thonse, H.I., Spulbar, C.M., & Birau, F.R. (2021) Forecasting Stock Market
Prices Using Mixed ARIMA Model: A Case Study of Indian Pharmaceutical Companies,
51
Investment Management and Financial
http://dx.doi.org/10.21511/imfi.18(1).2021.04.
Innovations,
18
(1),
42-54.
Doi:
[17] Mohsin, M., Naiwen, L., Zia-UR-Rehman, M., Naseem, S., & Baig, S.A. (2020). The
volatility of bank stock prices and macroeconomic fundamentals in the Pakistani context: An
application
of
GARCH
and
EGARCH
models.
Oeconomia
Copernicana.
https://doi.org/10.24136/OC.2020.025.
[18] Kyriazis, Ν.A., Daskalou, K., Arampatzis, M., Prassa, P., & Papaioannou, E. (2019).
Estimating the volatility of cryptocurrencies during bearish markets by employing GARCH
models. Heliyon. https://doi.org/10.1016/j.heliyon.2019.e02239
[19] Spulbar, C. & Birau, R. (2018) Testing weak-form efficiency and long-term causality of the
R.I.P.H emerging capital markets, International Journal of Business Quantitative Economics
and Applied Management Research, 5(2), 1-19.
[20] Spulbar, C., Trivedi, J., Birau, R., Tenea, C.A. & Ejaz, A. (2019) Estimating volatility
spillovers, dynamic causal linkages and international contagion patterns between developed
stock markets: An empirical case study for USA, Canada, France and UK, Annals of the
„Constantin Brâncuşi” University of Târgu Jiu, Economy Series, „Academica Brâncuşi”
Publisher, Issue 3/2019, 44-62.
[21] Spulbar, C., Imran, A.I., Birau, R. (2020) Analyzing Short Term Momentum Effect on Stock
Market of Hong Kong. An Empirical Case Study, “Ovidius” University Annals, Economic
Sciences Series, Volume XIX, Issue 2 /2019, 889-894.
[22] Sun, H., & Yu, B. (2020). Forecasting Financial Returns Volatility: A GARCH-SVR Model.
Computational Economics. https://doi.org/10.1007/s10614-019-09896-w
[23] Trivedi, J., Spulbar, C., Birau, R., & Mehdiabadi, A. (2021). Modelling volatility spillovers,
cross-market correlation and co-movements between stock markets in European Union: an
empirical case study. Business, Management and Economics Engineering, 19(1), 70-90.
https://doi.org/10.3846/bmee.2021.13588.
[24] Wong, A. & Cheung, K.Y. (2011) Measuring and visualizing the asymmetries in stock market
volatility: Case of Hong Kong, International Research Journal of Applied Finance, 2, 1–26.
52
Keep reading this paper — and 50 million others — with a free Academia account
Used by leading Academics

Adebayo D Agunbiade
Olabisi Onabanjo University, Ago-Iwoye, Nigeria

Murat Atan
Ankara Hacı Bayram Veli University

Rimas Norvaiša
Vilnius University

Heidi Jane Smith
Universidad Iberoamericana - Mexico