Applied Thermal Engineering 31 (2011) 902e910
Contents lists available at ScienceDirect
Applied Thermal Engineering
journal homepage: www.elsevier.com/locate/apthermeng
Towards the control of car underhood thermal conditions
Mahmoud Khaled a, b, c, Fabien Harambat b, Hassan Peerhossaini a, *
a
Thermofluids, Complex Flows and Energy Research Group, Laboratoire de Thermocinétique, CNRS-UMR 6607, Ecole polytechnique, University of Nantes,
rue C.Pauc, BP 50609, 44 306 Nantes Cedex 3, France
b
PSA Peugeot Citroën, Velizy A Center, 2 route de Gisy, 78 943 Vélizy Villacoublay, France
c
Fluid Mechanics, Heat and Thermodynamics group, School of Engineering, Lebanese International University, Beirut, Lebanon
a r t i c l e i n f o
a b s t r a c t
Article history:
Received 19 July 2010
Accepted 10 November 2010
Available online 18 November 2010
The present paper reports an experimental study of the aerothermal phenomena in the vehicle underhood compartment as investigated by measuring temperature, convective heat flux, and radiative heat
flux. Measurements are carried out on a passenger vehicle in wind tunnel S4 of Saint-Cyr-France. The
underhood space is instrumented by 120 surface and air thermocouples and 20 fluxmeters. Measurements are performed for three thermal functioning conditions while the engine is in operation and the
front wheels are positioned on the test facility with power-absorption-controlled rollers. In the thermal
analysis, particular attention is given to measuring absorbed convective heat fluxes at component
surfaces. It is shown that, in some components, the outside air entering the engine compartment (for
cooling certain components) can in fact heat other components. This problem arises from the underhood
architecture, specifically the positioning of some components downstream of warmer components in the
same airflow. Optimized thermal management suggests placing these components further upstream or
isolating them from the hot stream by deflectors. Given style constraints, however, the use of air
deflectors is more suitable than underhood architectural changes. Much of the present paper is devoted
to heat flux analysis of the specific thermal behaviours in the underhood compartment (especially the
absorption of convective heat fluxes) and to a description of a new control approach exploiting air
deflectors to optimize underhood aerothermal management.
Ó 2010 Elsevier Ltd. All rights reserved.
Keywords:
Underhood aerothermal management
Temperature
Heat flux
Convection
Radiation
Physical analysis
Air deflectors
1. Introduction
Recent trends in the automotive market stress high-performance engines and climate-control systems. At the same time,
however, automobile design must respect geometrical restrictions
related to style constraints. More and more components must
be implemented in the underhood space, and the desire for noise
reduction has augmented the use of underhood insulation. The
underhood compartment is thus becoming more and more cramped, causing complex airflows and difficult air paths that give raise
to complex aerothermal phenomena (especially convection and
radiation). These phenomena pose aerothermal management
challenges in air-intake design and front-end cooling module layout
that exacerbate the complex geometry of the underhood space.
Experimental analyses of these phenomena [1e4] are rare;
studies have focused mainly on numerical simulations [5e10],
which themselves concentrate on the major cases in temperature
* Corresponding author. Tel.: þ33 2 40 68 31 24; fax: þ33 2 40 68 31 41.
E-mail address: hassan.peerhossaini@univ-nantes.fr (H. Peerhossaini).
1359-4311/$ e see front matter Ó 2010 Elsevier Ltd. All rights reserved.
doi:10.1016/j.applthermaleng.2010.11.013
trend analysis. A review of the existing experimental literature in
underhood studies shows very little physical analysis of heat
transfer, and that mainly serving to comment on calculation/test
comparisons [11e15]. On the other hand, the underhood geometry
is already so confined and complex that implementing any design
improvements is difficult; the remaining solution is to optimize
aerothermal management by focusing on its operation mode rather
than its architecture.
The present paper reports a physical analysis of particular
underhood aerothermal behaviors intended as a basis for a new
optimization approach [16] of cooling airflow “rearrangements” in
the vehicle underhood compartments. It discusses first an experimental study of the aerothermal phenomena in the vehicle underhood compartment by temperature measurement and separate
measurements of convective and radiative heat fluxes. Measurements are carried out on a passenger vehicle in wind tunnel S4 of
Saint-Cyr-France. The underhood space is instrumented by 120
surface and air thermocouples and 20 fluxmeters. Measurements
are performed for three thermal functioning conditions, with the
engine in operation and the front wheels positioned on the experimental facility with power-absorption-controlled rollers. In
�M. Khaled et al. / Applied Thermal Engineering 31 (2011) 902e910
Subscripts and superscripts
c
convective
CF
cooling fluid
CH
cylinder head
CJ
cylinder jacket
COMB
combustion
COOL
cooling
EV
exhaust valves
EX
exhaust
g
global
m
mechanical
max
maximal
r
radiative
S
surface
SEG
segment
th
thermal
0
initial
Nomenclature
hc
n
P
Q
R
t
T
V
Wnet
convective heat transfer coefficient, W m
engine regime, rpm
engine power, kW
heat flux, kW
gearbox ratio
time, s
temperature, � C
velocity, m s 1
net work produced in the cylinder, kW
Greek symbols
4
heat flux density, W m 2
3
emissivity
s
StefaneBoltzmann constant, W m
s
time constant, s
h
efficiency
2
K
2
K
1
4
a second trial, an optimization approach using static and dynamic
deflectors to orient the different airflow paths in the underhood
compartment is then used that is based on the physical analysis of
the temperature and heat flux measurements.
The rest of this article is organized as follows. Section 2 gives
a theoretical discussion of the basic heat transfer types in the
underhood space and their possible arrangements. Section 3
describes the experimental setup and Section 4 is dedicated to the
results and analysis of the temperature and heat flux measurements
and to new optimization approaches based on this analysis.
2. Theoretical issues
Combustion temperatures for motor fuel are around 2200 � C
and the temperatures of exhaust gas at the cylinder head outlet are
of the order of 1000 � C [17,18]. It is therefore necessary to cool the
piston, valves, and cylinder walls in order to prevent them from
melting. In automotive applications, cooling is most commonly
done by water: the engine, particularly the cylinder head and
cylinder block, contains cavities (water chambers) in which water
circulates, controlled by a centrifugal pump. If a part QCOOL of the
thermal energy QCOMB released by the reaction (combustion) is
then removed by the water before any further exchange, it is quite
similar to what would happen with a transmission of only
ðQCOMB QCOOL Þ to the combustion gases. However, for engines of
small and middle power, the combustion efficiency defined by:
hCOMB ¼
ðQCOMB QCOOL Þ
QCOMB
Wnet
QCOMB
Finally, the overall efficiency of an engine is the ratio between
the mechanical energy produced by the engine as power and the
heat energy provided by the fuel. The overall performance depends
on the thermal performance and mechanical efficiency:
(3)
hg ¼ hth hm
Thus, engine function is governed by an overall efficiency that
causes the energy restored in engine power to be less than the
energy produced by combustion, the overall efficiency being about
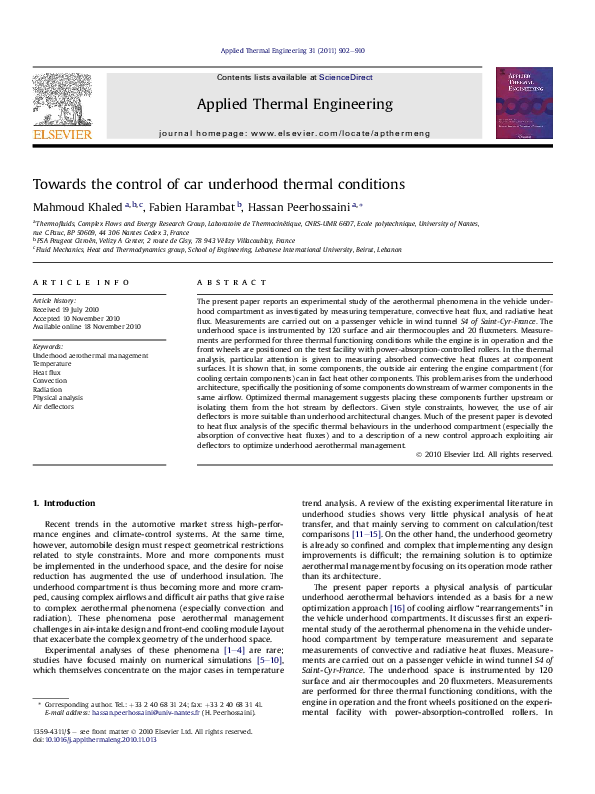
0.3e0.4. The difference between primary energy and combustion
engine power is then arranged among exhaust energy, energy lost by
convection (in the cooling system and under the hood) and energy
lost by radiation. Fig. 1 shows a schematic of the heat distribution,
noting the orders of magnitudes involved, in the underhood space of
a diesel engine [17,18]. The problem of underhood aerothermal
management essentially entails controlling these heat exchanges
and their impact on component temperatures.
3. Experimental setup and methods
This section describes the different instrumentations performed
in the underhood compartment, the experimental configurations
and phases, and the experimental protocol [19e22].
Fuel combustion
(1)
is generally significantly high in the internal combustion system
(about 70%). During the thermodynamic cycle of the air, net work is
produced in the cylinder that corresponds to the energy generated
in the pistons. The thermal efficiency of the thermodynamic cycle
of an engine is defined as the ratio of the net work produced in the
cylinder and the heat energy released by fuel combustion:
hth ¼
903
QCOMB
Exhaust
Cooling
Oil
Crank
QEX 25% QCOOL 33% QOIL 8% Wnet 34%
Exhaust valves Cylinder head Cylinder jacket Segment
QEV
4,5%
QCUL 12%
QCJ
10,5%
QSEG 6%
(2)
On the other hand, the mechanical efficiency hm, defined as the
ratio between the energy produced on the piston (effective power)
and energy collected on the flywheel of the crank (indicated
power), is reduced by internal mechanical friction to 0.7 (0.8 when
pieces are in as-new condition).
Cooling fluid Radiation
QCF
25%
QRAD 8%
Fig. 1. Heat arrangement in the underhood compartment and order of magnitude for
a diesel engine [1,2].
�904
M. Khaled et al. / Applied Thermal Engineering 31 (2011) 902e910
Fig. 2. Schematic of (a) top and (b) side views of some underhood instrumented locations.
3.1. Underhood instrumentation
The underhood compartment of the vehicle used here is instrumented by type T and K surface and air thermocouples and fluxmeters of normal gradients (fluxmeters based on temperature
gradient measurement in a direction normal to the upper and lower
faces of a thin plate of known thermal conductivity). Thermocouples
permit temperature measurements at almost 120 positions corresponding to different components, air zones and engine parameters
(engine fluid characteristic temperatures). Fluxmeters are attached
to the surfaces in pairs (20 fluxmeters in 10 positions) so as to make
separate measurements of the convective and radiative heat fluxes.
This technique, described in [23e25], entails attaching to a surface of
given emissivity two fluxmeters of different emissivities1. In this
case, the overall heat fluxes measured by the two fluxmeters are not
the same. By considering the surface temperatures and the
convective heat transfer coefficient measured by the two fluxmeters
to be approximately the same, one can deduce from the overall heat
fluxes measured by the two fluxmeters the convective and radiative
heat flux exchanged at the surface.
Of the components considered, the most important are the
exhaust manifold, the cold box (the box protecting the vehicle
computer and battery), the alternator, the admission distributor,
the air filter, the water outlet plenum, the apron, the charge air
1
A way to do this in practice is to paint one fluxmeter with black paint and the
other with aluminum paint.
cooler (CAC) inlet and outlet ducts, the cylinder head cover and the
right side of the engine. Of the air zones, the most important are
those close to the cowl, the apron (The apron is the upper part of
the block which separates the passenger space from the underhood
compartment), the cold box, the cylinder head cover, the air filter,
the CAC inlet and outlet ducts and that downstream of the engine
and the charge air cooler. Engine parameters are temperatures: of
water at the radiator inlet and outlet, of air at the charge air cooler
and compressor inlet and outlet, of gas at the turbine and catalyzer
inlet and outlet, and of air at the engine (cylinder) inlet. Fig. 2 shows
a schematic of the instrument locations in the underhood space (top
and side views) and an example of instrumentation at the cold box.
3.2. Experimental setup and configurations
Aerothermal experiments were performed in wind tunnel S4 of
Saint-Cyr l’Ecole France, which is a 1:1 wind tunnel with section
5 m wide and 3 m high. To eliminate wall effects, blower S4 has
a ventilated test section with longitudinal slots that simulates the
flow very close to the actual flow around the vehicle. In addition,
the wind tunnel has a roller chassis that can impose rolling resistance on the vehicle. Thus, it is possible to conduct experiments
simulating real road conditions. The front wheels are placed on the
chassis roller, the car engine runs during the tests, the driver
controls different driving modes and the front wheels then entrain
the rolls. The roller test facility is equipped with a brake system to
adjust and control the power to the wheels and their rotational
speed (Fig. 3).
�M. Khaled et al. / Applied Thermal Engineering 31 (2011) 902e910
905
measurements (Section 4.2), and suggestions for new control
approaches (Section 4.3).
4.1. Underhood thermal behaviors
During the constant-speed driving phase and for the different
thermal functioning points, typical exponential trends are observed
in all component temperature variations, air zones and engine
parameters. Exponential trends are also obtained for the temporal
variation of overall, convective and radiative heat fluxes for all
components considered. Fig. 4 shows examples of these exponential trends for thermal point TFP-1; here the different heat flux
curves are made dimensionless, by the initial flux for decreasing
flux and by the final (infinite) flux for increasing flux.
Temperatureetime variations in the constant-speed driving
phase consistently have the general form
Fig. 3. Rollers test facility equipment.
Experiments were carried out for three different thermal functioning points that simulate more or less severe rolling situations
from the thermal point of view (Table 1).
3.3. Test phases and experimental protocol
For each experiment, data records cover three successive phases, each simulating a real situation with which a vehicle can be
confronted: constant-speed driving (at a defined thermal functioning point, one of the three points in Table 1), slowdown and
thermal soak.
The constant-speed driving phase represents the rolling of a real
vehicle at defined engine regime, gear ratio and wind speed. This
phase can be TFP-1, TFP-2 or TFP-3.
The slowdown phase is simulated in the wind tunnel by passing
to neutral after the constant-speed phase and stopping the wind in
the tunnel.
The thermal soak phase follows the slowdown and simulates
the vehicle stopping after a significant heat load. Here thermal
inertia maintains temperatures higher even though the engine has
stopped. In this case, cooling airflow under the hood is achieved
only by fan rotation and/or free convection. At the beginning of this
phase, the fan rotates for a brief period (1e5 min) before stopping.
For a given configuration, experiment starts by stabilizing the
desired thermal functioning point (TFP-1, TFP-2 or TFP-3). The
engine regime reaches the preset value and data acquisition starts
for the three phases of driving, slowdown and thermal soak. The
constant-speed driving phase is maintained until temperatures
stabilize. Slowdown comes next, when the driver releases the
accelerator: the wind in the tunnel is cut and the car engine is
turned off when the air velocity reaches zero. Thermal soak begins
when the engine is turned off. During data recording, the beginning
of each of the three phases is identified.
4. Results and discussion
Here the temperature and heat flux measurements are analyzed
in three parts: underhood thermal behavior description (Section
4.1), heat flux analysis by separate convective and radiative flux
Table 1
Parameters defining the three experimental thermal functioning points: wheel and
wind speeds, engine power, gearbox ratio and engine regime.
Vwheel
Km h
PT-FCT-1
PT-FCT-2
PT-FCT-3
90
110
130
1
Vwind
Km h
90
55
130
1
P
kW
R
e
n
rpm
69
89
98
5
4
5
2600
3800
3780
� ��
t
exp
�
T0 Þ$ 1
TðtÞ ¼ T0 þ ðTmax
(4)
s
Here Tmax is the maximum temperature of quasi-stabilization at
the end of the constant-speed phase and s is the time constant, i.e.
the typical time to attain the stabilization regime.
Typical exponential expressions describing the overall, convective, and radiative heat fluxes in the constant-speed driving phase are:
�
40 Þ$ 1
4 ¼ 40 þ ð4max
4 ¼ 4N þ ð40
4N Þ$exp
�
4c ¼ 4c;0 þ 4c;max
�
4c ¼ 4c;N þ 4c;0
�
4r ¼ 4r;0 þ 4r;max
�
exp
4r ¼ 4r;N þ 4r;0
t
�
�
s
�
�
4c;N $exp
(5)
�
�
4r;N $exp
(6)
exp
4r;0 $ 1
�
s
��
�
4c;0 $ 1
�
t
�
t
s
t
s
t
s
��
�
exp
�
�
�
�
(7)
(8)
t
s
��
(9)
(10)
Here 40, 4c,0 and 4r,0 are respectively the overall, convective and
radiative heat fluxes measured for each position at the beginning of
the constant-speed driving phase. 4max, 4c,max and 4r,max are the
maximum values during the phase and 4N , 4c;N and 4r;N are the
asymptotic values at which the quasi-stabilization regime is
reached. All these heat fluxes can be either positive or negative
depending on whether the component receives (positive) or gives
up (negative) heat to its environment, and they are essentially
functions of the component location and the thermal functioning
point. It should be recalled that the overall heat flux corresponds to
the sum of the convective and radiative heat fluxes.
For the overall heat flux variations, two categories can be
distinguished:
Category 1 components for which the overall heat flux follows the
general form of equation (5). These are components
that absorb or lose overall heat fluxes increasing in
absolute value with time. In other words, these
components heat more slowly than their local thermal
environment when they absorb heat or more quickly
when they lose heat;
�906
M. Khaled et al. / Applied Thermal Engineering 31 (2011) 902e910
Temperature (°C)
Overall heat fluxes
90
80
70
60
50
40
Cold box
Cold
box
upstream
upstream
Cylinder head
Cylinder
head
cover
cover
Air filter
Air
filter
30
20
Dimensionless ϕ
Temperatures
100
0,80
0,30
-0,70
10
-1,20
500
1000
1500
1000
1500
Convective heat fluxes
Radiative heat fluxes
0,30
Cold box
Cold
box
side
side
Air filter
Air
filter
CAC inlet
CAC
inlet
duct
duct
-0,70
500
Time (s)
0,80
-0,20
0
Time (s)
Dimensionless ϕ r
0
Dimensionless ϕ c
Cold box
Cold
box
side
side
Air filter
Air
filter
CAC inlet
CAC
inlet
duct
duct
-0,20
0,80
0,30
-0,20
Cold box
Cold
box
side
side
Cold box
Cold
box
above
above
Enigne right
Enigne
right
sideside
-0,70
-1,20
-1,20
0
500
1000
0
1500
500
Time (s)
1000
1500
Time (s)
Fig. 4. Examples of temperatures and heat flux variations at some of the tested components in TFP-1.
The same distinction can be noticed in the variation of
convective heat flux (equations (7) and (8)) and radiative heat flux
(equations (9) and (10)). However, an overall heat flux variation of
the first type does not necessarily arise from variations in the
convective and radiative heat fluxes of the same category. For
example, as seen in Fig. 5 for the cold box component, the radiative
heat flux increases in absolute value (category 1), differently from
the overall and convective heat fluxes (category 2).
a 1000
Part 11
Part
Part 22
Part
800
Heat flux (W/m²)
Category 2 components for which the overall heat flux follows the
general form of equation (6). These are components
that absorb or lose overall heat fluxes decreasing in
absolute value with time. In other words, these
components heat more quickly than their nearby
thermal environment when they absorb heat or more
slowly when they lose heat.
Overall flux flux
Overall
Convective flux
Convective
flux
Radiative
flux flux
Radiative
600
400
200
0
-200
0
200
400
800
1000
1200
1400
Time (s)
4.2. Heat flux analysis e components heated by convection
b
80,0
Part
Part 11
75,0
Temperature (°C)
All components absorb heat in the constant-speed driving
phase. But the surfaces of all components have at least one portion
that receives heat and at least one that emits heat. Consider the first
case, i.e. surfaces where the overall heat flux is absorbed (thus
positive). Measurements show that, in particular cases, the
convective heat flux is also positive. In other words, air that cools
the different underhood components induces the opposite effect in
some areas and tends to heat them. This is observed, for example,
for the air filter or cold box (battery þ computer). Here the focus is
on cases in which the components are heated by convection.
On the other hand, measurements show that for almost all
components, the overall heat flux is driven by the convective heat
flux, i.e. the time variation of the overall heat flux follows that of the
convective heat flux, whatever the sign and intensity of the radiative
flux. Then, two types of variations can be distinguished: increasing
convective flux that imposes increased overall heat flux, and
decreasing convective flux that induces decreased overall heat flux.
600
Part
Part 22
70,0
65,0
60,0
55,0
Surface
temperature
Surface
temperature
50,0
Air
Airtemperature
temperature
45,0
40,0
0
500
1000
1500
Time (s)
Fig. 5. Temporal variations of (a) heat flux and (b) temperature at the cold box and its
surrounding air zone in TFP-3.
�M. Khaled et al. / Applied Thermal Engineering 31 (2011) 902e910
A typical example of the first type is the air filter. Fig. 5 shows
variations in the overall heat flux and temperature on its surface
and the surrounding air. It can be clearly seen that the overall heat
flux exchanged at the air filter surface is absorbed flux (þ1350 W/
m2). Indeed, at first the air zone near the air filter is hotter than its
surface (Fig. 5b): the passage of hot air, which has extracted heat
from high-temperature components upstream of the air filter,
especially the engine, provides a positive (absorbed) convective
flux (þ500 W/m2). On the other hand, the radiative heat flux
(þ850 W/m2) is absorbed heat flux, since the equivalent thermal
environment of the air filter is hotter than its surface.
Moreover, it can be noticed that in the first part of the constantspeed driving phase, the temperature of the air zone surrounding
the air filter increases faster than that of its surface (Fig. 5b). This
explains the increased absorbed convective heat flux (Fig. 5a), the
convective heat transfer coefficient hc remaining nearly constant
since it is in a forced convection regime. In the second part of the
constant-speed phase, the convective heat flux is stabilized because
the difference between surface and air temperatures no longer
varies.
Conversely, the radiative heat flux variation (Fig. 5a) reveals
information about the equivalent radiative temperature of the air
filter thermal surrounding, Tr. This temperature increases faster
than the surface temperature before becoming almost constant in
the second part of the constant-speed phase, where TS stabilizes
qffiffiffiffiffiffiffiffiffiffiffiffiffiffiffiffiffiffiffiffiffiffiffiffiffiffiffiffiffi
ðTr ¼ 4 TS4 þ ð4r =3$sÞÞ.
A second typical example is the decreasing convective heat flux.
Fig. 6 shows data for the cold box. Again, the convective heat flux is
positive because the surrounding air is heated near the components upstream of the cold box and its temperature becomes higher
than that of the cold box. On the other hand, the convective heat
Heat flux (W/m²)
a
1400
1200
Part 11
Part
1000
Part 22
Part
800
600
400
Overall flux flux
Overall
Radiative
flux flux
Radiative
200
0
0
Convective
flux
Convective
500
flux
1000
907
flux decreases because here the surface temperature increases
more rapidly than that of the surrounding air zone (but remains
below that temperature); this decrease now is observed in the
overall heat flux with a shift due to the negative (emitted) radiative
heat flux.
Finally, the examples above show that the exterior air that enters
the underhood compartment to cool it by convection can heat up
some components; this is exemplified by the cold box, a critical
component from a thermal point of view since it contains
computers. This problem is a result of the actual underhood architecture, specifically the positioning of these components in the
same airflow as and downstream of warmer components. An optimized thermal design may suggest placing these components
further upstream or isolating them from hot airflow with deflectors.
Note that in the case of decreasing convective heat flux, it is
essentially the early part of the transitional curve that is problematic, since the convective heat flux can reach up to five times its
asymptotic value. One can therefore imagine a mobile deflector that
cuts off the air flux towards the component in the interim period
only, letting pass the stabilized heat flux that might be useful for
other components nearby or downstream. The deflector might
even be connected to a convective flux sensor. The next section
gives more details on deflectors based on the heat flux analysis
discussed above.
Following the analysis of heat flux behaviours above, one may
also ask the following questions: is not the absorbed (positive) heat
flux the source of emitted (negative) radiative heat flux? If so, does
the radiative flux tend to zero if the convective flux is zero? If hot air
is not directed towards the cold box, could one not avoid the
radiative heat flux emitted by the cold box and absorbed by the
surrounding components?
In order to answer the above questions, a case in which absorbed convective heat flux is made up for by emitted radiative flux is
considered. Consider the overall heat flux variation at the cold box
side for the three tested thermal functioning points (Fig. 7).
At the end of the constant-speed driving phase, the overall heat
flux variations corresponding to the different thermal points are
very close. For example, it has an overall heat flux density of 31 W/
m2 in TFP-1, of 99 W/m2 in TFP-2 and 84 W/m2 in TFP-3. One can
therefore consider that the thermal situation at the cold box side
is independent of thermal functioning point. In fact, however, this
is not the case, as one can see by comparing the separate heat fluxes
(convective and radiative) for the three thermal operating points at
the same position (Fig. 8). It can be seen that the closest overall heat
fluxes for the three thermal operating points are the resultant of
convective and radiative heat fluxes that are significantly different.
110
90
Part
Part 11
100
900
Part
Part 22
80
70
60
50
Surface
temperature
Surface
temperature
Air temperature
Air
temperature
40
Overall flux (W/m²)
b
Temperature (°C)
Time (s)
TFP-1
TFP-2
TFP-3
700
500
300
100
30
-100
20
0
500
1000
1500
Time (s)
Fig. 6. Temporal variations of (a) heat flux and (b) temperature at the air filter and its
surrounding air zone in TFP-3.
0
200
400
600
800
1000
1200
1400
Time (s)
Fig. 7. Overall heat flux variation at the cold box side for the three experimental
thermal functioning points.
�M. Khaled et al. / Applied Thermal Engineering 31 (2011) 902e910
a
1400
Convective flux (W/m²)
908
1200
procedures proposed here, which are simple and easily implemented, are based on physical analysis of the aerothermal
phenomena obtained from our temperature and convective and
radiative heat flux measurements. The deflectors proposed here
may be connected to convective heat flux sensors [23e25].
TFP-1
TFP-1
1000
TFP-2
TFP-2
800
TFP-3
TFP-3
600
400
200
0
0
200
400
600
800
1000
1200
1400
Time (s)
Radiative flux (W/m²)
b
50
TFP-1
TFP-1
TFP-2
TFP-2
TFP-3
TFP-3
-50
-150
-250
-350
-450
0
200
400
600
800
1000
1200
1400
Time (s)
Fig. 8. Variations at the cold box side for the three experimental thermal functioning
points:(a) convective flux and (b) radiative flux.
For example, at the end of the constant-speed driving phase,
convective heat fluxes of 378 W/m2 in TFP-1, 332 W/m2 in TFP-2
and 164 W/m2 in TFP-3 and radiative heat fluxes of 346 W/m2 in
TFP-1, 233 W/m2 in TFP-2 and 80 W/m2 in TFP-3 are measured.
Therefore, it is the compensations between convective and radiative heat fluxes which are imposed as a result of the same overall
heat flux trends between the different thermal functioning points.
To go further in the analysis, it should be noted that from one
operating point to another, the more the positive convective heat
flux increases, the more the absolute value of the negative radiative
heat flux increases. One can assume by extrapolation that if the
convective heat flux was zero, the radiative flux would be too. In this
case, it is the absorbed (positive) convective heat flux on the cold
box side that increases its temperature with respect to its thermal
environment in such a way that the radiative heat emitted is almost
equal to the convective heat absorbed. A thermal equilibrium is thus
created on the cold box side that makes the overall heat flux
remaining almost constant, whatever the thermal operating point.
Note that this balance is largely dependent on the cold box position
in the underhood compartment and does not necessarily appear for
other components that receive heat by convection or absorb heat by
radiation (e.g. the air filter or the cylinder head cover).
4.3.1. Passive control by static deflectors
The passive version of the control uses deflectors positioned
upstream of the components heated by convection. This procedure
in fact optimizes the thermal management of components for one
of the two typical cases of absorbed convective heat described in
Section 4.2, provided that the latter are in the rear part of the
vehicle underhood space. The principle of this version of the
control procedure is illustrated in Fig. 9.
In Fig. 9, the temperature Ta1 of air passing over the hot
component 1 of temperature Th1 greater than temperature Tc of the
cold component increases to a temperature Ta2 above temperature
Tc. Without deflectors, the hot air induces a positive convective heat
flux that increases the cold component’s temperature. The first part
of the static deflector guides a portion of the hot airflow of
temperature Ta2 (greater than Tc) towards the hot component 2 of
temperature Th2 greater than Ta2 and Tc. The second part of the
deflector, on the other hand, directs a second portion of the hot air
stream to the hot component 3 of temperature Th3, also greater
than Ta2 and Tc. Therefore, with the static deflector, one can transfer
convective heat flux absorbed by a cold component as excesses to
the convective heat flux extracted by other components at higher
temperatures. It should be noted that the static deflector can have
one part (or at one inclination) for a single hot component in its
environment, or have more than one part (>2) for many warm
components in its environment.
4.3.2. Active control by dynamic deflectors
The active version of the control involves placing mobile
(dynamic) deflectors upstream of components heated by convection. Looking again at the two typical cases of convective heat
absorption from the previous section, the active control can be used
in two different ways: one in which the deflector is closed during
the transient part of the constant-speed-driving phase and open
during the stabilized part, and another in which deflectors are open
during the transient part and closed during the stabilized phase.
Fig. 10 shows the principle of the first application, “closed-open,”
where 1 and 2 designate respectively the transitional and stabilized
parts of the constant-speed driving phase. Increasing or decreasing
heat flux curves refer to absolute values, not algebraic values.
In the absence of deflectors, the first cold component absorbs
convective heat flux more in the transitional than in the stabilized
period, and the second cold component loses more convective heat
in the stabilized period than in the transitional one. To manage the
Part 1 of the
static deflector
Air, T a2
Hot
Comp. 1
Th1
4.3. Controlling underhood airflow by deflectors
The present section describes a new approach in which static
and mobile deflectors are placed in the underhood compartment in
order to protect certain components from hot air circulation. These
deflectors can also direct warm air passing by low-temperature
components to higher-temperature components for cooling. The
Air
Ta1
Cold
Comp.
Tc
Part 2 of the
static deflector
Hot
Comp. 2
Hot
Comp. 3
Th2
Th3
Fig. 9. Schematic of the static deflector principle.
�M. Khaled et al. / Applied Thermal Engineering 31 (2011) 902e910
Decreasing positive
convective flux
1
2
Decreasing negative
convective flux
1
2
Dynamic deflector
Air, Ta2
Air
Ta1
Hot
Comp. 1
Th1
Hot
Comp. 2
Cold
Comp. 1
Cold
Comp. 2
Tc1
Tc2
Convective fluxmeters
Th2
Fig. 10. Schematic of the functioning principle of a “closed-opened” dynamic deflector,
in the closed position in the transition phase.
thermal situation among the different components of Fig. 10, the
mobile deflector closes during the transition period and opens in
the steady (stabilized) period. In transition, it directs the hot air
stream of temperature Ta2 (which was heated by passing over the
hot component 1 of temperature Th1 greater than Ta1) greater than
Tc1 and Tc2 towards another hot component 2 of temperature Th2
still greater than Tc1, Tc2 and Ta2. At the beginning of stabilization,
the deflector opens to let in the air needed for cooling cold
component 2, which is not now critical for cold component 1. Note
that this application, “closed-open,” can be used only for a cold
component that absorbs convective heat flux (positive) and is
located upstream of other components that themselves evacuate
convective heat flux (negative) increasing in absolute value with
time. The mobile deflector is controlled by two heat flux sensors on
the surfaces of both cold components in front of the air stream.
The principle of the second application, “open-closed,” is shown
in Fig. 11. In the absence of the deflector, the first cold component
receives more convective heat flux in the stabilized phase than in
the transition regime, and the second cold component loses more
convective heat in the transition than in the stabilized regime. To
manage the thermal situation of the different components of Fig. 11,
the mobile deflector opens during the transition phase and closes
during the stabilized phase. In the transition part, the open
deflector allows the passage of the air necessary to cool cold
component 2 even if the first cold component absorbs convective
flux, provided that this latter is very small compared to what is
evacuated by the second cold component.
At the transition phase, the deflector closes in order to deflect the
hot air, which heats the first cold component and is not very efficient
in cooling the second cold component, towards hot component 2 of
temperature above those of the surrounding air and the two cold
components. It should be noted that this “open-closed” application
Fig. 11. Schematic of the functioning principle of an “opened e closed” dynamic
deflector, in the open position in the transition phase.
909
can be used only for a cold component that absorbs increased
convective flux (positive) and is upstream of other components that
themselves lose convective heat flux (negative) decreasing in
absolute value with time.
In conclusion, one can optimize the underhood aerothermal
management without changing the architecture or the position of
vehicle underhood components. The technical interest of this
control procedure resides in the fact that it optimizes the cooling of
underhood components that either are insufficiently cooled or are
heated by convection due to placement in the underhood
compartment. The economic advantages of such optimized underhood aerothermal management (with or without active systems) are
indirect:
- reduction of thermal problems, thus reducing warranty costs
and expenses related to possible emergency fixes;
- better interaction with external aerodynamics: better
management of the underhood airflow reduces the area of air
inlets and thus aerodynamic drag (fuel consumption and
carbon emission issues).
5. Concluding remarks
The present paper gives a physical analysis of particular
underhood aerothermal behaviors, especially convective heat flux
absorption, and presents a new optimization procedure [16] based
on this physical analysis that entails redistribution of cooling
airflow in the vehicle underhood compartment.
During the constant-speed driving phase, for the different
thermal functioning points investigated, typical exponential trends
are observed in the temperature variation of all components, air
zones, and engine parameters. Exponential trends are also found
for the temporal variation of overall, convective, and radiative heat
fluxes for all components investigated. For the overall heat flux
variation (as well as for the convective and radiative parts), two
categories of components are distinguished: category 1, those
components that absorb or lose overall heat fluxes that increase in
absolute value with time, and category 2, those components that
absorb or lose overall heat fluxes that decrease in absolute value
with time.
It has been shown by some examples that outdoor air entering
the underhood compartment to cool it by convection can in fact heat
up some components, such as the cold box, which is a critical
component from a thermal point of view since it contains the car’s
computers. This problem results from the today’s underhood
architecture, specifically the positioning of these components
downstream of and in the same air stream as warmer components.
Passive thermal management can be achieved by placing these
components in areas further upstream or by isolating them from
the hot airflow using deflectors. Note that for decreasing convective
heat flux, it is essentially the early part of the transitional curve that
causes the problem, since the convective heat flux can be as much as
five times its asymptotic value. One can also implement active
control by using mobile deflectors to cut off the airflow towards
the components in the transition period and to let the air pass in the
stabilized heat flux phase. This air can be useful for cooling other
components nearby or downstream that are at higher temperatures.
The deflector can be controlled by convective heat flux sensors.
Finally, a new underhood control procedure is presented in
which static and mobile deflectors are implemented in the car
underhood space in order to protect certain components from hot
air circulation. These deflectors can also direct the warm air passing
over low-temperature components towards higher-temperature
components. The new procedures proposed here are simple and
easy to implement in the car underhood compartment and are
�910
M. Khaled et al. / Applied Thermal Engineering 31 (2011) 902e910
based essentially on the physical analyses of temperature and
separate convective and radiative heat flux measurements. For
example, a dynamic “open-closed” deflector lets air pass over (or
through) two components in the transition phase but closes in the
stabilized phase, when the first component in the airflow absorbs
increasing positive convective flux and the second absorbs
decreasing (in absolute value) negative convective flux.
References
[1] E.P. Weidmann, J. Widemann, T. Binner, H. Reister. Underhood temperature
analysis in case of natural convection, SAE Paper 2005-01-2045; 2005.
[2] E. Fournier, T. Bayne, Underhood temperature measurements of four vehicles.
Motor Vehicle Fire Research Institute, by Biokinetics and Associates, Ltd.,
2004, Report R04e13.
[3] E. Fournier, T. Bayne, Assessment of thermocouple attachment methods for
measuring vehicle exhaust temperature. Motor Vehicle Fire Research Institute, by Biokinetics and Associates, Ltd., 2006, Report R06e23b for MVFRI.
[4] E. Fournier, T. Bayne. Underhood temperature measurements, SAE Paper
2007-01-1393; 2007.
[5] M.R. Jones, D.W. Fletcher. Thermal performance prediction of front-end heatexchange modules, SAE Paper 2001-01-1765; 2001.
[6] N. Francois. Using CFD for heat exchanger development and thermal
management, Valeo Engine Cooling, European Automotive CFD Conference
EACC, Frankfurt, Germany; June 29e302005.
[7] G. Xiao. Investigation of conjugate heat transfer for vehicle underbody, SAE
Paper 2008-01-1819; 2008.
[8] W. Ding, J. Williams, D. Karanth, S.D. Sovani. CFD application in automotive
front-end design, SAE Paper 2006-01-0337; 2006.
[9] F. Fortunato, F. Damiano, L. P. Matteo Oliva. Underhood cooling simulation for
development of new vehicles, SAE Paper 2005-01-2046; 2005.
[10] S. Kini, R. Thoms. Multi-domain meshes for automobile underhood applications, SAE Paper 2009-01-1149.
[11] O. Bailly, X. Baby, E. Fares, H. de Portzamparc. Piv and numerical correlations
on the laguna II underhood flow field, Renault, Congrès de la société des
ingénieurs de l'Automobile SIA, Lyon, France, October 26e27; 2005.
[12] Z. Yang, J. Bozeman, F.Z. Shen, CFD for flow rate and air re-circulation at vehicle
idle conditions. General Motors Corporation, 2004, SAE Paper 2004-01-0053.
[13] Jerhamre A, Jönson A. Development and validation of coolant temperature
and cooling airflow CFD simulations at Volvo cars, Volvo Car Corporation, SAE
Paper 2004-01-0051; 2004.
[14] Weidmann EP, Reister H, Binner T. Experimental and numerical investigations
of thermal soak, SAE Paper 2008-01-0396; 2008.
[15] Hormann T, Lechner B, Puntigam W, Moshammer T, Aimbauer R. Numerical
and experimental investigation of flow and temperature fields around automotive cooling systems, SAE Paper 2005-01-2006; 2005.
[16] Khaled M, Harambat F, Peerhossaini H. “Véhicule Automobile à Ecoulement
d'Air de Refroidissement optimisé”, French patent application filed January
20, Patent no1050365; 2009.
[17] Koller E. Machines thermiques, L'Usine Nouvelle e Série Mécanique et
Matériaux DUONOD.
[18] J.L. Lumley, Engines: An Introduction. Cambridge University Press, 1999.
[19] M. Khaled, F. Harambat, H. Peerhossaini, A quantitative method for the
assessment of car inclination effects on thermal management of the underhood compartment, Journal of Thermal Science and Engineering Applications
014501 (2009) 1e5 ASME 1.
[20] M. Khaled, F. Harambat, H. Peerhossaini, Temperature and heat flux behavior
of complex flows in car underhood compartment, Heat Transfer Engineering
31 (13) (2010) 1e11.
[21] Khaled M, Harambat F, Peerhossaini H. Effects of car inclination on airflow and
aerothermal behavior in the underhood compartment. In: Proceedings of the
ASME Fluids Engineering Conference, July 30eAugust 2, San Diego, CA, USA,
FEDSM2008-55093; 2008.
[22] M. Khaled, F. Harambat, H. Peerhossaini, Underhood thermal management:
temperature and flux measurements and physical analysis, Applied Thermal
Engineering 30 (2010) 590e598.
[23] RC01 radiation/convection (RADCON) Heat flux sensor, HUKSEFLUXÔ
THERMAL SENSORS brochure.
[24] M. Khaled, B. Garnier, F. Harambat, H. Peerhossaini, A new method for
simultaneous measurement of convective and radiative heat flux in car
underhood applications, Measurement Science and Technology Journal 21
(2010) 025903 (10 pp).
[25] M. Khaled, F. Harambat. Dispositif de Mesure de Flux Thermique et Méthode
de Séparation des Flux Radiatif et Convectif, French patent application filed on
February 10, Patent no 0950799; 2009.
�
 Mahmoud Khaled