ISOLATION, PURIFICATION AND
CHARACTERIZATION OF
ACID PHOSPHATASES FROM ROHU (LABAEO
ROHITA) FISH LIVER
BY
AISHA SIDDIQUA
Ph.D. Thesis
DEPARTMENT OF CHEMISTRY
GOMAL UNIVERSITY
DERA ISMAIL KHAN
2012
ISOLATION, PURIFICATION AND CHARACTERIZATION OF
HIGH MOLECULAR WEIGHT ACID PHOSPHATASES FROM
ROHU (LABAEO ROHITA) FISH LIVER
A DISSERTATION
Submitted to the Department of Chemistry, Gomal University, D.I. Khan
in partial fulfillment of requirement for the Degree of
DOCTOR OF PHILOSOPHY
IN
BIOCHEMISTRY
Submitted
By
AISHA SIDDIQUA
Supervisor
Chairman
External Examiner
Dean of Sciences
.
DEPARTMENT OF CHEMISTRY
GOMAL UNIVERSITY
DERA ISMAIL KHAN
CERTIFICATE
This to certify that
completed
research
Ms. Aisha Siddiqua, a Ph.D. scholar has successfully
work
on
“ISOLATION,
PURIFICATION
AND
CHARACTERIZATION OF ACID PHOSPHATASES FROM ROHU (LABAEO
ROHITA) FISH LIVER”
This thesis is accepted in its present form by the Department of Chemistry, Gomal
University, D. I. Khan, as satisfying the requirement for the degree of Ph.D. in Chemistry
(Biochemistry)
Prof. Dr. Ahmad Saeed
Research Supervisor
University of Science and Technology,
Bannu.
Prof. Dr Azim Khan khattak
Chairman.
Department of chemistry,
Gomal University,
D.I.Khan.
Prof. Dr. Saeed Ahmad Nagra
External Examiner.
Prof. Dr. Mussa Kaleem Baloch
Dean of Sciences
Gomal University,
D.I.Khan.
ACKNOWLEDGEMENTS
First of All I bow down my head to the Omnipotent and Omnipresent AL- MIGHTY
ALLAH for blessing me with health , knowledge , wisdom and guidance in my entire
research
work
and
all
respect
for
the
HOLY
PROPHET
HAZART
MUHAMMAD(PBUH) for enlightening our conscious with essence of faith in ALLAH,
covering all his kindness and mercy upon him.
I have a depth of heartiest regard to my research supervisor Prof. Dr. Ahmad Saeed for
his kind supervision, sympathetic attitude, guidance through out my research work
and in the preparation of this thesis.
I would like to offer my sincere thanks to Prof Dr, Azim Khan Khattak, Chairman
Department of Chemistry, for providing laboratory facilities.
I would also like to my sincere thanks to Dr. Rubina Naz to help in my research work.
I am also grateful to Mr., Muhammad Tufail, Lab, Assistant, who helped me in
handling various instrument, Chromatographic technique and for technical help in
completion of various experiments.
My special thanks to my parents and my husband for providing me moral support and
pleasant behavior.
Finally, I greatly acknowledge the support of Higher Education Commission indigenous
5000 Ph.D Fellowship Program Batch II, No.17-5-2 (PS 2-120)/HEC/Sch/2004 which
enabled me to complete my research work.
AISHA SIDDIQUA
DEDICATED TO MY
DEAR PARENTS
&
MY FAMILY
CONTENTS
1
List of tables
List of figures
Principle Abbreviations
Introduction
1.1
Enzyme
1.2
Introduction
1.3
Acid phosphatase purification
2 Method and Materials
2.1
Material
2.2
Enzyme assay
2.3
Protein determination
2.4
Polyacrylamide gel electrophoresis
2.4.1. SDS- Polyacrylamide gel electrophoresis
3
Purification of acid phosphatase
3.1
Extraction
3.2 Fractionation with (NH4)2SO4
3.3
Result
4
Purification of high molecular weight acid phosphatases (HM-ACP)
4.1
Scheme I
4.1.1 Extraction
41.2 Fractionation with 30% (NH4)2SO4 saturation
4.1.3 Fractionation with 60% (NH4)2SO4 saturation
4.1.4 Dialysis
4.1.5 Cation exchange Chromatography on
SP-Sephadex C-50
4.1.6 Gel filtration on Sephadex G-100
4.1.7 Cation exchange chromatography on
CM-Cellulose
4.1.8 Result
4.2 Scheme II
Result
4.3 Scheme III
Result
4.4 Scheme IV
Result
4.5 Scheme V
4.5.1 Extraction
4.5.2 Ammonium sulphate fractionation
4.5.3 SP-Sephadex C-50 chromatography
4.5.4 CM-Cellulose chromatography
i
iii
v
viii
1
4
7
11
11
13
13
13
18
18
18
23
23
23
23
23
23
24
24
24
32
33
37
38
38
43
49
50
50
50
52
4.5.4.1 Purification of enzyme (100 kDa) from
unbound fraction of CM-Cellulose
chromatography
Ultrogel ACA-44 chromatography
Concanavalin-A 4B chromatography
Result
4.5.4.1 Purification of enzyme (130 kDa) from
bound fraction of CM-Cellulose
chromatography
Sephacry HR-200 chromatography
Result
5 Characterization of HM-ACP (100 kDa and 130 kDa)
5.1 pH Optima
5.2
pH Stability
5.3 Temperature Optima
5.4 Temperature Stability
5.5 Thermal inactivation of the enzyme
5.6 Effect of modifiers on the enzyme activity
5.7 Effect of metal ions
5.8 Determination of kinetic parameters
5.9 Substrate Specificity
5.10 Determination of Ki values
6 Purification of low molecular weight acid phosphatases (LM-ACP)
6.1 Gel filtration on Sephadex G-75
6.2 Affinity chromatography on p-aminobenzylphosphonic
acid-agarose gel
6.3 Result
7 Characterization of LM-ACP (18 kDa)
7.1
7.2
7.3
7.4
7.5
7.6
7.7
Physiochemical characteristics
Determination of kinetic parameters
Effect of modifiers on the enzyme activity
Effect of metal ions
Substrate Specificity
Determination of Ki values
Effect of purine and pyrimidine bases
54
54
54
54
59
59
59
65
65
65
72
72
72
79
79
79
84
97
97
97
104
104
104
108
108
111
111
8 Discussion
115
9 Summary
123
10
126
References
11 List of publications from research work
ii
132
LIST OF TABLES
Table 1: Total acid phosphatase activity in fish liver
20
Table 2: Low molecular weight acid phosphatase activity in fish liver
21
Table 3: Purification of HM-ACP from fish liver. ( Scheme I)
25
Table 4: Purification of HM-ACP from fish liver. (Scheme II)
34
Table 5: Purification of HM-ACP from fish liver. ( Scheme III)
39
Table 6: Purification of HM-ACP from fish liver. ( Scheme IV)
44
Table 7: Purification of HM-ACP (100 kDa) from fish liver. (Scheme V)
55
Table 8: Purification of HM-ACP (130 kDa) from fish liver. (Scheme V)
60
Table 9: Some physicochemical characteristics of acid phosphatases from fish Liver
75
Table 10: Effect of various modifiers on the high molecular weight acid
Phosphatase from fish liver.
78
Table 11: Effect of different metal ions on activity of high molecular
weight acid phosphatases from fish liver.
80
Table 12:
Determination of Kinetic parameters
81
Table 13:
Substrate specificity of high molecular weight acid phosphatase
85
from fish liver.
Table 14: Kinetic constants of high molecular weight acid phosphatase
86
from fish liver.
Table 15: Purification of LM-ACP (18 kDa) from fish liver. (Scheme V)
98
Table 16: Some physicochemical characteristics of low molecular weight acid
phosphatase from fish Liver
105
Table 17:
106
Determination of kinetic parameters
iii
Table 18:
Effect of various modifiers on the low molecular weight acid
phosphatase from fish liver.
107
Table 19:
Effect of different metal ions on activity of low molecular
weight acid phosphatases from fish liver.
109
Table 20:
Substrate specificity of low molecular weight acid phosphatase
110
from fish liver.
Table 21: Kinetic constants of low molecular weight acid phosphatase
112
from fish liver.
Table. 22 Effect of purine and pyrimidine compounds on the low molecular
weight acid phosphatase from fish liver.
iv
113
LIST OF FIGURES
Fig. 1
Gel chromatography on Sephadex G-75
22
Fig. 2
Elution profile from Sephadex G-100 (Scheme I)
26
Fig. 3
Elution profile from CM-Cellulose chromatography (Scheme I)
27
Fig. 4
SDS-Polyacrylamide gel electrophoresis of 100kDa isoenzyme
29
Fig. 5
Linear graph of log molecular weight versus elution volumes of standard
proteins.
30
Fig. 6 SDS-polyacrylamide gel electrophoresis of HM-ACP enzyme.
31
Fig. 7
Elution profile from Tris Acryl chromatography (Scheme II)
35
Fig. 8
Elution profile from CM-Cellulose chromatography (Scheme II)
36
Fig. 9
Elution profile from CM-Cellulose chromatography (Scheme III)
40
Fig. 10
Elution profile from DEAE-52 chromatography (Scheme III)
41
Fig. 11
Elution profile from CM-Cellulose chromatography (Scheme IV)
45
Fig. 12
Elution profile from Sephadex G-100 (Scheme IV)
46
Fig. 13
Elution profile from Reactive Blue chromatography (Scheme IV)
48
Fig. 14
SDS-polyacrylamide gel electrophoresis of HM-ACP enzyme.
50
Fig. 15
Elution profile from SP-Sephadex C-50 chromatography (Scheme V)
49
Fig. 16
Elution profile from CM-Cellulose chromatography (Scheme V)
53
Fig. 17
UltrogelACA-44 chromatography (Scheme V)
56
Fig. 18
Concanavoline-A 4-B chromatography (Scheme V)
57
Fig. 19
SDS-polyacrylamide gel electrophoresis of HM-ACP enzyme (100 kDa) 60
Fig. 20
Sephacryl HR-200 chromatography (Scheme V)
v
63
Fig. 21
SDS-polyacrylamide gel electrophoresis of HM-ACP enzyme (130 kDa). 64
Fig. 22
Polyacrylamide gel electrophoresis of native enzyme (130 kDa).
65
Fig. 23 Linear graph of log molecular weight versus elution volumes of standard
proteins.
66
Fig. 24
Optimum pH of 100 kDa acid phosphatase isoenzyme
68
Fig. 25
Optimum pH of 130 kDa acid phosphatase isoenzyme
69
Fig. 26
pH stability of 100 kDa acid phosphatase isoenzyme
70
Fig. 27
pH stability of 130 kDa acid phosphatase isoenzyme
71
Fig. 28
Optimum temperature of 100 kDa acid phosphatase isoenzyme
72
Fig. 29
Optimum temperature of 130 kDa acid phosphatase isoenzyme
73
Fig. 30
Temperature stability of 100 kDa acid phosphatase isoenzyme.
75
Fig. 31
Temperature stability of 130 kDa acid phosphatase isoenzyme.
76
Fig. 32
Thermal inactivation of 100 kDa acid phosphatase isoenzyme.
78
Fig. 33
Thermal inactivation of 130 kDa acid phosphatase isoenzyme.
79
Fig. 34
Determination of Km and Vmax value of 100 kDa isoenzyme
84
Fig. 35
Determination of Km and Vmax value of 130 kDa isoenzyme
85
Fig. 36 Competitive inhibition of 100 kDa fish liver acid phosphatase by
Na3PO4. Lineweaver-Burk plots of 1/v versus 1/S.
89
Fig. 37 Competitive inhibition of 100 kDa fish liver acid phosphatase by
NaVO3.Lineweaver-Burk plots of 1/v versus 1/S.
90
Fig. 38 Competitive inhibition of 100 kDa fish liver acid phosphatase by
NaMoO4 Lineweaver- Burk plots of 1/v versus 1/S.
91
Fig. 39 Competitive inhibition of 100 kDa fish liver acid phosphatase by
NaF. Lineweaver-Burk plots of 1/v versus 1/S.
92
Fig. 40
93
Competitive inhibition of 130 kDa fish liver acid phosphatase by
Na3PO4 Lineweaver-Burk plots of 1/v versus 1/S.
vi
Fig. 41
Competitive inhibition of 130 kDa fish liver acid phosphatase by
Na3VO3 Lineweaver-Burk plots of 1/v versus 1/S.
94
Fig. 42
Competitive inhibition of 130 kDa fish liver acid phosphatase by
Na3MoO4 Lineweaver- Burk plots of 1/v versus 1/S.
95
Fig. 43
Competitive inhibition of 130 kDa fish liver acid phosphatase by
NaF. Lineweaver-Burk plots of 1/v versus 1/S.
96
Fig. 44
Competitive inhibition of 130 kDa fish liver acid phosphatase by.
Na-tartrate. Lineweaver- Burk plots of 1/v versus 1/S.
97
Fig. 45
Competitive inhibition of 130 kDa acid phosphatase by pyridoxal -5/phosphate. Lineweaver - Burk plots of 1/v versus 1/S.
98
Fig. 46
Elution profile from a Sephadex G-75. column (Scheme V)
101
Fig. 47
Affinity chromatography on p-aminobenzyl phosphonic acid –
agrarose column (Scheme V)
102
Fig. 48
SDS-Polyacrylamide gel electrophoresis of LM-ACP peak 1 and peak 2
Isoenzymes
104
Fig. 49
Iinear graph of log molecular weight versus elution volumes of standard
proteins
105
vii
PRINCIPLE ABBREVATIONS
ε
Molar extinction coefficient
SDS
Sodium dodecyl sulphate
ΔAx
Change of absorption at x nm
Tris
Tris-(hydroxyl methyl)-amino methane
Ki
Inhibitor constant
Km
Michealis – Menten constant
mA
Milliampere
PAGE
Polyacrylamide gel electrophoresis
TEMED
N/, N/, N/, N/ - tetramethyl ethylene diamine
Bis
N/, N/ - Bis-methylene acryamide
EDTA
Ethylenediamine tetra acetate
PMSF
Phenyl methyl sulphonyl fluoride
rpm
Revolution per minute
kDa
Kilodalton
DEAE-
Diethylamino ethyl –
CM-
Carboxy methyl -
U
Unit
U/ml
Unit per milliliter
Con A
Concanavalin A
g
Gravitational constant
Mr
Molecular weight
LMW-ACP
Low molecular weight acid phosphatase
HMW-ACP
High molecular weight acid phosphatase
hPAP
Human prostatic acid phosphatase
EC
Enzyme Commision
PTPase
Phosphotyrosine protein phosphatase
nm
Nanometer
ΔA 405
Change of absorption at 405 nm
ΔA700
Change of absorption at 700 nm
ΔA546
Change of absorption at 546 nm
viii
ΔA280
Change of absorption at 280 nm
Psi
Per square inch
min.
Minutes
h
Hour
PAPs
Purple acid phosphatases
M
Molar
µl
Micro liter
Gel mix.
Gel mixture
mM
millimole
TCA
Tetrachloro acetate
pNPP
Para nitro phenyl phosphate
ATP
Adenosine triphosphate
AMP
Adenosine monophosphate
UMP
Uracil monophosphate
ix
1.1 ENZYMES:
The most important group of proteins exhibiting biological activity is the enzymes.
These proteins are catalysts responsible for catalyzing the biological reactions. They
differ from man made catalyst in that the ordinary catalyst catalyzes a large number of
reactions but enzyme catalyzes only few reactions, more frequently only one. So the
enzymes are specific in nature i.e. each enzyme catalyzes only one reaction. Thus they
are among the most remarkable biomolecules known because of their extra ordinary
specificity and catalytic power which is far greater than man made catalyst.
For example one molecule of enzyme is able to decompose 5,000,000 molecules of H2O2
per minute in the following way:
2H2O2
————→ 2H2O + O2
Much of the history of the biochemistry is the history of enzyme research. Name
enzyme was not used until 1877 but earlier it was suspected that some biological catalysts
are involved in the fermentation of sugar to form alcohol (hence earlier name ferments).
In 1926 J. B. Sumner isolated first enzyme “Urease” from jack bean in pure crystalline
form. He presented evidence that crystals are protein and concluded that enzymes are
proteins. His views were not immediately accepted. However when J. Northrop in 1936
crystallized enzymes pepsin, trypsin and chymotrypsin, the protein nature of enzyme was
firmly established.
Today more than 2000 different enzymes are known. Most of them have been isolated in
pure form. About 200 have been crystallized.
There are six main classes of enzymes; each one is further divided into subclasses. The
main classes are the following.
1
1.
Protein Oxidoreductases.
2. Transferases.
3.
Hydrolyses.
4. Lyases.
5.
Isomerases.
6.
Ligase.
Each enzyme has systematic code number. The number characterizes the type of
reaction. The number consists of four digits.
First digit-
represents class
Second digit-
represents subclass which is on the basis of group of substrate
attacked.
Third digit-
represents subclass into subclass which is based on cofactor
involved.
Fourth digit-
represents particular enzyme name (Trival name) which is based
on the name of particular substrate attacked.
e.g. 2.7.1.1. shows class 2 (transferase), subclass-7 (transfer of PO4 from ATP),
subclass-1 (an alcohol function as PO4 acceptor), final digit-1 (denotes the enzyme,
hexose kinase), an enzyme catalyzing the transfer of PO4 group from ATP to OH
group of glucose.
OR
“ATP D hexose 6-phosphate transferase”.
The reaction is as under:
Hexose + ATP ————→ Hexose-6-PO4 + ATP
2
Some enzymes beside its protein part contain non protein component, which is
essential for their activity. The protein part is usually called apoenzymes while nonprotein component, which is tightly bound to apoenzyme, is called prosthetic group. If
the prosthetic is not tightly bound to apoenzyme, it is called coenzyme. The combination
of apoenzyme and coenzyme is called holoenzyme. Coenzyme frequently contains
vitamins B complex as part of their structure. The B vitamins, nicotinamide, thiamine,
riboflavin, folic acid, pantothenic acid and lipoic acid are the important constituents of
coenzymes. Many pure enzymes (alcohol dehydrogenase, catalase and xanthin oxidase)
contain a low, reproducible number of tightly bound metal ions per molecule of protein.
Removal of such metal ions often results in partial or total loss of enzymatic activity.
Apart from these, certain enzymes require metal ions e.g. Mg++, Ca++, Cu++
and Mn++ etc for full activity. These ions are called positive modifier or activators
(cofactors), which increase the rate of the reactions. There are certain compounds, which
decrease the rate of the enzyme-catalyzed reaction. Such compounds are usually organic
in nature and are called negative modifiers or inhibitors. Some times metal ions may also
act as negative modifiers e.g. mercury and arsenic etc inhibit many enzyme reactions.
Anions may also affect enzyme actions. Saliva for example contains chloride ions. If
these are removed by some means, the amylase that is present loses it splitting action on
starch and glycogen. Splitting action of enzyme is restored by the addition of small
amounts of sodium chloride. In the same manner, cyanide ion inhibits many iron
containing enzymes. Thus poisonous properties of cyanide are due to its inhibition of
cytochrom oxidase, which is essential for all mammalian cells.
3
1.2 INTRODUCTION:
Acid phosphatases (3.1.3.2) catalyze the hydrolysis of phosphate esters with the
release of phosphate (Vincent et al., 1992) and exhibits pH optima values below 6.0
(Yam, 1974). These are present in variety of plants, animal tissues and microorganisms
(Jing et al., 2006; Garcia et al., 2004). The biological role of acid phosphatase is not clear
but it may be involved in many biological systems which are linked to energy metabolism
of phosphorylated compounds, metabolic regulation and cellular signal transduction
pathways (Shan, 2002; Kostrewa et al., 1999).
Four forms of acid phosphatases exist at structural level of genes, the
erythrocytic form, lysosomal, prostatic and macrophagic form (Moss et al., 1995) which
are expressed in the cells to different extent. The erythrocytic and macrophagic forms are
distinguished from the prostatic and lysosomal enzymes in resisting inhibition by Ltartrate (Asma Saeed et al., 2007).
Acid phosphatases occur in multiple forms differing in molecular weight,
localization within cells, substrate specially, sensitivity to activators or inhibitors, pl
value and carbohydrate content (Fuijimoto et al., 1984; Zhou et al., 2003). The presence
of multiple forms associated with various tissues and also with different organelles
suggests that these enzymes are involved at various metabolic levels.
Mammalian tissues contain two acid phosphatase forms, high molecular weight
acid phosphatase (90-200 kDa) and low molecular weight acid phosphatase (14-30 kDa).
These can be distinguished from each other by localization in cell. The effect of inhibitors,
substrate specificity and kinetic parameters also distinguish these enzymes (Baldijao et al.,
1975; Saini and Van Etten, 1978; Taga and Van Etten, 1982).High molecular weight acid
4
phosphatases are particulate enzymes. these are found in lysosomes and microsomes (Di
Pietro and Zengerle, 1967; Helwig et al., 1978) whilelow
molecular weight acid
phosphatases are present in cytolplasm (Baxter and Suelter, 1974). High molecular weight
acid phosphatases catalyze the large variety of substrates while low molecular weight acid
phosphatases catalyze very few substrates (De Araujo et al., 1976). These enzymes do not
equire metal ions for activity (Fujimoto et al., 1993).
An other class of acid phosphatases which requires Zn++ ion for their catalytic
activity is called Zn++ -dependent acid phosphatases. These have been detected in several
animal tissues and species (Tsuda et al., 1998) and exit in two major forms, the difference
being based on molecular size and tissue distribution (Caselli et al., 1996). High molecular
weight Zn++ - dependent acid phosphatases (Mr 100-120 kDa) is found in liver and kidney
while low molecular weight Zn++ -dependent acid phosphatases enzyme (Mr 57-62 kDa) is
present in brain, heart, skeletal muscles and erythrocytes and possesses Mg++- dependent
myo-inositol-1-phosphateses activity. Therefore this enzyme may play a role in
phosphatidyl inositol cell signaling system and is a putative target of lithium therapy in
manic depression (Caselli et al., 2007; Kim et al., 2005).
There is an other way to classify acid phosphatases. based on reaction
mechanism, it is classified as (1) histidine phosphatases which include human prostate
acid phosphatases and some other phosphatases (Van Etten, 1982), (2) serine
phosphatases which involve serine as an active site amino acid (Schwartz and Lipmann,
1961), (3) cystein phosphatases which include protein tyrosin phosphatases and low
molecular weight acid phosphatases (Wo et al., 1992; Ostanin et al., 1994).
5
Purple acid phosphatases are infact metaloproteins containing iron and zinc in
the region of active site. Some enzymes contain manganese also in that region. Purple
colour of the enzyme is due to charge transfer band at ≈560nm. They have been reported
in bovin spleen (Merks and Averill, 1998), soyabean seedlinds (Fujimoto et al., 1976),
spinach leaves (Fujimoto et al., 1977), rice cultured cells (Igaue et al., 1976), arabidopsis
thaliana (Patel et al., 1996), sweet potato (Uehara et al., 1974), walls of tobacco cells
(Kaida et al., 2008). Purple acid phosphatases have been found to contain molecular
weight in the range of 35-110 kDa and are glycoprotein in nature. X-rays study shows
FeIII – ZnII center constituting a part of active site of the enzyme (Beck et al., 1986).
These metaloenzymes have optimal pH 4-7 and are insensitive to inhibition by tartrate.
Purification and few physical properties of sweet potato purple acid phosphatases
had been reported earlier (Uehara et al., 1974; Sugiura et al., 1981) in which Mncontaining acid phosphatases had been purified and crystallized. The ptimal pH was 5.8
and enzyme was sensitive towards the inhibition by Cu++ , Zn++, Hg++ , AsO4-3 and MoO4 2
. Durmas et al., 1999 rectified controversy and identified as FeIII - Zn II center in active
site of sweet potatoes PAP as found for red kidney bean enzyme.
Alkaline phosphatases are present in bone, liver and other tissues. They are
membrane bound and are metaloprotein and glycoprotein in nature. They have molecular
weight in range of 130-140 kDa. These enzymes require Zn++ and Mg++ for enzymatic
activity (Ciacaglini et al., 1990).
Protein phosphatases act on phosphoproteins and dephosphorylate it. These are
divided into three groups: non-specific protein phosphatases, phosphoserine/ threonine
protein phosphatases and phosphotyrosine protein phosphatases (Ramponi and Stafani,
6
1997). Protein phosphatases are involved in various metabolic processes, signal
transduction and cellular growth (Yarden and Ullrich, 1988; Hunter, 1995; Bishop,
1991).
1.3 ACID PHOSPHATASE PURIFICATION:
Saini and Van Etten (1978) purified acid phosphatases from human liver 4500-fold to
homogeneity. The purification procedure consisted of salt precipitation, acid treatment,
CM-Cellulose and DEAE-Cellulose chromatography, gel filtration on Sephacryl S-200
column, followed by Concanavalin A-Sepharose 4B affinity chromatography. The purified
enzyme was found glycoprotein. The PAGE showed single protein band. The native
enzyme had molecular weight of 93,000 as revealed by gel filtration. In SDS-PAGE, band
corresponding to molecular weigh of 50,000-53,000 was obtained indicating dimeric nature
of the enzyme.
Helwing et al., (1978) purified acid phosphatase 400-fold from rabbit kidney cortex by
SP-Sephadex C-50, DEAE-Cellulose and Concanavalin A-Sepharose chromatography to
specific activity of 12000 U/mg of protein. The enzyme was found homogeneous and
migrated as single band on PAGE. The molecular weight was estimated to be 64,000 by
SDS-PAGE. Ultracentrifugation on a continuous glycerol gradient indicated a molecular
weight of 101,000 and probably composed of two subunits of approximately the same
size.
Rat liver acid phosphatase was purified in crystalline form to specific activity of 18
µmol substrate hydrolyzed/min/mg of protein. An 890-fold purification was obtained
with the recovery of 20% (Igarshi and Hollander, 1968). Purification method was based
on salt fractionation, Sephadex G-75, DEAE-Cellulose and hydroxyl apatite column
7
chromatography. The crystalline enzyme had molecular weight of 100,000 on PAGE.
The same molecular weight was obtained by sucrose density gradient centrifugation.
Human prostatic acid phosphatase (hPAP) is present in the prostate gland and its
secretion. Lysosomal and secretory acid phosphatases both have been demonstrated in
prostatic cells. The hPAP was purified to homogeneity (Saini and Van Etten, 1977). The
method include the steps of homogenization in solution containing Tween 80 and EDTA
(to reduce autolysis and degradation during extraction), salt fractionation with (NH4)2SO4
from 0-50% and 50-70% saturation followed by chromatography on Concanavalin ASepharose which represented a considerable simplification over earlier methods
(Ostrowski, 1968). The yield of the enzyme was 11% with specific activity of 240
µmol/min/mg of protein. An improved purification procedure was developed which was
simple, rapid and efficient (Saini and Van Etten, 1978) involving the use of single step
affinity column chromatography on Sepharose 4B-L-tartaric acid amide. The enzyme was
purified to specific activity of 260-300 µmol/min/mg which is greater than obtained by
above method (Saini and Van Etten, 1977). The recovery of the enzyme (72%) was also
greater than that of previous method. Estimation of the molecular weight of hPAP by a
number of methods had yielded a range of values from 96,000-130,000. Gel filtration
studies found a molecular weight of 109,000 (Vihko et al., 1978). Sucrose density
gradient ultracentrifugation studies found a value of 96,000 (Ostrowski, 1968). The most
careful determination of molecular weight is the sedimentation-equilibrium measurement
which gave 102,000 (Derechin et al., 1971). SDS-PAGE yielded molecular mass subunits
of 50,000 indicating dimeric nature of the enzyme (Wasyl and Ostrowski, 1974).
8
Lin et al., 1983 isolated enzyme from human seminal plasma by series of
chromatography which include chromatography on Concanavalin A-Sepharose, anion
exchange DEAE-Cellulose and repeated Sephadex G-100 chromatography. The
homogenous enzyme had molecular weight 120,000 as estimated by gel filtration and
possessed two subunits of molecular weight 55,000 each revealed by SDS-PAGE. This
enzyme was designated as prostatic acid phosphatase II (PAP-II), differentiated from
conventional prostatic acid phosphatase (PAP) designated as PAP-I which was isolated
from the same source and had molecular weight 100,000 and subunit mass of 50,000.
Magboul and Mc Sweeney (2000) purified acid phosphatase to homogeneity from
lactobacillus curvature DPC2024 by DEAE-Sephacel, phenyl Sepharose, chelating
Sepharose Fast flow and Mono Q chromatography. The purified enzyme was a tetramer
with a subunit molecular weight of 26,000 by SDS-PAGE and gel filtration. The
molecular mass of native enzyme was 104,000 as determined on PAGE.
Two isoenzymes (Acpase I and II) of acid phosphatase were separated and purified
from viscera of pearl oyster, P.fucata (Jing et al., 2006) to homogeneity by
chromatography on DEAE-Sepharose Fast flow, Sephadex G-200 superfine and
Concanavalin A-Sepharose 4B. SDS-PAGE of Acpase I and II showed single band. The
subunit molecular masses were 208,800 and 29,800. Acpase I was a single polypeptide
chain while Acpase II was dimeric composed of two equivalent subunits. The molecular
weights of native enzymes determined on a calibrated Sephadex G-200 column gave
molecular weight 197,100 and 64,300 respectively.
An efficient procedure for purification was developed for the molecular form of
epididymal acid phosphatase from boar seminal plasma by Wysocki and Strezezek
9
(2006). Methods consisting of dialysis, fast performance liquid chromatography (FPLC)
using DEAE. Sepharose Fast flow column and affinity chromatography on chelating
Sepharose Fast flow gel with immobilized Zn++-ions and hydroxyl apatite
chromatography, gave around 7000-fold purification with yield of 50%. The enzyme
obtained was homogeneous on SDS-PAGE. The native enzyme of molecular weight of
100,000 consisted of two subunits, each with molecular mass of 50,000 as determined by
SDS-PAGE. The enzyme was thermostable, glycoprotein with pI value of 7.1.
Garcia et al., 2004 described the purification of acid phosphatase from entamoebe
histolytica HM-1:1 MSS through Triton X-100 solubilization. The enzyme was purified
by Concanavalin A-Sepharose column affinity chromatography and DEAE-Cellulose
chromatography. The overall purification was 23-fold with very low yield (2.26%). The
molecular weight of the native enzyme was from 55,000 to 57,000.
An acid phosphatase from the aquatic plant Spirodela Oligorriza (duck weed) was
purified by Fast Protein Liquid chromatography. The enzyme was purified 1871-fold
with recovery of 40%. SDS-PAGE resolved single protein band corresponding to 66,000.
PAGE of native protein revealed protein band of molecular mass of 120,000. Gel
filtration experiment estimated a molecular weight of native enzyme to be 120,000. Thus
this acid phosphatase functions as homodimer, consisting of two similar 60,000 subunits.
10
2.1. Materials:
Labaeo rohita (common name Rohu) was captured from Indus river (N.W.F.P.
Pakistan) and liver was excised immediately and stored at 4˚C for use.
SP-Sephadex C-50, Sephadex G-100, Sephacryl HR-200, SP-Tris acryl, pNPP, αnaphthyl phosphate, β-glycerol phosphate, β-naphthyl phosphate, flavinmononucleotide
phosphate (FMN), phenyl phosphate, bovine serum albumin, SDS molecular weight
markers were purchased from Merck, Sigma Chemical Co. & Fluka Chemical Co., CMCellulose from Whatman Biosystem:, the material for polyacrylamide gel-electrophoresis
were purchased from Acros Chemical Co. All other chemicals were of highest purity
analytical grade.
2.2. Enzyme Assay:
Acid phosphatase activity was determined at 37ºC in 1ml of 0.1 M acetate
buffer, pH 5.5 and 4 mM pNPP as described by Ramponi et al., 1989. The reaction was
started by addition of the small amount of enzyme solution and was terminated by the
addition of 4 ml of 0.1 M KOH. The absorbance was measured at
405 nm. The
nonenzymatic hydrolysis of p-nitrophenyl phosphate was corrected by measuring the
control without added enzyme. To correct absorption due to colour of crude extracts, a
control was employed in which KOH was added prior to the addition of enzyme.
The Zn++- dependent acid phosphatase activity was determined as described by
Panara (1997) or by the method of Panara et al., (1992) at 37ºC using 4 mM pNPP as a
substrate in 125 mM acetate buffer, pH 6.0, containing 5 mM ZnCl2 and 10 mM NaF and
50 -100 µl of enzyme solution in final volume of 1ml. After 5 min. of incubation, the
11
reaction was stopped by the addition of 1 ml of 0.1 M KOH and the absorbance was
measured at 405 nm (ε = 1.8 x 10⁴ M-1cm-1).
One unit of activity is defined as the amount of enzyme that is required to produce
1 mol of p-nitrophenol product from its substrate per minute ( = 1.8 x 10⁴ M -1 cm -1).
The specific activity is defined as number of enzyme units per milligram of protein.
pH-activity curve, obtained in the pH range 3.4 - 9.0; temperature optima,
determined at 5ºC intervals from 0 - 70ºC; effect of metal ions and modifiers were
assayed as described above.
The enzyme activity against other phosphomonoesters was determined under
above conditions by estimation of inorganic phosphate (Pi). The enzymic reaction was
quenched by the addition of 0.2 ml of 10% trichloroacetic acid. The liberated Pi was
determined according to Black and Jones method (1983).
Reagents:
(A) 2% ammonium molybdate.
(B) 14% L (+) Ascorbic acid in 50% trichloroacetic acid.
(C) 2% trisodium citrate, 2% sodium arsenite in 2% (v:v) acetic
acid.
Solution B is maintained at 0 - 4ºC and is stable for one day. Other
reagents are stable for months.
Procedure:
To 0.5 ml enzyme assay mixture, 0.2 ml 10% TCA was added to quench
the reaction. 0.5 ml of A+B mixture (0.2 ml A + 0.3 ml B) was added and vortexed. After
5 min, it was followed by the addition of 1ml C solution and vortexed. The colour
developed after 5 min was measured at 700 nm.
12
2.3. Protein Determination:
Protein concentration was determined by the Biuret method according to Beisenherz
et al., (1953). To 100 l of protein sample was added 900 l of distilled water followed
by the addition of 170 l of 50% trichloroacetic acid to precipitate the protein which was
spun down by centrifugation at 10,000 rpm for 4 – 5 min. The supernatant was discarded
and the precipitate was dissolved in 1.25 ml Biuret reagent (composed of 0.9% sodiumpotassium tartrate, 0.3% CuSO4. 5H2O and 0.5% KI in 0.2 N NaOH). The content was
mixed by vortex and added 1.25 ml water. The violet colour was developed for 10 min
and the absorption at 546 nm was measured on spectrophotometer. The standard curve
was constructed using bovine serum albumin (BSA) as a standard. In column effluents,
the relative protein concentration was estimated by the absorbance at 280 nm.
2.4. Polyacrylamide gel electrophoresis
2.4.1. SDS- Polyacrylamide gel electrophoresis:
SDS-PAGE was carried out according to the Laemmli (1953) under reduced and nonreduced conditions.
Sodium dodecyl sulphate (SDS) is an anionic detergent which denatures proteins by
“wrapping around” the polypeptide backbone and SDS binds to proteins fairly
specifically in mass ratio of 1:4. In doing so SDS confers a negative charge to the
polypeptide in proportion to its length i.e. the denatured polypeptide becomes rod of
negative charge cloud with equal charge or charge densities per unit length. It is usually
necessary to reduce disulphide bridge in protein using β-mercaptoethanol or dithiothreitol
before they adopt the random-coil configuration necessary for separation by size. Thus in
13
denaturing SDS-PAGE separations, migration is determined not only by intrinsic
electrical charge of polypeptide but also by molecular weight (Sambrook et al., 1989).
Sample preparation for electrophoresis:
20 l enzyme (45 – 70 g total protein) was dialyzed against distilled water and mixed
with 80 l sample buffer and heated in boiling water bath for 5 min, cooled, centrifuged
and loaded in a single lane of polyacrylamide gel. The composition of sample buffer or
loading buffer is outlined: 4.0 ml of distilled water, 1.0 ml of 0.5 M Tris-HCl, pH 6.8,
0.8 ml of glycerol, 1.6 ml of 10 % SDS, 0.4 ml of -mercaptoethanol and 0.2 ml of
0.05% bromophenol.
Solutions required for resolving gel, stacking gel and 5X electrode buffer pH 8.3 were the
following:
1. Acrylamide/Bis (30% Stock): 29.2 g acrylamide, 0.8 g N’, N’-Bis-methyleneacrylamide, make the volume to 100 ml; 1.5 M Tris-HCl buffer, pH 8.8; 0.5
M Tris-HCl buffer, pH 6.8; 10 % SDS; 10% ammonium persulphate.
2. 5X Electrode (Running) buffer, pH 8.3 : 9 g Tris base, 43.2 g Glycine, 3 g
SDS and 600 ml water. (Dilute 60 ml 5X Electrode buffer with 240 ml
distilled water before use)
3. Stainer solution: 0.1% Coomassie blue R-250 in fixative (40% methanol, 10%
acetic acid).
4. Destainer solution: 40% methanol, 10% acetic acid.
Preparation of Gel mix:
Composition of the Gel mix. for stacking gel and resolving gel are given below:
14
(a) Solution for preparation of resolving gel (12%), 0.37 M Tris HCl, pH 8.8
Distilled water
3.35 ml
1.5 M Tris-HCl, pH 8.8
2.5 ml
Acrylamide/Bis (30% Stock)
4.0 ml
10% (w/v) SDS Stock
100 l
10% ammonium persulphate
50 l
TEMED
5l
-----------------Total volume =
10 ml
(b) Solution for preparation of stacking gel (4%), 0.125 M Tris HCl, pH 6.8
Distilled water
6.1 ml
0.5 M Tris-HCl, pH 6.8
2.5 ml
Acrylamide/Bis (30% Stock)
1.3 ml
Degas under vacuum for 3 - 5 min. and add
100% (w/v) SDS stock
100 l
10% ammonium persulphate
50 l
TEMED
10 l
----------------------Total Volume =
10 ml
15
All the components except 10% ammonium persulphate and TEMED were mixed in the
required amounts for resolving and separating gels separately. Required amount of 10%
ammonium persulphate and TEMED were added and thoroughly mixed to the Gel mix.
before pouring the assembled gel sandwich.
Pouring the gel:
Resolving gel:
The 10 x 10cm glass plates were thoroughly washed and cleaned with distilled water and
soap. This was followed by rinsing 70% ethanol to remove any impurity. 1mm thick
spacer were placed between the air dried glass slabs and fitted into assembled gel
sandwich. The Gel mix. containing ammonium persulphate and TEMED was poured in
between the glass plates and allowed to polymerize leaving enough place for stacking gel
for 30 - 45 min. water saturated n-butanol was layered at the top of the polymerizing
resolving gel.
Stacking gel:
After polymerization of the resolving gel, the n-butanol layer was removed, the gel top
was washed with distilled water followed by pouring of the stacking gel mixture
containing 10% ammonium persulphate and TEMED and insertion of the comb in the
poured stacking Gel mix. The stacking gel was allowed to polymerize for further 30 - 45
min.
Electrophoresis:
After polymerization, the comb was removed carefully and the wells were washed
immediately with deionized water to remove the unpolymerized acrylamide.
16
The gel sandwich assembly was placed in the electrophoretic chamber containing TrisHCl buffer (running buffer) in upper and lower buffer chamber. A tracking dye,
bromophenol blue was used to ascertain movement of the protein components. 5 – 10 μl
sample was loaded in a well with the help of Hamilton syringe and 1 – 2 μl slandered
protein mixture was loaded into other well.
The gel was run at 120 volt for 1 h. When the dye bands had moved to the opposite end
of the gel, the power was switched off; the gel was removed and stained with commassie
blue for 1 h. the protein bands were observed after destaining the gel with destainer
solution.
17
3.1 Extraction:
Fresh livers were excised from Labeo Rohita (common name Rohu) captured from
Indus river (Khyber Pakhtunkhwa, Pakistan) and was homogenized in blender and added
0.3M acetate buffer, pH 5 - 6 containing 1mM ethylenediamine tetra acetate, 0.1 mM
phenylmethylsulfonyl fluoride and 1 mM β-mercaptoethanol at the rate of 1g/3ml of
buffer. After homogenization, it was agitated for some period and centrifuged at 8000
rpm (Rotor JA-14) for 30 minutes. Then it was filtered over glass wool.
3.2 Fractionation with (NH4)2SO4:
Solid ammonium sulphate was added to extract to 30% level (176g /l). Addition of salt
was gradual with constant stirring. It was centrifuged at 8000 rpm. The supernatant was
collected. Small portion of it was saved for enzyme activity while precipitate was
discarded.
Solid ammonium sulphate was added to supernatant to form 60% saturation and stirred
in cold place for 2 h. It was then centrifuged at 8000 rpm for ½ h, discarding the
supernatant and dissolved the precipitate in 0.01 M acetate buffer pH 5 - 6 with volume
equal to volume obtained in 30% fractionation.
3.3 Result:
The acid phosphatase activity of the extract, fraction from 30%(NH4)2SO4
precipitation and fraction obtained after 60% (NH4)2SO4 precipitation was determined in
the absence and presence of 10 mM NaF at pH 5.0, 5.5 and 6.0. As shown in table 1, total
acid phosphatase activity (without NaF addition) was almost same at three pH values in
three fractions collected.
18
When acid phosphatase activity in the presence of NaF (a well known strong
inhibitor of HM-ACP), the LM-ACP activity was also the same at three pH values in
three samples (Table 2) which indicate that high molecular weight acid phosphatase is
present in 35 - 40% while low molecular weight acid phosphatase exist in 60 - 65% of the
total activity in fish liver extract. Similar result was obtained from experiment on gel
filtration on Sephadex G-75 column (Fig.1). The ratio of high and low molecular weight
acid phosphatases is 40:60.
19
Table 1: Total acid phosphatase activity in fish liver
Without NaF
pH 5.0
pH 5.5
pH 6.0
activity (U/ml)
activity (U/ml)
activity (U/ml)
Extract
0.72
0.71
0.744
30% (NH4)2SO4
saturation
0.532
0.543
0.537
60% (NH4)2SO4
saturation
2.302
2.461
2.145
20
Table 2: Low molecular weight acid phosphatase activity in fish liver
With NaF
pH 5.0
pH 5.5
pH 6.0
activity (U/ml)
activity (U/ml)
activity (U/ml)
Extract
0.49 (69%)
0.38 (53%)
0.465 (62%)
30% (NH4)2SO4
saturation
0.406 (76%)
0.416 (75%)
0.335 (62%)
60% (NH4)2SO4
saturation
1.734 (73%)
1.793 (72%)
1.652 (74%)
21
2.5
A280,
∆A405
2
1.5
1
I
II
0.5
0
1
5
9
13
17
21
25
29
33
37
41
45
49
Fraction number.
Fig. 1 Elution profile of gel chromatography on Sephadex G-75
5 ml sample after precipitation with 60% saturation of (NH4)2SO4 was
placed on Sephadex G-75 column (1.8 x 85 cm) previously equilibrated and
eluted with 0.01 M acetate buffer, pH 5.5 containing 0.1 M NaCl; flow rate
30 ml/h and 5 ml fractions were collected. Peak I was eluted in void volume
while peak II was eluted in separating range. Both peaks were pooled
separately. The activity of each peak was determined.
Ordinates: Protein at 280 nm (); acid phosphatase activity, ∆A405 ().
22
4.1 Scheme I:
4.1.1. Extraction:
Fish liver (400 grams) was homogenized in a Waring blender for 2 - 3 min with
30 sec. intervals and acetate buffer, pH 5.0 containing some additives at the rate of 1Kg/L
was added, followed by stirring for 1h. The homogenate was centrifuged at 2740 × g for
30 min. The supernatant was collected and pellet was discarded.
4.1.2. Fractionation with 30% (NH4)2SO4 saturation:
Solid ammonium sulphate was added to 30% level with gradual additions and
constant stirring. After ½ h, the mixture was centrifuged at 2740 × g for 30 min. and the
supernatant was saved while precipitate obtained was discarded.
4.1.3. Fractionation with 60% (NH4)2SO4 saturation:
The supernatant was brought to 60 % level. The resulting mixture was stirred for
1 - 2 h and then centrifuged at 2740 × g for 1 h. The precipitate, thus obtained was
dissolved in reasonable amount of acetate buffer, pH 4.8 containing additives. The
suspension was stirred for 1 - 2 h and again centrifuged at 10,000 × g for 1 h.
4.1.4. Dialysis:
The clear supernatant was dialyzed against 10 - 12 L of the same buffer over 24 h
with 2 - 3 replacements of fresh buffer. The dialysate was centrifuged at 10,000×g for 1h.
4.1.5. Cation exchange chromatography on SP-Sephadex C-50:
Clear supernatant was applied to a SP-Sephadex C-50 column (6.5 x 33 cm)
previously equilibrated with dialyzing buffer and column was washed with the same
buffer. During column washing, the HM-ACP was eluted which was confirmed by
assaying enzyme in the presence of 10 mM NaF (competitive inhibitor of HM-ACP). The
fractions containing HM-ACP were pooled together as unbound enzyme.
23
4.1.6. Gel filtration on Sephadex G-100:
Unbound acid phosphatase from SP-Sephadex C-50 column was precipitated by
adding (NH4)2SO4 to 70% level and collected by centrifugation at 10, 000 × g for 1 h.
The precipitate was dissolved in about 32 ml of acetate buffer, pH 5.0 containing
additives and applied in three batches to Sephadex G-100 (2.4 x 85 cm) equilibrated with
acetate buffer, pH 5.0containing additives and 0.1 M NaCl and eluted with the same
buffer. The most active fractions were pooled and dialyzed against 5 L of acetate buffer,
pH 6.0 containing additives.
4.1.7. Cation exchange chromatography on CM-Cellulose:
The dialyzed sample was applied to CM-Cellulose column (2.5 x 18 cm) that was
equilibrated with dialyzing buffer. The column was washed with same buffer until the
absorbance at 280 nm was less than 0.1. Acid phosphatase activity was eluted with 0 -0.5
M NaCl linear gradient in the same buffer (total volume of 400 ml). The active fractions
were pooled, concentrated by ultra filtration and used for further studies.
4.1.8. Result:
The summary of the purification scheme is presented in table.3 and the elution
profiles of various chromatographic techniques are shown in fig. 2 and 3. Enzyme was
24
Table 3: Purification of HM-ACP from fish liver. ( Scheme I)
Extract
Vol.
(ml)
1166
Act.
(U/ml)
Total Act.
(U)
Prot.
(mg/ml)
Total Prot.
(mg)
Sp. Act.
(U/mg)
Pur. Factor
0.04
1
30-60%
(NH4)2SO4
saturation
165
2.1
346.5
52.5
8662.5
0.04
1
32
SP-Sephadex C50
32
1.624
61.97
40
1280
0.048
1.2
5.7
SephadexG-100
127
0.272
34.5
3.7
469.9
0.073
1.83
3.0
C-M Cellulose
7
4.2
29.4
8.36
58.8
0.5
12.5
2.7
0.926
1079.72
25
23.15
26992.9
Recovery
%
100
Fig. 2
Elution profile from Sephadex G-100 with flow rate of 15 ml/h and 2.5 ml
fractions were collected.. Ordinates: Protein at 280 nm (); acid
phosphatase activity, U/ml (). Zn- dependent acid para-nitrophenyl
phosphatase, U/ml(xx).
26
Fig. 3 Elution profile from CM-Cellulose chromatography with flow rate of
30 ml/h and10ml fractions were collected. The arrow indicates the start
of linear gradient 0-0.5 M NaCl in buffer.
Ordinates: Protein at 280 nm (); acid phosphatase activity,
U/ml (). Zn- dependent acid para-nitrophenyl phosphatase,
U/ml(xx).
27
partially purified from fish liver. In the final step of CM-Cellulose chromatography, the
protein peak and both the acid phosphatase and the Zn++- dependent p-nitrophenyl
phosphatase activity peaks were found not super-imposable. The purification of acid
phosphatase was achieved 12.5 fold with recovery of 2.7%. The enzyme had a specific
activity of 0.5 U/mg of protein. There was a great decrease in the total activity during
(NH4)2SO4 fractionation at 60% saturation level and SP-Sephadex C-50 chromatogarphy
resulting in a very low recovery of enzyme. The purity was checked on SDS-PAGE. The
SDS-PAGE of each step of enzyme purification is shown in fig: 4. Major protein band
(acid phosphatase enzyme) corresponding to 48 kDa was seen along with small faint
protein bands of high and low molecular weights around it as impurities. The molecular
weight of native enzyme obtained by gel filtration on calibrated Sephadex G-100 column
was 100 kDa (Fig. 5). This indicated that this fish liver HM-ACP is a dimer consisting of
two equivalent subunits of 50 kDa. When highly concentrated high molecular weight acid
phosphatase enzyme preparation was subjected to SDS-PAGE, a very thin protein band
of low mobility corresponding to 66 kDa was appeared clearly in addition to big band of
48 kDa (Fig. 6). It was realized that it could be another isoenzyme of molecular weight
130 kDa as two HM-ACP isoenzymes have been reported in plants (Tso and Chen, 1997)
that had been separated by Ultrogel AcA-44 column. The first peak was minor that was
eluted in void volume while the second major peak representing 60 - 80% of the total
activity of the extract, was eluted in the separating range. Their molecular weights were
130 kDa and 100 kDa.
28
1
2
3
4
5
6
7
Fig. 4 SDS-Polyacrylamide gel electrophoresis of 100kDa isoenzyme
Lane 1
Lane 2
10 μl of enzyme preparation after SP-Sephadex C-50
10 μl of above enzyme SP-Sephadex C-50 concentrated
by 70% (NH4)2SO4
Lane 3
Lane 4
Lane 5
Lane 6
Lane 7:
10 μl of enzyme after Sephadex G-100
10 μl of enzyme after CM-Cellulose
5 μl enzyme after CM-Cellulose
20 μl enzyme after CM-Cellulose
Standard proteinS, from top to bottom, bovin
serum albumin (66,000 Da), oval albumin (45,000
Da), carbonic anhydrase (29,000Da), trypsin
inhibitor (20,000Da), lactaibumin (14,200 Da).
29
Log Mr wt
6
5.5
1
5
4.5
2
(100kDa)
4
3
4
3.5
3
2.5
2
60
80
100
120
140
160
180
200
Elution volume (ml)
Fig. 5
Linear graph of log molecular weight versus elution volumes of standard
proteins.
3 - 5mg of each protein in about 3 - 4ml of buffer was applied onto the column
of Sephadex G-100 and eluted as described in material and methods. Blue dextrin
2000 (average Mr 2 x 10⁶) was used to measure void volume (Vo) of the column and
elution volume (Ve) was determined from the absorbance at 280 nm for standard
proteins () or by assay of enzyme activity at 405 nm for the 100 kDa enzyme
sample. (1) Bovine serum albumin (Mr 66,000), Ve 98 ml; (2) Carbonic anhydrase
(Mr 29,000), Ve 126 ml; (3) Cytochrome c (Mr 12,400), Ve 148 ml; (4) Aprotinin (Mr
6,500), Ve 165 ml; HM-ACP (100 kDa), Ve 84 ml; HM-ACP; Vo 72 ml.
30
1
Fig. 6
2
3
SDS-polyacrylamide gel electrophoresis of HM-ACP enzyme.
Lane 1:
Standard protein used from top to bottom were bovin serum
albumin (66 kDa), oval albumin (45 kDa), carbonic
anhydrase (29 kDa), trypsin inhibitor (20 kDa),
lactaibumin (14.2 kDa).
Lane 2 & 3: Increasing amount of highly concentrated HM-ACP
enzyme ( 10 l & 20 l)
31
In our case, gel filtration on Sephadex G-100 revealed one peak of high molecular
weight acid phosphatase (100 kDa) but slight shoulder in the ascending part of the
activity peak (Fig. 2) was seen pointing to the existence of 130 kDa isoenzyme. SDSPAGE (Fig. 6) also showed 2 bands of 66 kDa (dimer, 130 kDa) and 48 kDa (dimer, 100
kDa). The problem needs to be resolved and purification scheme for 130 kDa isoenzyme
is to be developed.
4.2. Scheme II:
Fish liver (514 grams) after extraction followed by 30% (NH4)2SO4
precipitation and 80% (NH4)2SO4 precipitation was dialyzed against 20 vol. of acetate
buffer, pH 4.8 containing additives over night .The dialyzed sample was centrifuged for
30 minutes at 8000 rpm. The clear supernatant was applied on SP-Tris Acryl column
(1.4 x 14 cm) which was previously equilibrated with acetate buffer, pH 4.8 additives.
The column was washed with same buffer. The bound enzyme was then eluted with 0.15
M NaCl and then with 0.5 M NaCl in the same washing buffer. The most active fractions
were collected.
Sample after SP-Tris acryl was dialyzed against 10 vol. of acetate buffer, pH 5.9
containing additives over night. The dialyzed sample was centrifuged and the clear
supernatant was subjected to cation-exchange chromatography on CM-Cellulose (3 x
32.5 cm) which was previously equilibrated with acetate buffer, pH 5.9 containing
additives. The column was washed with same buffer. The bound enzyme was eluted with
gradient 0 - 0.5 M NaCl in the same buffer (total volume 100ml). This was followed by
single step elution with 0.5 M NaCl in the same buffer. The most active fractions were
collected and concentrated by ultrafiltration with YM3 membrane for further study.
32
Result:
The summary of this purification scheme is shown in table 4. Elution profiles are
shown in fig. 7 and 8. SP-Tris acryl chromatography found better. In this step, 9-fold
purification was found with specific activity of 0.4 U/mg of protein. CM-Cellulose
chromatography gave further 5-fold purification. Overall purification was 45 times with
specific activity of 2 U/mg and recovery of 3.5%. The scheme II was preferable over the
scheme I.
33
Table 4: Purification of HM-ACP from fish liver. (Scheme II)
Vol.
(ml)
Act.
(U/ml)
Total act.
(U)
Prot.
(mg/ml)
Total prot.
(mg)
Sp. Act.
Pur. factor
Recovery
%
Extract
1700
0.962
1635.4
22.4
38080
0.043
1
100
30%
(NH4)2SO4
saturation
1720
0.672
1158.84
14.0
24080
0.048
1.1
70.67
80%
(NH4)2SO4
saturation
385
2.96
1139.6
42.4
16324
0.07
1.63
69.68
SP-Tris
Acryl
442
0.40
176.8
1.0
442
0.40
9.302
10.81
CMCellulose
288
0.2
57.6
0.102
29.376
1.961
45.605
3.52
34
2
U/ml
A280
1.2
1.8
1
1.6
1.4
0.8
1.2
0.6
1
0.8
0.4
0.6
0.4
0.2
0.2
0
0
1
6
11
16
21
26
31
36
41
46
51
56
Fraction number
Fig. 7 Elution profile from Tris Acryl chromatography with flow rate of 30 ml/h and
5 ml fractions were collected. The arrow indicates the start of linear gradient 00.15 M NaCl in buffer. Ordinates: Protein at 280 nm (); acid phosphatase
activity, U/ml ().
35
A280
0.16
U/ml
0.3
0.14
0.25
0.12
0.2
0.1
0.15
0.08
0.06
0.1
0.04
0.05
0.02
0
1
6
11
16
21
26
31
36
41
46
0
Fraction number
Fig. 8 Elution profile from CM-Cellulose chromatography with flow rate of 30 ml/h and
10 ml fractions were collected. The arrow indicates the start of linear gradient 00.5 M NaCl in buffer. Ordinates: Protein at 280 nm (); acid phosphatase
activity, U/ml ().
36
4.3. Scheme III:
Fish liver (514 grams) after extraction followed by 30% (NH4)2SO4
precipitation. The precipitate obtained with 80% (NH4)2SO4 precipitation was dissolved
in acetate buffer, pH 5.0 containing additives. The pH of the enzyme solution was
adjusted to pH 4.2 with cold 1 M acetic acid and then immediately centrifuged at 14,000
× g for 30 min and the pH of supernatant was brought back to 5.0 with 1 M cold Tris
solution. The fraction precipitating between 30% and 70% of (NH4)2SO4 saturation was
then isolated as done before. The pellets obtained after 70% (NH4)2SO4 saturation were
dissolved in acetate buffer, pH 4.5 containing additives. It was then dialyzed against 20
vol. of acetate buffer, pH 4.5 containing additives over night. The dialyzed sample was
centrifuged for 30 min. at 12,000 × g. The clear supernatant was subjected to cationexchange chromatography on CM-Cellulose (2.8 × 15 cm) which was previously
equilibrated with acetate buffer, pH 4.5 containing additives. The column was washed
with same buffer. The bound enzyme was eluted with linear gradient 0 - 0.1 M NaCl in
the same buffer and then with second gradient 0.1 - 0.5 M NaCl in the buffer. The most
active fractions were collected. Then the pooled fractions were concentrated by
ultrafiltration with YM3 membrane and then sample was dialyzed against 5 vol. of Tris
HCl buffer, pH 7.4 containing additives over night. The dialyzed sample was then
centrifuged at 12,000 × g for 30 min. and the clear sample was then applied on DEAE-52
column (2.8 × 24 cm) previously equilibrated with Tris-HCl buffer, pH 7.4 containing
additives. Then a salt and pH gradient was applied. One reservoir contained Tris-HCl
buffer, pH 7.4 and other contained 0.15 M NaCl in 0.01 M Tris HCl buffer, pH 4.8. Then
a second gradient 0.15 - 0.5 M NaCl in same buffer was applied and lastly, column was
37
eluted with 0.5 M NaCl in buffer. Protein was eluted but no acid phosphatase activity was
found in any fraction.
Result:
This scheme is actually for the purification of human liver acid phosphatase
(Saini and Van Etten, 1978). The results obtained after second step of (NH4)2SO4
precipitation was satisfactory. CM-Cellulose chromatography always gives reasonable
purification as can be seen in previous schemes. Here DEAE-Cellulose column failed to
find the enzyme. So this scheme of Saini and Van Etten was abondand. Purification steps
are shown in table 5 and elution profiles of various chromatographies are given in fig 9
and 10.
4.4. Scheme IV:
Frozen fish livers was brought into thawing state and was homogenized in
blender and added acetate buffer, pH 5.0 containing additives at the rate of 1 g/ 3 ml.
After homogenization, it was agitated for 1 - 2 hours and centrifuged at 8000 rpm (Rotor
JA-14) for 30 min. Then it was filtered over glass wool. Solid (NH4)2SO4 was added to
extract to 30% saturation (176 g/ l). Addition of salt was gradual with constant stirring
and stirred further for 1 h. It was centrifuged at 8000 rpm. The supernatant was collected
and precipitate was discarded. Solid (NH4)2SO4 was added to supernatant to form 70%
saturation and stirred in cold
38
Table 5: Purification of HM-ACP from fish liver. (Scheme III)
Vol. (ml)
Act.
(U/ml)
Total act.
(U)
Prot.
(mg/ml)
Total prot. (mg)
Sp. Act.
Pur. factor
Recovery
%
Extract
3182
0.88
2800.16
30.39
97.7 x 10³
0.029
1
100
30%
(NH4)2SO4
precipitation
3357
0.76
2551.32
35.39
118.13 x 10³
0.022
0.76
91.11
80%
(NH4)2SO4
precipitation
800
1.63
1304
45.0
36 x 103
0.036
1.24
46.57
Acidify at pH
4.2
850
0.802
681.7
22.04
18.73 x 10³
0.036
1.24
24.35
2nd (NH4)2SO4
precipitation
412
1.13
465.56
6.05
2.49 x 10³
0.187
6.45
16.63
CM-Cellulose
490
0.464
227.36
0.653
319.97
0.701
24.5
8.12
DE-52
______
at all
______
No
binding
39
3
U/ml
A280
2.5
2.5
2
2
1.5
1.5
1
1
0.5
0.5
0
0
1
6
11
16
21
26
31
36
41
46
51
56
61
66
71
76
81
86
91
96
101
106
Fraction number
Fig. 9 Elution profile from CM-Cellulose chromatography with flow rate of 30 ml/h
and 10 ml fractions were collected with a flow rate. The arrow indicates the
start of linear gradient 0-0.5 M NaCl in buffer.
Ordinates: Protein at 280 nm (); acid phosphatase activity, U/ml ().
40
A280
3
U/ml
2.5
2.5
2
2
1.5
1.5
1
1
0.5
0.5
0
0
1
6
11
16
21
26
31
36
41
46
51
56
61
66
71
76
81
86
91
96
Fraction number
Fig. 10
Elution profile from DEAE-52 chromatography with flow rate of 30 ml/h
and 10 ml fractions were collected with a flow rate. The arrow indicates the
start of linear gradient 0-0.5 M NaCl in buffer.
Ordinates: Protein at 280 nm (); acid phosphatase activity, U/ml ().
41
place for 2 h. It was then centrifuged at 8000 rpm for ½ h discarding the supernatant and
dissolved the precipitate in acetate buffer, pH 4.8 containing additives. It was then
dialyzed against 20 vol. of acetate buffer, pH 4.8 containing additives over night .The
dialyzed sample was centrifuged for 30 min. at 8000 rpm. The clear supernatant was
subjected to cation-exchange chromatography on SP-Sephadex C-50 column (8.5 x 33
cm) which was previously equilibrated with acetate buffer, pH 4.8 containing additives.
The column was washed with same buffer with flow rate of 150 ml / h and 20 ml
fractions were collected. The unbound HM-ACP activity was pooled and concentrated
by precipitation with 70% (NH4)2SO4. The precipitate thus obtained was collected by
centrifugation and dissolved in acetate buffer, pH 5.9 containing additives while bound
protein containing LM-ACP activity was eluted with 0.3 M phosphate buffer, pH 5.5,
containing additives to purify LM-ACP (Siddiqua et al. 2008).
85 ml of sample of HM-ACP after 70% (NH4)2SO4 precipitation was dialyzed
against 10 vol. of acetate buffer, pH 5.9 containing additives over night. The dialyzed
sample was centrifuged and the clear supernatant was subjected to cation-exchange
chromatography on CM-Cellulose (3 × 29 cm) which was previously equilibrated with
acetate buffer, pH 5.9 containing additives. The column was washed with same buffer.
The bound enzyme was eluted with gradient 0 - 0.5 M NaCl in the same buffer (total
volume of 400 ml). This was followed by single step elution with 0.5 M NaCl in the same
buffer. The most active fractions were collected and concentrated by ultrafiltration with
YM3 membrane. The concentrated sample (10ml) was applied in two batches to
Sephadex G-100 (2.5 × 85 cm) previously equilibrated and eluted with acetate buffer, pH
5.1 containing additives and 0.1 M NaCl The fractions containing reasonable activity
42
were pooled, concentrated by ultrafiltration and dialysed against 2 volumes of acetate
buffer, pH 5.1 containing additives. The dialysed sample was applied on Reactive Blue 4Agarose column (1.8 × 14 cm) previously equilibrated and eluted with dialyzing buffer.
The bound enzyme was eluted with 0.25 M NaCl. The most active fractions were pooled
and concentrated for PAGE analysis and biochemical properties.
Result:
The summary of the purification scheme is presented in table 6 and the elution
profiles of various chromatographic techniques are shown in fig. 11-13. (NH4)2SO4 and
SP-Sephadex C-50 chromatographic steps were very effective in removing contaminating
proteins. The enzyme was purified about 43-fold with an overall recovery of 0.15% and a
specific activity of 1.75 U/mg/min. The homogeneity of the enzyme was checked by
SDS-PAGE under reduced and non-reduced conditions and a single protein band
corresponding to 48 kDa was observed with a faint protein bands (Fig. 14). These results
are similar to that obtained from scheme II (Table 4) but scheme II is preferable in a
sense that yield obtained is higher (3.5%) and chromatographic steps are few as
compared to this scheme.
43
Table 6: Purification of HM-ACP from fish liver. ( Scheme IV)
Vol.
(ml)
Act.
(U/ml)
Total act.
(U)
Prot.
(mg/ml)
Total
Sp.
Prot. (mg)
Act.
Pur. factor
Recovery
%
Extract
3330
0.93
3100.23
29.2
97236
0.032
1
100
30%
(NH4)2SO4
precipitation
3480
0.608
2115.84
28.4
98832
0.21
0.66
68.25
70%
(NH4)2SO4
precipitation
505
2.08
1050.4
63.6
32118
0.033
1.03
33.88
SP-Sephadex
C-50(unbound
sample)
895
0.158
141.41
6.1
5459.5
0.026
0.81
4.56
CM-Cellulose
179
0.3
53.7
4
716
0.075
2.34
1.732
Sephadex G100
95
0.2
19
0.355
33.725
0.56
17.5
0.61
Reactive Blue
9
0.548
4.93
0.33
2.97
1.75
43
0.15
44
3
U/ml
A280
0.5
0.45
2.5
0.4
0.35
2
0.3
0.25
1.5
0.2
1
0.15
0.1
0.5
0.05
0
0
1
6
11
16
21
26
31
36
41
46
51
56
61
66
71
76
81
86
F.No.
Fig. 11
Elution profile from CM-Cellulose chromatography with flow rate of 30 ml/h
and 10 ml fractions were collected. The arrow indicates the start of linear
gradient 0 - 0.5 M NaCl in buffer.
Ordinates: Protein at 280 nm (); acid phosphatase activity, U/ml ().
45
A280
1
U/ml
0.9
0.4
0.35
0.8
0.3
0.7
0.25
0.6
0.2
0.5
0.4
0.15
0.3
0.1
0.2
0.05
0.1
0
0
1
6
11
16
21
26
31
36
41
46
51
56
61
F.No.
Fig. 12
Elution profile from Sephadex G-100 with flow rate of 15 ml/h and 2.5 ml
fractions were collected.
Ordinates: Protein at 280 nm (); acid phosphatase activity, U/ml ().
46
3
U/ml
A280
1.2
1
2.5
2
0.8
1.5
0.6
1
0.4
0.5
0.2
0
1
6
11
16
21
26
31
36
41
46
0
F.No.
Fig. 13
Elution profile from Reactive Blue chromatography with flow rate of
27 ml/h and 3 ml fractions were collected. The arrow indicates the
start of linear gradient 0 - 0.25 M NaCl in buffer.
Ordinates: Protein at 280 nm (); acid phosphatase activity,
U/ml ().
47
1
Fig. 14
2
3
4
SDS-polyacrylamide gel electrophoresis of HM-ACP enzyme.
Lane 1
Lane 2
Lane 3
Lane 4
10 μl non-reduced enzyme (corresponding to 48 kDa),
5 μl reduced enzyme,
10 μl reduced enzyme,
Standard proteins: Albumin (66 kDa), ovalbumin (45 kDa),
Carbonic anhydrase (29 kDa), trypsin inhibitor (20 kDa) and
lactalbumin (14.2 kDa).
48
4.5. Scheme V:
Extract
30-70% (NH4)2SO4 saturation
SP-Sephadex C-50 chromatography
Unbound fraction
Bound fraction
Sephadex G-75
affinity
SDS
18kDA
CM-Cellulose chromatography
Bound sample
Unbound sample
Ultrogel ACA-44 chromatography
Sephacryl HR-200 chromatography
Concanavaline A chromatography
SDS-PAGE
SDS-PAGE
48 kDa band
66 kDa band
49
4.5.1. Extraction
Frozen fish liver (400grams) was brought into thawing state and was homogenized in a
Waring blender and added acetate buffer pH 5.0 containing additives at the rate of
1Kg/3L. After homogenization, it was agitated for 1-2 hours and centrifuged at 8000 rpm
(Rotor JA-14) for 30 minutes. Then it was filtered over glass wool.
4.5.2. Ammonium sulphate fractionation.
Solid (NH4)2SO4 was added to 1270 ml of extract to 30% saturation (176 g /L).
Addition of salt was gradual with constant stirring and stirred further for 1 h. It was
centrifuged at 8000 rpm. The supernatant was collected and precipitate was discarded.
Solid (NH4)2SO4 was added to supernatant to form 80% saturation and stirred in cold
place for 2 h. It was then centrifuged at 8000 rpm for ½ h discarding the supernatant and
dissolved the precipitate in acetate buffer, pH 4.8 containing additives. It was then
dialyzed against 20 vol. of acetate buffer, pH 4.8 containing additives over night .The
dialyzed sample was centrifuged for 30 min. at 8000 rpm.
4.5.3. SP Sephadex C-50 chromatography.
The clear supernatant was subjected to cation-exchange chromatography on SPSephadex C-50 column (8.5 × 33 cm) which was previously equilibrated with acetate
buffer, pH 4.8 containing additives. The column was washed with same buffer. The
unbound HM-ACP activity was pooled (Fig. 15) and concentrated by
50
A280
10
U/ml 1.8
9
1.6
8
1.4
7
1.2
6
1
5
4
0.8
non-bound
0.6
3
0.4
2
0.2
1
bound
0
0
1 2 3 4 5 6 7 8 9 10 11 12 13 14 15 16 17 18 19 20 21 22 23 24 25 26 27
Fraction No.
Fig. 15
Elution profile from SP-Sephadex C-50 chromatography with flow rate of
100 ml/h and 100 ml fractions were collected. The arrow indicates the start
of gradient 0.3 M phosphate in buffer.
Ordinates: Protein at 280 nm (); acid phosphatase activity,
U/ml ().
51
precipitation with 70% (NH4)2SO4. The precipitate thus obtained was collected by
centrifugation and dissolved in acetate buffer, pH 5.9 containing additives. While bound
enzyme (LM-ACP) was eluted with phosphate buffer, pH 5.9 containing additives. The
fractions containing reasonable activities (LM-ACP) were pooled together and the
enzyme was precipitated by adding (NH4)2SO4 to 70% saturation.
4.5.4. CM-Cellulose chromatography.
50 ml of sample of HM-ACP after 70% (NH4)2SO4 precipitation was dialyzed
against 10 vol. of acetate buffer, pH 5.9 containing additives over night. The dialyzed
sample was centrifuged and the clear supernatant was subjected to cation-exchange
chromatography on CM-Cellulose (3 × 32.5 cm) which was previously equilibrated with
acetate buffe, pH 5.9 containing additives. The column was washed with same buffer.
During the washing, unbound protein containing acid phosphatase activity was eluted.
The bound enzyme was eluted with gradient 0 - 0.15 M NaCl in the same buffer. This
was followed by single step elution with 0.5 M NaCl in the same buffer. The elution
profile is shown in fig. 16. The most active fractions of bound and unbound enzyme were
collected separately and both were concentrated by ultrafiltration with YM3 membrane.
52
U/ml
10 A280
(unbound)
9
1.6
8
1.4
7
1.2
6
1
5
(bound)
4
0.8
0.6
3
0.4
2
0.2
1
0
1.8
1
5
9
13 17 21 25 29 33 37 41 45 49 53 57 61 65 69 73 77 81 85 89 93
0
Fraction No.
Fig. 16 Elution profile from CM-Cellulose chromatography with flow rate of 30 ml/h
and 10 ml fractions were collected. The arrow indicates the start of linear
gradient 0 - 0.5 M NaCl in buffer.
Ordinates: Protein at 280 nm (); acid phosphatase activity, U/ml ).
53
4.5.4.1. Purification of enzyme (100 kDa) from unbound fraction of CM-Cellulose
chromatography:
Ultrogel ACA-44 chromatography:
The concentrated unbound sample was applied to Ultrogel ACA 44 column (1.8 × 86
cm) previously equilibrated and eluted with Tris-HCl buffer, pH 7.0 containing 1%
Triton X-100, 0.5 M NaCl and some additives. The elution profile is shown in fig. 17.
The fractions with maximum acid phosphatase activity were pooled together and
concentrated by ultrafiltration.
Concanavalin-A 4-B chromatography:
The concentrated sample was applied on the Concanavalin-A 4-B column previously
equilibrated with Tris-HCl buffer, pH 7.0 containing 1 mM CaCl2 and 1 mM MnCl2. the
bound enzyme was eluted by linear gradient 0 – 10 % α-D-Mannose in the same washing
buffer. The elution profile is shown in fig. 18. The most active fractions were collected
and concentrated.
Results
HM-ACP was purified 368-fold by series of chromatography on SP-Sephadex C50, CM-Cellulose, Ultrogel ACA-44 and concanavalin-A 4-B columns with a specific
activity of 14 U/mg of protein and recovery of 3% with respect to starting material. The
summary of purification scheme is represented in table 7. The homogeneity of the
denatured enzymes under reduced condition was checked on SDS-PAGE. Single band
was detected. The molecular weight of denatured enzyme on SDS-PAGE (12% gel) was
found to be 48 kDa (Fig. 19). The molecular weight obtained by gel filtration on
calibrated Sephadex G-100 column was found to be 100 kDa (Refer to Fig. 23). This
54
Table 7: Purification of HM-ACP (100 kDa) from fish liver. (Scheme V)
Vol. (ml)
Total act.
(U)
Total Prot.
Sp.
Pur.
Recovery
(mg)
Act.
factor
%
(U/mg)
Extract
1200
2264.4
59112
0.038
1
100
30% -80%
(NH4)2SO4
saturation
200
950
1604.8
0.592
15.57
42.29
SP-Sephadex
750
743.6
294.75
3.436
90.42
33.10
50
272.9
31.45
8.671
228.18
12.148
Ultrogel ACA44
18
67.392
4.284
15.29
402.36
3.0
Con-A
chromatography
15
63
4.5
14
368.42
2.78
C-50
CM – Cellulose
(unbound)
55
5
U/ml
A280
0.7
0.6
4
0.5
3
0.4
0.3
2
0.2
1
0.1
0
0
1
5
9
13 17 21 25 29 33 37 41 45 49 53 57 61 65
69 73 77 81 85 89 93 97
Fraction No.
Fig. 17
UltrogelACA-44 chromatography. Flow rate of 15 ml/h; 2.5 ml fractions
were collected. Ordinates: Protein at 280 nm (); acid phosphatase
activity, U/ml ().
56
A280
10
U/ml
9
1.8
1.6
8
1.4
7
1.2
6
1
5
0.8
4
0.6
3
0.4
2
0.2
1
0
0
1
5
9
13
17
21
25
29
33
37
41
45
Fraction No.
Fig. 18
Concanavoline-A 4-B chromatography. Flow rate of 10 ml/h; 2 ml fractions
were collected. Ordinates: Protein at 280 nm (); acid phosphatase
activity, U/ml ().
57
1
2
3
Fig. 19 SDS-polyacrylamide gel electrophoresis of HM-ACP enzyme (100 kDa).
Lane 1 & 3 Standard proteins: Albumin (66 kDa), ovalbumin (45 kDa),
Carbonic anhydrase (29 kDa), trypsin inhibitor (20.1 kDa) and
lactalbumin (14.2 kDa).
Lane 2
10 μl reduced enzyme (corresponding to 48 kDa)
58
indicates that fish liver HM-ACP isoenzyme (100 kDa) is a dimmer, i.e. protein
consisting of two equal subunits.
4.5.4.2. Purification of enzyme (130 kDa) from bound fraction of CM-Cellulose
chromatography:
Sephacryl HR-200 chromatography.
The concentrated bound sample was applied to Sephacryl HR-200 column (1.8 ×
86 cm) previously equilibrated and eluted with Tris-HCl buffer, pH 7.0 containing
additives. The elution profile is shown in fig. 20. The fractions containing reasonable
activity were pooled and concentrated by ultrafiltration for further study.
Results
HM-ACP was purified 500-fold by series of chromatography on SP-Sephadex C50, CM-Cellulose and Sephacryl HR-200 columns with a specific activity of 19 U/mg of
protein and recovery of 4% with respect to starting material. The summary of purification
scheme is represented in table 8. The homogeneity of the native and denatured enzymes
under reduced and non-reduced conditions was checked on PAGE. The molecular weight
of denatured enzyme on SDS-PAGE (12% gel) was found to be 66 kDa under reducing
and non-reducing conditions (Fig. 21).Native enzyme showed one major band in 7.5%
PAGE and had molecular weight corresponding to 120-130 kDa (Fig. 22 lane 1-3). The
same molecular weight was obtained by gel filtration on calibrated Sephadex G-100
column (Fig. 23). This indicates that fish liver HM-ACP isoenzyme (130 kDa) is a dimer,
consisted of almost two equivalent subunits.
59
Table 8: Purification of HM-ACP (130 kDa) from fish liver. (Scheme V)
Vol. (ml)
Total act.
(U)
Total Prot.
Sp. Act.
Pur.
Recovery%
(mg)
(U/mg)
factor
Extract
1200
2264.4
59112
0.038
1
100
30% -80%
(NH4)2SO4
saturation
200
950
1604.8
0.592
15.57
42.29
SP-Sephadex
750
743.6
294.75
3.436
90.42
33.10
64
166.592
23.104
7.219
189.97
7.415
12.5
92.102
4.725
19.46
500
4.1
C-50
CM - Cellulose
(bound)
Sephacryl
HR-200
chromatography
60
A280
U/ml
1.6
3.5
3
1.4
2.5
1.2
1
2
0.8
1.5
0.6
1
0.4
0.5
0.2
0
0
1
6
11
16
21
26
31
36
41
46
51
56
61
66
71
Fraction number
Fig. 20
Sephacryl HR-200 chromatography. Flow rate of 15 ml/h; 2.5 ml fractions
were collected. Ordinates: Protein at 280 nm (); acid phosphatase
activity, U/ml ().
61
1
2
3
4
5
Fig. 21 SDS-polyacrylamide gel electrophoresis of HM-ACP enzyme (130 kDa).
Lane 1 & 2 10 μl reduced and non-reduced enzyme (corresponding to 66 kDa),
Lane 3 & 4 3 μl reduced and non reduced enzyme,
Lane 5
Standard proteins: Albumin (66 kDa), ovalbumin (45 kDa),
glycerolaldehyde-3-phosphate dehydrogenase (36 kDa), carbonic
anhydrase (29 kDa), trypsinogen (24 kDa), trypsin inhibitor (20.1
kDa) and lactalbumin (14.2 kDa).
62
1
Fig. 22
2
3
4
Polyacrylamide gel electrophoresis of native enzyme (130 kDa).
Lane 1 10 μl of enzyme band (corresponding to 132 kDa) stained with
Coomassie blue.
Lane 2 5 μl enzyme.
Lane 3 2 μl enzyme.
Lane 4 Standard size marker proteins : β-amylase (200 kDa), alcohol
dehydrogenase (150 kDa) and serum albumin (66 kDa).
63
Log Mr. wt
6
(130 kDa)
5.5
(1)
5
4.5
(2)
(100 kDa)
(3)
(4)
4
3.5
3
2.5
2
60
80
100
120
140
160
180
200
Ve (ml)
Fig. 23
Iinear graph of log molecular weight versus elution volumes of standard
proteins.
3-5 mg of each protein in about 3-4 ml of buffer was applied onto the column of
Sephadex G-100 and eluted as described in material and methods. Blue dextrin 2000
(average Mr 2x10⁶) was used to measure void volume (Vo) of the column and elution
volume (Ve) was determined from the absorbance at 280 nm for standard proteins ()
or by assay of enzyme activity at 405 nm for the 100 kDa and 130 kDa enzyme
samples. (1) Bovine serum albumin (Mr 66,000), Ve 98 ml; (2) Carbonic anhydrase
(Mr 29,000), Ve 126 ml; (3) Cytochrome c (Mr 12,400), Ve 148 ml; (4) Aprotinin (Mr
6,500), Ve 165 ml; HM-ACP (100 kDa), Ve 84 ml; HM-ACP (130 kDa), Ve 78 ml; Vo
72 ml.
64
5.1. pH optima:
Various pH buffer, 0.1 M acetate buffer (pH 3.8 - 5.4), cocodylate buffer (pH 5.0
- 7.4) and Tris-HCl buffer (pH 7.4 - 9) were prepared. The incubation mixture consisted
of 900 µl of buffer of various pH solution, 50 µl of 80 mM substrate p-nitrophenyl
phosphates in water and 50 µl of enzyme was incubated for 5 min. at 37° C. The reaction
was stopped by adding 1 ml of 0.1 M KOH. The yellow colour produced was measured at
405 nm. Blank was prepared in which water instead of enzyme was taken. The activity
was plotted in function of pH. The pH optima for 100 kDa isoenzyme and 130 kDa
isoenzyme were 5.0 and 5.5 respectively as shown in fig. 24 and 25.
5.2. pH stability
The effect of pH on stability of enzyme was determined by incubating the
enzyme in different buffers of various pH ranging from 3 - 9 at 37°C for 24 h. The pH
range was covered with acetate buffer, cocodylate buffer and Tris-HCl buffer. The
remaining enzyme activity in each case was determined as usual. The 100 kDa
Isoenzyme was found to be more stable at pH 4.0 - 6.0, while 130 kDa isoenzyme was
stable at pH 4.4 - 6.5. as shown in fig. 26 and 27.
5.3. Temperature optima
Acid phosphates activity was determined by standard assay method at various
temperatures ranging from 10oC to 800C. The maximum activity for 100 kDa isoenzyme
was observed at 400C (Fig. 28) and for the 130 kDa isoenzyme at 500C (Fig. 29). Above
these temperatures, activity was decreased sharply. This may be denaturation of protein
by heat.
65
activity
0.9
Acetate buffer
cocodylate buffer
Tris HCl buffer
0.8
0.7
0.6
0.5
0.4
0.3
0.2
0.1
0
0
1
2
3
4
5
6
7
8
9
pH
Fig. 24 Optimum pH of 100 kDa acid phosphatase isoenzyme
66
10
Activity
0.8
0.7
0.6
0.5
Acetate buffer
0.4
cocodylate buffer
Tris HCl buffer
0.3
0.2
0.1
0
0
1
2
3
4
5
6
7
8
9
pH
Fig. 25 Optimum pH of 130 kDa acid phosphatase isoenzyme
67
10
Activity
1
0.9
Acetate buffer
cocodylate buffer
Tris HCl buffer
0.8
0.7
0.6
0.5
0.4
0.3
0.2
0.1
0
0
1
2
3
4
5
6
7
8
9
10
pH
Fig. 26 pH stability of 100 kDa acid phosphatase isoenzyme.
68
Activity
0.6
Acetate buffer
cocodylate buffer
Tris HCl Buffer
0.5
0.4
0.3
0.2
0.1
0
0
1
2
3
4
5
6
7
8
9
pH
Fig. 27 pH stability of 130 kDa acid phosphatase isoenzyme.
69
10
U/ml
2
1.8
1.6
1.4
1.2
1
0.8
0.6
0.4
0.2
0
0
20
40
60
80
Temperature
100
120
140
0C
Fig. 28 Optimum temperature of 100 kDa acid phosphatase isoenzyme.
70
U/ml
3
2.5
2
1.5
1
0.5
0
0
20
40
60
80
100
120
Temperature 0C
Fig. 29 Optimum temperature of 130 kDa acid phosphatase isoenzyme.
71
5.4. Temperature Stability
To determine thermal stability of enzyme, the enzyme was pre-incubated at
different temperatures from100C - 800C for 45 min. The residual enzymatic activity in
each case was determined by standard assay method. The result is shown in fig. 30 and
31. The both 100 kDa isoenzyme and 130 kDa isoenzyme were found stable for 45 min.
at least at 50oC. At 60oC, more than 90% activity was lost. At high temperatures, the
activity was completely lost.
All above results are summarized in table 9.
5.5. Thermal inactivation of the enzyme:
Thermal inactivation curve of acid phosphatase activity was constructed by measuring
the activity after incubation the enzyme for different times at 40°C, 50°C, 60°C and
70°C. The enzyme was heated at these temperatures in acetate buffer, pH 5.5 for different
times. The residual activities were determined as usual. The result shown in fig. 32 and
33 indicates that the enzyme was stable at 40°C but there was slight decrease in activity
at 50°C. At 60°C, the activity decrease was significant after 10 min. and at 70°C, almost
all the activity was lost after 2 min. period of incubation.
5.6. Effect of Modifiers:
The effect of methanol, ethanol, glycerol, acetone and ethylene glycol on the acid
phosphatase activity was studied at 10% concentration value. Ethanol, acetone, glycerol
and ethylene glycerol slightly inhibited both enzymes (Table 10) indicating that high
molecular weight acid phosphatases possess no phosphotransferase activity.
72
U/ml
2.4
2.2
2
1.8
1.6
1.4
1.2
1
0.8
0.6
0.4
0.2
0
0
20
40
60
80
100
Temperature 0C
Fig. 30 Temperature stability of 100 kDa acid phosphatase isoenzyme.
73
120
U/ml
2
1.8
1.6
1.4
1.2
1
0.8
0.6
0.4
0.2
0
0
20
40
60
80
100
Temperature 0C
Fig. 31 Temperature stability of 130 kDa acid phosphatase isoenzyme.
74
120
Table 9: Some physicochemical characteristics of acid phosphatases from
fish Liver
Physicochemical
Properties
Optimum pH
Optimum temperature
pH stability
Temperature stability
75
HM-ACP
(100 kDa)
HM-ACP
(130 kDa)
5.0
5.5
40˚C
50˚C
4.0 - 6.0
4.4 - 6.5
50˚C
50˚C
%age activity
120
40oC
50oC
60oC
70oC
100
80
60
40
20
0
0
Fig. 32
10
20
30
40
Minutes
50
Thermal inactivation of 100 kDa acid phosphatase isoenzyme.
76
%age activity
120
40 oC
50 oC
60 oC
70 oC
100
80
60
40
20
0
0
Fig. 33
10
20
30
40
50
Minutes
Thermal inactivation of 130 kDa acid phosphatase isoenzyme.
77
Table 10: Effect of various modifiers on the high molecular weight acid
Phosphatase from fish liver.
Modifiers
Concentrations
(%)
% activity
% activity
(100 kDa)
(130 kDa)
H2O
10
100
100
Acetone
10
70.05
89.16
Ethanol
10
80.02
100.34
Methanol
10
96.97
90.53
Glycerol
10
85.89
98.7
Ethylene glycol
10
45.79
95.2
78
5.7. Effect of metal ions.
The effect of different metal ions and other compounds on the high molecular
weight acid phosphatases was determined as described above at different concentration of
metal ions as shown in table 11. Metal ions such as Ag+, Hg++, Cu++ and Zn++ expressed
inhibitory effect on the both high molecular weight enzymes. Other divalent ions like
Mg++, Mn++ and Co++ were found ineffective on the enzyme activity. There was no
change in the enzyme activity in the presence of EDTA and Triton X-100, while parahydroxy mercuric benzoate showed slight inhibition.
5.8. Determination of Kinetic Parameters:
Kinetic studies were carried out on p-nitro phenyl phosphate as substrate and 0.1 M
acetate buffer, pH 5.5 as described (Siddiqua et al., 2009).
Km and Vmax values were determined by measuring the p-nitro phenol produced at
different concentration of substrate ranging from 0.1 mM to 4.0 mM. Lineweaver- Burk
plots were used. The straight lines were drawn by applying least square rule. Each point
was the average of at least three readings. The results are shown in table 12 and fig. 3435.
5.9. Substrate Specificity
The enzyme activity against number of substrates was determined under conditions
mentioned in material and methods, by estimation of librated inorganic phosphate (Pi) as
the result of hydrolysis. For Pi determination, Black and Jones method was used.
79
Table 11: Effect of different metal ions on activity of high molecular
weight acid phosphatases from fish liver.
Inhibitor
pNPP
Concentration %age activity of
(mM)
100 kDa
isoenzyme
4
100
%age activity
of 130 kDa
isoenzyme
100
ZnCl2
10
48.48
30.62
CuSO4
5
9.32
14.5
10
5.23
8.05
0.2%
89.06
94.54
HgCl2
5
0
2.0
MgCl2
5
91.87
97.58
MnCl2
2
95.21
101.47
5
98.25
109.35
2
75.05
87.59
5
81.23
89.48
AgNO3
5
4.46
3.38
EDTA
10
97.21
95.98
P-hydroxy
mercuric benzoate
0.1
85
82
Triton X-100
1%
89.36
93.0
Formaline
CoCl2
80
Table 12:
Enzyme
Determination of Kinetic parameters
100 kDa
Km
(mM)
0.25
Vmax
(mol min-1mg-1)
1.428
130 kDa
0.15
0.714
81
5
1/V
4
3
2
1
-5
-4
-3
-2
-1
0
0
1
2
3
4
5
6
7
8
1/S
Fig. 34 Determination of Km and Vmax value of 100 kDa isoenzyme
82
9
5
1/V
4
3
2
1
-7
-6
-5
-4
-3
-2
-1
0
0
1
2
3
4
5
6
7
1/S
Fig. 35 Determination of Km and Vmax value of 130 kDa isoenzyme
83
8
9
The enzyme mixture consisted of 450 µl of 0.1 M acetate buffer, pH 5.5, 50 µl of
80 mM of different phosphate substrates, and 50 µl enzyme was incubated for 5 min. at
370C. The reaction was quenched by the addition of 200 µl of 10% TCA. The librated
phosphate (Pi) was determined according to Black and Jones method (1983). The activity
of acid phosphatatases exhibited very broad range of substrate specificity. Table
13
shows the substrate specificity of both enzymes. Aryl phosphates and aliphatic
phosphates both were hydrolyzed by high molecular weigh acid phosphatases. Both
enzymes show broad specificity. These enzymes hydrolyzed p-nitro phenyl phosphate,
phenyl phosphate, α and β naphthyl phosphates at significant rates and were found good
substrates. Reasonable activity was also observed with α and β-glycero-phosphates.
Sugar phosphates, phospho-aminoacids and nucleoside phosphates were also hydrolyzed
in the same way.
5.10. Determination of Ki values:
The effect of inhibitors on activity of high molecular weight acid phosphatases was
determined by measuring the activity using p-nitro phenyl phosphate as substrate ranging
from 0.1 mM to 4 mM in the absence and presence of two or three fixed concentration of
inhibitors. Lineweaver- Burk plots were used to arrive at the value of Ki. PO4, VO3,
MoO4, NaF, tartrate and pyridoxal -5- PO4 were found competitive inhibitors for both
enzymes. Their Ki values are presented in table 14. The inhibitory action of 130 kDa
enzyme is more pronounced than that of 100 kDa enzyme. Their competitive inhibitions
are shown in fig. 36 to 45.
84
Table 13:
Substrate specificity of high molecular weight acid phosphatase
from fish liver.
Substrate
% Activity of
100 kDa
% Activity of
130 kDa
p-nitrophenyl phosphate
100
100
Phenyl phosphate
80
71
Flavin mononucleotide
40
56
-Naphthyl phosphate
78
61
-Naphthyl phosphate
95
89
-Glycero phosphate
15
42
-Glycero phosphate
75
70
Phosphotyrosine
20
39
Phosphoserine
10
25
Phosphothreonine
13
19
Glucose-1-phosphate
12
20
Glucose-6-phosphate
18
16
ATP
35
40
AMP
45
56
UMP
36
40
85
Table 14: Kinetic constants of high molecular weight acid phosphatase
from fish liver.
Substrate
Ki (100 kDa)
Ki (130 kDa)
(µM)
(µM)
PO4
2600
190
VO3
35
0.5
MoO4
20
40
NaF
290
0.11
Na-K-tartrate
1000
55
Pyridoxal-5- PO4
300
15
86
1/v
-4
-3
-2
-1
17
16
15
14
13
12
11
10
9
8
7
6
5
4
3
2
1
0
0mM
.o1
0.02
0.05
0
1
2
3
4
5
6
7
8
9
10
11
12
1/s
Fig. 36
Competitive inhibition of 100 kDa fish liver acid phosphatase by Na3PO4.
87
-4
-3
-2
1/V
17
16
15
14
13
12
11
10
9
8
7
6
5
4
3
2
1
0
-1
0mM
0.1mM
0.2mM
0.5mM
0
1
2
3
4
5
6
7
8
9
10
11
12
1/S
Fig. 37
Competitive inhibition of 100 kDa fish liver acid phosphatase by NaVO3.
88
1/V
20
18
16
14
12
0mM
0.01mM
10
0.02mM
0.05mM
8
6
4
2
-4
-3
-2
-1
0
0
1
2
3
4
5
6
7
8
9
10
11
12
13
14
15
16
1/S
Fig. 38
Competitive inhibition of 100 kDa fish liver acid phosphatase by NaMoO4 .
89
1/V 17
16
15
14
13
12
11
10
9
0mM
8
0.01mM
0.02mM
7
0.05mM
6
5
4
3
2
1
-4
-3
-2
-1
0
0
1
2
3
4
5
6
7
8
9
10
11
12
1/S
Fig. 39
Competitive inhibition of 100 kDa fish liver acid phosphatase by NaF.
90
1/V
0mM
1mM
2mM
5mM
30
25
20
15
10
5
0
-8
-6
-4
-2
0
2
4
6
8
10
1/S
Fig. 40
Competitive inhibition of 130 kDa fish liver acid phosphatase by Na3PO4
91
1/V
25
20
15
0mM
10
0.001mM
0.005mM
0.01mM
5
0
-8
Fig. 41
-6
-4
-2
0
2
4
6
8
10
1/S
Competitive inhibition of 130 kDa fish liver acid phosphatase by Na3VO3
92
1/V
30
25
20
15
0mM
0.001mM
10
0.005mM
5
0
-8
-6
-4
-2
0
2
4
6
8
10
1/S
Fig. 42
Competitive inhibition of 130 kDa fish liver acid phosphatase by Na3MoO4
93
1/V 30
25
20
15
0mM
0.2mM
0.5mM
1.0mM
10
5
-8
Fig. 43
-6
-4
-2
0
0
2
4
6
8
10
1/S
Competitive inhibition of 130 kDa fish liver acid phosphatase by NaF.
94
1/V
25
20
15
0mM
0.2mM
10
0.5mM
1.0mM
5
-8
Fig. 44
-6
-4
-2
0
0
2
4
6
8
10
1/S
Competitive inhibition of 130 kDa fish liver acid phosphatase by Na-tartrate.
95
1/V
0mM
0.125mM
0.25mM
0.5mM
35
30
25
20
15
10
5
0
-8
-6
-4
-2
0
2
4
6
8
10
1/S
Fig. 45
Competitive inhibition of 130 kDa acid phosphatase by pyridoxal -5/phosphate.
96
6.
Purification of low molecular weight acid phosphatase enzyme (LM-ACP,
18 kDa) from bound fraction of SP Sephadex C-50 chromatography.
6.1. Gel filtration Sephadex G-75:
The precipitate obtained after 70 % (NH4)2SO4 precipitation of enzyme sample
eluted from SP Sephadex C-50 chromatography (section 4.5.3 and Fig. 15) was collected
by centrifugation at 10,000 g for 1h and was dissolved in acetate buffer, pH 5.0
containing additives. The enzyme sample was then applied on Sephadex G-75 column
(3.2 x 85 cm) which was equilibrated and eluted with above buffer containing 0.1 M
NaCl. The most active fractions were collected and concentrated by ultrafiltration using
YM3 membrane.
6.2. Affinity chromatography on p-aminobenzylphosphonic acid-agarose gel:
The enzyme after gel filtration was dialyzed overnight against 1 L of citrate
buffer, pH 6.5 containing 1 mM dithiothreitol (DTT). The sample was applied to paminobenzylphosphonic acid-agarose column (1.0 x 5 cm) which was previously
equilibrated with the same buffer. The column was washed extensively with the same
buffer to remove unbound proteins. The bound enzyme was eluted by a linear gradient of
0 - 0.1 M sodium phosphate in same buffer. The fractions with highest enzyme activity
were pooled and concentrated by ultrafiltration
6.3. Result:
The summary of the purification steps is presented in table. 15. The elution
profiles of different chromatographic techniques are shown in fig. 46 and 47. LM-ACP
peak 2 was purified to homogeneity. About 790 folds
97
Table 15: Purification of LM-ACP (18 kDa) from fish liver. (Scheme V)
Vol. (ml)
Total act.
(U)
Total Prot.
Sp. Act.
Pur.+
(mg)
(U/mg)
factor
Recovery%
Extract
1200
2264.4
59112
0.038
1
100
30% -80%
(NH4)2SO4
precipitation
200
950
1604.8
0.592
15.57
42.29
SP-Sephadex
50
41.9
44.75
0.936
24.63
1.85
25
35.9
29
1.237
32.55
1.59
15
12
2.9
5.1
0.19
0.17
15.26
30.0
401.57
789.47
0.13
0.23
C-50
Sephadex G-75
Affinity
Chromatography
Peak 1
Peak 2
98
2.5
A280
U/ml
1.6
1.4
2
1.2
1
1.5
0.8
1
0.6
0.4
0.5
0.2
0
11
21
31
41
51
61
71
81
91
101
111
121
131
0
Fraction number
Fig. 46 Elution profile from a Sephadex G-75. column with a flow rate of 50 ml/h and
6ml fractions were collected.
Ordinates: Protein at 280 nm (); acid phosphatase activity, U/ml ().
99
A280
6
1.4
U/ml
5.5
1.2
5
4.5
1
4
3.5
0.8
3
0.6
2.5
2
0.4
1.5
1
0.2
0.5
0
1
6
11
16
21
26
31
36
41
46
51
56
61
66
0
Fraction number
Fig. 47 Affinity chromatography on p-aminobenzyl phosphonic acid –
agrarose column; Flow rate, 15 ml/h; 2 ml fractions were collected. The
arrow indicates the start of Pi gradient.
Ordinates: Protein at 280 nm (); acid phosphatase activity,
U/ml ().
100
purification was achieved. The specific activity of the purified enzyme was 30 U/mg of
total protein and the recovery was 0.23%. The homogeneity of the enzyme was checked
on 12% SDS-PAGE. Single band was detected and molecular weight of 18 kDa was
obtained (Fig. 48). Similarly, low molecular weight acid phosphatase peak 1 was purified
400 times with specific activity of 15 U/mg of protein. The recovery was also very small.
The major protein band on SDS-PAGE corresponding to 18 kDa was seen along with few
faint bands of low and high molecular weight proteins as impurities. The molecular
weight of both isoenzymes obtained by SDS-PAGE and gel filtration (Fig. 49) showed
the same value. Both isoenzymes were found to be monomeric.
101
1
2
Fig. 48
3
SDS-Polyacrylamide gel electrophoresis of LM-ACP peak 1 and peak 2
isoenzymes.
Lane1. The standard proteins used from top to bottom were Rabbit muscle
phosphorylase (MW 97400), Bovine serum albumin (66200), Oval
albumin (42699), Bovine trypsin inhibitor (31000), Soybean inhibitor
(21500), Egg white lysozyme (14400).
Lane 2.
peak 2 isoenzyme (10 μl).
Lane 3
peak 1 isoenzyme (10 μl).
102
log Mol. Wt.
6
5.5
5
1
2
4.5
3
4
4
3.5
18 kDa
3
2.5
2
60
80
100
120
140
160
180
200
Elution Volume(ml)
Fig. 49
Iinear graph of log molecular weight versus elution volumes of standard
proteins.
3-5 mg of each protein in about 3-4 ml of buffer was applied onto the column of
Sephadex G-100 and eluted as described in material and methods. Blue dextrin 2000
(average Mr 2x10⁶) was used to measure void volume (Vo) of the column and elution
volume (Ve) was determined from the absorbance at 280 nm for standard proteins ()
or by assay of enzyme activity at 405 nm for the 18 kDa enzyme sample. (1) Bovine
serum albumin (Mr 66,000), Ve 98 ml; (2) Carbonic anhydrase (Mr 29,000), Ve 126
ml; (3) Cytochrome c (Mr 12,400), Ve 148 ml; (4) Aprotinin (Mr 6,500), Ve 165 ml;
LM-ACP (18 kDa), Ve 136 ml; Vo 72 ml.
103
7.1. Physiochemical characteristics:
The optimum pH for enzyme activity was 5.5 and pH stability was found between
4.0 - 6.0. The enzyme had optimum temperature around 450C and showed temperature
stability at 50oC. All these results are shown in table 16.
7.2. Determination of Kinetic Parameters:
Km and Vmax against various substrates are reported in table 17. The Km values for
peak 2 were two times higher than the Km values of peak 1 except for phosphotyrosine
where the Km value for peak 2 was six times greater than that of peak 1.
Vmax values showed that FMN was as good substrate as pNPP and phenyl phosphate
especially for peak 2. Taga & Van Etten (1982) noted that FMN was hydrolyzed with
Vmax three times larger at pH 5.0 when compared to pNPP. High specificity for FMN in
LM-ACP from Xenopus laevis (Filburn, 1973) was also noted but the enzyme catalyses
the hydrolysis of FMN at only 84% of the Vmax for pNPP. Our finding was also
consistent with that of Xenopus laevis. Phosphotyrosin was also hydrolyzed at the rate
exhibiting 62% (peak1) and 40% (peak 2) of Vmax for pNPP suggesting that the both
isoenzymes may act as phosphotyrosine protein phosphatases (PTPases).
7.3. Effect of Modifiers on Enzyme Activity
The effect of different modifiers on the both LMW-ACP isoenzymes activity was
studied at 10% concentration of modifiers. Ethanol, methanol, acetone, glycerol and
ethylene glycerol activated two folds increase in the enzyme activity (Table 18)
indicating that low molecular weight acid phosphatases possess phosphotransferase
activity.
104
Table 16:
Some physicochemical characteristics of low molecular weight acid
phosphatase from fish Liver
Physicochemical
Properties
LM-ACP
(18 kDa)
Optimum pH
5.5
Optimum temperature
45˚C
pH stability
4.0-6.0
Temperature stability
50˚C
105
Table 17:
Substrate
Determination of kinetic parameters
Peak 1 isoenzyme
Km (mM)
Vmax (mol
min-1mg-1 )
Peak 2 isoenzyme
Km (mM)
Vmax(mol
min-1mg-1)
pNPP
0.11
9.3
0.23
38.7
Phenyl phosphate
0.16
7.6
0.31
32.1
Phosphotyrosine
0.18
5.8
1.1
15.4
FMN
0.20
8.2
0.41
37.5
106
Table 18: Effect of various modifiers on the low molecular weight acid
phosphatase from fish liver.
Modifiers
Concentrations
(%)
% activity
% activity
of LM-ACP of LM-ACP
peak 1
peak 2
H2O
10
100
100
Acetone
10
219
224
Ethanol
10
110
102
Methanol
10
179
188.7
Glycerol
10
185
183.4
Ethylene glycol
10
160
155.6
107
7.4. Effect of metal ions.
The enzymatic activity of LMW-ACP isoenzymes was measured in the presence of
different metal ions and other compounds by standard assay method at different
concentration of metal ions as shown in table 19. Metal ions such as Ag+, Hg++, Cu++ and
Zn++ showed inhibitory effect on the low molecular weight enzymes. Other divalent ions
like Mg++, Mn++ and Co++ were found ineffective on the enzyme activity. There was no
change in the enzyme activity in the presence of EDTA and Triton X-100, while phydroxymercuric-benzoate and formaldehyde showed strong inhibition.
7.5. Substrate Specificity
The relative hydrolytic rates on different phosphate esters are shown in table 20.
LM-ACP isoenzymes (peak 1 and peak 2) hydrolyzed p-nitrophenyl phosphate, phenyl
phosphate, phosphotyrosin, FMN and β-naphthyl phosphate at significant rates. Other
substrates like α - and β- glycerophosphates, nucleoside phosphates, sugar phosphates
etc. were not hydrolyzed to any significant extent. Thus, both isoenzymes showed very
restricted substrate specificity. This result is comparable to other low molecular weight
acid phosphatase isoenzymes (PTPases) isolated from bovine liver (Ramponi et al.,
1989), bovine heart (Zhang and Van Etten, 1990), bovine brain (Saeed. et al., 1990),
human placenta (Waheed et al., 1988) and rat liver (Manao et al., 1992). The activity
towards the
phosphotyrosine suggests that both isoenzymes may be involved in the
phosphorylation of phosphorylated protein at tyrosine side chain and possessing
phosphotyrosine protein phosphatases (PTPases) as has been found for other low
molecular weight acid phosphatases (Chernoff and Li, 1985; Waheed et al., 1988;
Ramponi et al., 1989; Boivin and Galand, 1986).
108
Table 19:
Effect of different metal ions on activity of low molecular
weight acid phosphatases from fish liver.
Inhibitor
Concentration %age activity
(mM)
of LM-ACP
%age activity
of LM-ACP
pNPP
4
peak 1
100
peak 2
100
ZnCl2
10
22
38
CuSO4
10
3
0
0.2%
10
15
HgCl2
5
0
2
MgCl2
5
101
98.3
MnCl2
5
95
93.29
CoCl2
5
87
75.9
AgNO3
5
0
0
EDTA
10
101
115
P-hydroxy
mercuric benzoate
0.1
2.0
9.0
Triton X-100
1%
98
91.8
Formaldehyde
109
Table 20:
Substrate specificity of low molecular weight acid phosphatase
from fish liver.
%age activity
of LM-ACP
%age activity
of LM-ACP
peak 1
peak 2
p-Nitrophenyl phosphate
100
100
Phenyl phosphate
87
79
Flavin mononucleotide
91
98
-Naphthyl phosphate
3
8
-Naphthyl phosphate
81
70
-Glycero phosphate
15
13
-Glycero phosphate
2
8
Phosphotyrosine
73
35
Phosphoserine
3
0
Phosphothreonine
1
0
Glucose-1-phosphate
0
4
Glucose-6-phosphate
3
8
ATP
0
0
AMP
6
5
UMP
0
1
Substrate
110
7.6. Determination of Ki values:
The activity of low molecular weight acid phosphatase was determined in the
absence and presence of two or three fixed concentration of inhibitors. Their competitive
inhibition constants are presented in table 21. LM-ACP isoenzymes were found to be
insensitive to fluorid and tartrate. Peak 2 isoenzyme was more sensitive to phosphate,
vanadate and molybdate than Peak1 isoenzyme. The same results were found in rat liver
(Fujimoto et al., 1988). Further peak 2 isoenzyme had high affinity for pyridoxal-′5phosphate while peak1 isoenzyme had low affinity for it. Moreover, pyridoxamine -′5phosphate inhibited both isoenzymes but poorly and pyridoxal did not inhibit at all. This
suggests that strong binding of pyridoxal-′5-phosphate to the active site is mediated
through double interaction of two functional groups in the pyridoxal-′5-phosphate (PO4
ester bond and –CHO group) with both phosphate ion binding site and primary amino
group at or near the active site. As observed (Table 21) vanadate and molybdate were
more potential inhibitors than phosphate. These results are consistent with related
observations (Chernoff and Li, 1985; Waheed et al., 1988) that low molecular weight
acid phosphatases possessing phosphotyrosin protein phosphatase activity were strongly
inhibited by orthovanadate or molybdate in the micromolar concentration range.
7.7. Effect of purine and pyrimidine bases
Purine compounds are known to activate low molecular weight acid phosphatases
(Fuijimoto et al., 1988). Their effects on both isoenzymes are shown in table 22. Peak 2
isoenzyme was effectively activated by purine compunds. Guanosine was the most
effective activator, followed by 6-ethylmercaptopurine and cGMP (2.5-3 fold
activations). Guanosine was found better activator than guanine. On the other hand, peak
111
Table 21: Kinetic constants of low molecular weight acid phosphatase
from fish liver.
Compounds
LM-ACP
Ki values
Peak 1
Peak 2
isoenzyme
isoenzyme
Inorganic phosphate
2.7 mM
1.4 mM
Vanadate
138 µM
25 µM
Molybdate
200 µM
80 µM
Pyridoxal-′5- PO4
208 µM
20 µM
Pyridoxalamine-′5-PO4
Pyridoxal
17 mM
13 mM
No inhibition
No inhibition
Fluoride
No inhibition
No inhibition
Tartrate
No inhibition
No inhibition
112
Table. 22
Effect of purine and pyrimidine compounds on the low molecular
weight acid phosphatase from fish liver.
Purine/pyrimidine
compounds (1 mM)
Peak 1 isoenzyme
Peak 2 isoenzyme
Activity (%)
Activity (%)
H2O
100
100
Adenine
76
194
Guanine
84
107
Adenosine
93
134
Guanosine
96
299
6-ethylmerceptopurine
108
281
cAMP
106
126
cGMP
106
250
GMP
104
168
AMP
104
162
ADP
99
118
ATP
95
100
CMP
98
98
UMP
92
96
113
1 isoenzyme was not activated by purine compounds, but was inhibited by adenine or
guanine. The effects of pyrimidine nucleotides on both isoenzyme activities were not
observed. These results are more or less similar to those of rat liver enzymes (Fuijimoto
et al., 1988; Manao et al., 1992; Saeed, 1999; Ramponi, 1994). The increase in rate
produced by purines is structure specific. At least substitution at 6 position of purine
nucleus is essential for large rate enhancement (Tanizaki et al., 1977). 6ethylmercaptopurine is a good example in this case and caused high activation.
Conversely, the phosphorylation of purine nucleoside leads to a progressive decrease in
the extent of activation. AMP caused more activation than ADP whereas ATP resulted in
a complete loss of activation (Table 22). The variation in the extent of activation by
changes in the purine nucleus and by phosphorylation of the nucleoside suggests the
existence of a specific site on the enzyme capable of binding the purine. This binding,
occurring after the formation of the enzyme substrate complex results in an enhanced
catalytic activity through a step that leads to the hydrolysis of covalent phosphoenzyme
intermediate formed during the catalytic process (Cirri et al., 1995; Ramponi and Stefani,
1997). The difference in peak 1 and peak 2 isoenzymes sensitivities to cGMP and very
different peak 2 isoenzyme activation by cGMP and cAMP, suggests that these
isoenzymes are regulated differently in the cell as already discussed in rat liver AcP 1 and
AcP 2 isoenzymes by Ramponi & Stefani (1997).
114
8. Discussion:
From fish liver, we have isolated two types of acid phosphatases belonging to
different molecular weight classes, LM-ACP (18 kDa) and HM-ACP (100 kDa and130
kDa ). Elution profile of acid phosphatases (fish liver extract after ammonium sulphate
fractionation) from Sephadex G-75 chromatography showed the separation of LM-ACP
and HM-ACP in the ratio of 40: 60 % (Fig.1). These results are more or less comparable
to those from other tissues such as bovine liver and stomach (Fujimoto et al., 1984) and
bovine spleen and porcine kidney (Heinrikson, 1969). Bovine liver, rat liver, rat kidney
and other mammalian sources also contain intermediate molecular weight acid
phosphatases in lesser than 10% of total acid phosphatase activity (Fujimoto et al., 1984).
In all tissues, LM-ACP is predominant of the three isoenzymes but in porcine kidney, rat
liver and bovine spleen, HM-ACP present in larger ratios.
The enzymes from the source were purified by methods based differential solubility
techniques ((NH4)2SO4 precipitation), ion exchange chromatography, gel chromatography
and affinity chromatography. SP-Sephadex C-50 ion exchanger failed to bind HM-ACP
while LM-ACP was bound to this ion exchanger as found in the purification of many
LM-ACP -from different sources (Waheed et al., 1988, Fujimoto et al., 1988, Zhang and
Van Etten, 1990, Manao et al., 1992, Saeed et al., 1990, Naz et al., 2006, Siddiqua et al
2008). Taking this into advantage, the scheme was initiated with 30-60% ammonium
sulphate precipitation followed by SP – Sephadex C-50 chromatography resulting in
complete separation of HM-ACP from LM-ACP.
115
HM-ACP (100 kDa isoenzyme) was tried to purify from non-bound fractions of acid
phosphatase from SP – Sephadex C-50 column followed by gel filtration on Sephadex G100 and finally by CM-Cellulose chromatography. Through this purification scheme (I),
we obtained HM-ACP (100 kDa) in partially purified form with specific activity of 0.5
U/mg of protein and 12.5 fold purification was achieved which was unacceptable in any
way. Purification scheme (II) was developed in which SP-Tris acryl column and CMCellulose column were used after fractional precipitations with ammonium sulphate.
With this scheme, the specific activity was increased to 1.96 U/mg of protein. A 45 times
purification was obtained and the yield was also improved from 2.6 to 3.5%.
Scheme for the purification of human liver acid phosphatase as described by Saini and
Van Etten, 1978 was adopted. After repeating (2nd time) of 30-80% ammonium sulphate
precipitation followed by CM-Cellulose chromatography, the enzyme was purified to
some extent and after that DE-52 column failed to bind our enzyme. Several times,
DEAE-cellulose column failed to bind enzyme after CM-Cellulose chromatography. The
same result was obtained with camel liver. The reason is not known, therefore, the
scheme was to be abondand.
In scheme IV, CM-Cellulose, Sephadex G-100 and Reactive Blue columns were used
after SP – Sephadex C-50 chromatography. The results obtained were similar to that
116
obtained from scheme II, but the yield was very less and purification procedure became
lengthened. Thus this scheme was also not applicable.
A new scheme V was developed which was based on 30-80% ammonium sulphate
fractionation, SP – Sephadex C-50, CM-Cellulose, Ultrogel ACA-44 chromatography
and affinity chromatography on concanavalin-A 4-B column. The enzyme was purified
about 368-fold with a specific activity of 14 U/mg of protein and recovery of 3% with
respect to starting material. These values were more or less similar to that reported for
chicken liver (Szalewicz et al., 1997; Asma Saeed et al., 2007). This scheme was
considered as final purification. Single band was detected on SDS-PAGE. The molecular
weight was estimated to be 48 kDa on SDS-PAGE. The molecular weight of native
enzyme obtained by gel filtration on Sephadex G-100 was found to be 100 kDa indicating
that native enzyme contained two subunits identical in molecular weight. Similar results
were also reported for HM-ACP isolated from human prostate (Van Etten and Saini,
1978, Ostanin et al., 1994), rat liver (Igarashi and Hollander, 1968), human liver (Saini
and Van Etten, 1978), and acid phosphatase of Drosophila virilis (Narise, 1984). The fish
liver enzyme is also similar to these HM-ACP in that all are dimmer with molecular
weight of 90-100 kDa and subunits molecular weight of 48-50 kDa.
Another isoenzyme of HM-ACP was purified to homogeneity following the scheme V.
During CM-Cellulose chromatography, unbound fractions showed 100 kDa enzyme
117
while bound enzyme from CM-Cellulose column displayed 130 kDa enzyme which was
further purified by Sephacryl HR – 200 chromatography. The enzyme had specific
activity of 19 U/mg and a recovery of about 4%. About 500-folds purification was
achieved. Single band was seen on SDS-PAGE corresponding to 66 kDa. The molecular
weight obtained by gel filtration on Sephadex G-100 was estimated to be 130 kDa
confirming the existence of dimeric nature of the protein. These results had great
agreement with the findings of acid phosphatases from livers of carp (122 kDa) and frog
(140 kDa) and rice plants (130 kDa) (Janska and Kubicz, 1985, Janska et al., 1988, Tso
and Chen, 1997). Nearly all of the known mammalian acid phosphatases are
heterogeneous glycoproteins and non-mammalian acid phosphatases from liver of carp,
catfish, frog and chicken are also gycoproteins (Szalewicz et al., 1997). The 130 kDa
enzyme from fish liver might be glycoprotein but its purification by affinity
chromatography on concanavalin A- Sepharose 4B column failed which may exhibit
structures weakening Con A binding ability with carbohydrate chains (Siddiqua et al
2008).
Our results of low molecular acid phosphatase isoenzymes are consistent with those of
rat liver (Fujimoto et al., 1988, Manao et al., 1992), bovine brain (Saeed et al., 1990),
chicken liver (Saeed, 1999), uromastix liver (Saeed and Naz, 2003) and chicken heart
118
(Naz et al., 2006) from which two forms of LM-ACP isoenzymes have been isolated
corresponding to IF1 and IF2 types (Ramponi and Stefani 1997).
Two LM-ACP isoenzymes from fish liver have been purified by following the protocol
of Manao et al. 1992 based on (NH4)2SO4 precipitation, SP –Sephadex C-50
chromatography, gel filtration on Sephadex G-75 and affinity chromatography on paraaminobenzyl phosphonic acid derivative of Agarose column which was found to be
critical for enzyme homogeneity as well as for resolution into two isoenzymes. This
affinity gel was also successfully used for the purification of human erythrocytes LMACP (Dissing et al., 1979) and other LM-ACP from bovine brain (Saeed et al., 1990), rat
liver (Manao et al., 1992), chicken liver (Saeed, 1999) and chicken heart (Naz et al.,
2006) that are said to be pure enzymes, homogeneous with molecular weight of 18 kDa.
A total of 0.3 mg of both isoenzymes was obtained from 0.5 Kg with recovery of 0.4%.
The purification factor of peak 2 was as high as 800 fold which was more or less similar
to that of other LM-ACP isolated from rat liver (Fuijimoto et al., 1988; Manao et al.,
1992), uromastix liver (Saeed and Naz, 2003) and chicken liver (Saeed, 1999) but less
than that of enzymes which were purified 5000 and 5700 fold from bovine brain (Saeed
et al., 1990) and bovine heart (Waheed et al., 1988) respectively. Peak 1 isoenzyme
showed specific activity of 15 U/mg of protein while peak 2 had specific activity of 30
U/mg which had smaller values than that of isoenzymes Apase A and Apase B (Fujimoto
119
et al., 1988) or AcP1 and AcP2 (Manao et al., 1992) from rat liver, PTPase A and PTPase
B from chicken liver and peak I and peak II from uromastix liver. The enzymes were
found homogenous as tested by SDS-PAGE and had molecular weight of 18 kDa. The
electrophoretic mobility was the same for both reduced and non-reduced enzymes
indicating that that these isoenzymes were monomeric protein as reported in other small
acid phosphatases. Small acid phosphatases having apparent molecular weights of 14-23
kDa have been purified from human liver (Taga and Van Etten, 1982) bovine liver
(Heinrikson , 1969; Lawrence and Van Etten 1981) and heart (Chernoff and Li 1985).
LM-ACP and HM-ACP can also be distinguished from one another by their rates of
hydrolysis of α- naphthyl phosphate and β-glycerophosphate. HM-ACP hydrolyzed these
two substrates much more efficiently whereas LM-ACP hydrolyzes these at negligible
rates. These results had showed closed resemblance with that obtained from rat liver
(Igarashi and Hollander, 1968), rabbit kidney (Helwig et al., 1978), bovine kidney
(Fujimoto et al., 1984) and human liver (Saini and Van Etten 1978).
The broad substrate specificity of HM-ACP have been reported for many other HM-ACP
isoenzymes (Panara and Pascolini, 1989; Narise, 1984; Saeed et al.,1998). On the other
hand LM-ACP isoenzymes (14-18 kDa enzyme) have very restricted substrate specificity
in that these efficiently hydrolyze p-nitrophenyl phosphate and flavin mononucleotide
only (De Araujo et al., 1976). This result is comparable to other LM-ACP isoenzymes
120
(PTPases) isolated from bovine liver (Ramponi, 1989), bovine heart (Zhang and Van
Etten, 1990), bovine brain (Saeed. et al., 1990), human placenta (Waheed, 1988) and rat
liver (Manao, 1992).The apparent Km for p -nitrophenyl phosphate was estimated to be
0.15 mM for 130 kDa isoenzyme, 0.25 mM for 100 kDa isoenzyme and 0.2 mM for 18
kDa isoenzyme.
HM-ACP and LM-ACP isoenzymes were also differ in sensitivity to different
inhibitors. As reported for mammalian tissues, the fluoride and tartrate are the potent
inhibitors ofHM-ACP. Both HM-ACP isoenzymes were inhibited by fluoride and tartrate
while LM-ACP isoenzymes were found to be insensitive to these known inhibitors as
found in human liver enzymes (Saini and Van Etten, 1978). Formaldehyde and phydroxymercuri-benzoates, a reagent of sulfhydryl groups, showed inhibitions to LMACP as observed in enzymes of human placenta (Di Pietro and Zengerle, 1967) and
bovin brain (Bittencourt and Chaimovich, 1976). HM-ACP isoenzymes were insensitive
to formaldehyde and p-hydroxymercuric-benzoate, thus distinguishing from LM-ACP
(Taga and Van Etten, 1982a; Fujimoto et al., 1988) where these compounds behave
oppositely. Both HM-ACP isoenzymes were also strongly inhibited by phosphate,
orthovanadate, molybdate and pyridoxal-5'-PO4. These results are in accord with the
finding of human liver and wheat germ HM-ACP (Saini, and Van Etten, 1978., Taga and
Van Etten, 1982), human prostate acid phosphatase (Van Etten and Saini, 1978) and 100
121
kDa chicken liver enzyme (Saeed et al., 1998) while pyridoxamine-5'-PO4 showed poor
inhibition.
HM-ACPases and LM-ACPases were deactivated by Hg++, Cu++, Zn++ and
unaffected by Mg++, Mn++ and Co++ Similar results were also obtained with purple acid
phosphatase from starved tomato (Bazzo et al., 2004) and acid phosphatase from rice
plants (Tso and Chen, 1997). EDTA and Triton X-100 had no effect on both molecular
forms of acid phosphatases. These results are in accord with the finding of Panara (1997).
Ethanol, acetone, glycerol and ethylene glycerol slightly inhibited both HM-ACP
isoenzymes indicating that high molecular weight acid phosphatases possess no
phosphotransferase activity while these modifiers activated the LMW-ACP enzyme
indicating phosphotransferase activity of LM-ACP isoenzyme. Such activations had been
reported in many other LM-ACP (Taga and Van Etten, 1982; Fujimoto et al., 1988;
Zhang and Van Etten, 1990; Tanizaki et al., 1977). The enzyme activation observed in
the presence of glycerol or ethylene glycol was explained by the trans-phosphorylation
reaction that competes with hydrolytic reaction of a phosphorylated enzyme intermediate
(Zhang and Van Etten, 1990; Saeed and Naz, 2003; Tanizaki et al., 1977) that reflects a
phosphotransferase activity in LM-ACP only.
122
9.Summary:
HM-ACP from the liver of fish Rohu (Labeo Rohita) were isolated and
purified to homogeneity. The 130 kDa isoenzyme had specific activity of 19.46 U/mg
and a recovery of about 4%. The purification procedure included ammonium sulphate
precipitation and series of chromatography on SP – Sephadex C-50, CM-Cellulose and
Sephacryl HR – 200 columns. 500-folds purification was achieved. The molecular weight
was estimated to be 120-130 kDa by PAGE of native enzyme and 130 kDa by gel
filtration on calibrated Sephadex G-100 column. SDS-PAGE under reduced & non reduced conditions showed a band corresponding to 66 kDa confirming the dimeric
nature of enzyme. p-nitrophenyl phosphate and flavin mononucleotide were hydrolyzed
effectively by the enzyme and found to be good substrates. Optimum temperature for the
enzyme was 50°C and temperature stability was 0° – 50°C. Similarly optimum pH for the
enzyme was 5.4 and pH stability was 4.8 – 6.0. The Km for the p-nitrophenyl phosphate
was estimated to be 0.15 mM. The enzyme was competitively inhibited by the phosphate,
vanadate, molybdate, tartrate, fluoride and pyridoxal-5/-PO4 while pyridoxamine-5/-PO4
showed poor inhibition. Metal ions such as Ag+, Cu++, Zn++ showed strong inhibition on
the enzyme activity while other divalent ions like Mg++, Mn++, Co++ were found to be
poor inhibitors. Modifiers like EDTA, methanol, ethanol, acetone and glycerol had no
effect on the enzyme activity.
An other form HM-ACP was purified about 368-fold by series of chromatography on SP
– Sephadex C-50, CM-Cellulose, Ultrogel ACA-44 and concanavalin-A 4-B column with
specific activity of 14 U/ mg and a recovery of 3%. The molecular weight was estimated
to be 50 kDa by SDS-PAGE. The molecular weight of native enzyme obtained by gel
123
filtration on Sephadex G-100 was found to be 100 kDa indicating the dimeric nature of
protein also. The Km for p- nitrophenyl phosphate at pH 5.5 was 0.25 mM and Vmax was
1.42 µ mol of substrate hydrolyzed /min /mg of protein. The optimum pH for activity was
5.0. The enzyme had optimum temperature around 40°C. The enzyme was inhibited also
by phosphate, tartrate, fluoride, vanadate and molybdate. Competitive type of inhibition
was displayed with Ki values 2.6 mM, 1 mM, 0.29 mM, 35 µM and 20 µM respectively.
Metal ions such as Zn++, Cu++ and Hg++ also showed strong inhibition on the enzyme
activity. The enzyme exhibited broad range substrate specificity. p-nitrophenyl
phosphate, phenyl phosphate, -and -naphthyl phosphate and -glycero phosphate were
found good substrates. Other substrates like phospho-amino acids, nucleoside phosphates
and sugar phosphates were hydrolysed at reasonable rates.
LM-ACP peak 2 was purified to homogeneity. 800 times purification was achieved with
specific activity of 30 U/mg of protein and recovery of 0.2 %. The homogeneity of the
enzyme was checked on SDS-PAGE. The molecular weight of 18 kDa was obtained. The
peak 1 isoenzyme was partially purified about 400 times with specific activity of 15.26
U/mg of protein. Major protein band corresponding to 18 kDa was seen along with other
protein faint bands. LM-ACP isoenzymes were studied for their substrate specificity,
sensitivity to inhibitors or activators and other kinetic parameters. LM-ACP isoenzymes
were not inhibited by tartrate and fluoride but were inhibited by sulfhydryl reagent
whereas HM-ACP was strongly inhibited by fluoride and tartrate. Phosphate vanadate
and molybdate inhibited both types of enzymes competitively, but their action was more
pronounced in HM-ACP enzyme. LM-ACP was effectively activated by purine
compounds whereas HM-ACP was not. LM-ACP showed strict substrate specificity
124
while HM-ACP showed broad substrate specificity. The two types of acid phosphatases
also differed in their rate of hydrolysis of α-naphthyl phosphate and β-glyerophosphate.
125
10. REFERENCES:
Asma Saeed, Shah A.H., Khan A.R. and Saeed A., (2007) Jour. Chem. Soc .Pak.,
29, 364.
Baxter, J.H. and Suelter, C.H. (1984). Arch. biochem. Biophys. 228, 397-406.
Bazzo G. C., Raghothama K. G. and Plaxton W. C., (2004). Biochem.J., 377,
419.
Beck J.L., Mc Conacline L.A., Summors A.C., Arnold W.N., De Jersey A. and
Zerner B. (1986). Biochim. Biophys. Acta, 869, 61-68.
Beisenherz, G., Boltze, H. J., Bucher, T., Czok,R., Garbade, K.H., Meyer-Arendt,
E. and Pfleiderer, G. (1953). Z. Naturforsch B 8, 555 - 557.
Bittencourt H.M.S., Chaimovich H., (1976). Biochim. Biophys. Acta, 438,153158.
Black, M. J. and Jones, M.E. (1983). Anal. Biochem. 135, 233-238.
Caselli, A., Cirri, P., Bonifacio, S., Manao, G., Camici, G., Cappugi, G., Moneti,
G. and Ramponi, G. (1996). Biochim. Biophys. Acta. 1290, 241-249.
Caselli,A., Casolaria, M., Ranaldi, F. Manao, G., Camici, G. and Giachetti, E.
(2007). Biophys.Chem. 125, 435-443.
Chernoff, J. and Li, H.C. (1985). Arch. Biochem. Biophys. 240, 135-145.
Cho, H., Krishnaraj, R., Kitas,E., Bannwarth.W., Walsh, C.T. and Anderson, K.S.
(1992), J.Am.Chem.Soc. 114, 7296-7298.
Ciancaglini, P., Pizauro, J.M., Rezende, L.A. and Leone, F.A. (1990).
Int.J.Biochem. 22, 385-392.
Cirri, P. Chiarugi, P., Camici, G., Manao, G., Pazzagli, L., Caselli, A., Barghini,
I., Cappugi, G., Raugei, G. and Ramponi, G. (1993). Biochim. Biophys. Acta
1161, 216-222.
Cirri P., Caselli A., Manao G., Camici G., Polidori R., Cappugi G., Ramponi G.
(1995). Biochim. Biophys. Acta, 1243,129-135.
Cohen, P.A. (1989) Annu.Rev.Biochem .58, 453-508.
126
De Araujo, P.S., Mies, V. and Miranda, O.(1976). Biochem. Biophys. Acta
452,121 -130.
Derechin, M., Ostrowski, W. Galka, M. and Bernard, E. (1971). Biochem.
Biophys.acta. 250, 143-154.
Di Pietro, D.L. and Zengerele, F.S. (1967). J. Biol. Chem. 242, 3391 – 3396
Dissing J., Dahl O., Svensmark O. (1979). Biochim. Biophys. Acta, 569,159-176.
Durmas, a., Eicken, C., Sift, B.H., Kratel, A., Kappl, R., Huttermann, J. and
Krebs, B. (1999). Eur.H.Biochem. 260, 709-716.
Egloff, M.P., Cohn, P.T.W., Reinemer, P. and Barford, D. (1995). J.Mol.Biol.
254, 942-959.
Fujimoto, S., Nakagawa, T. and Ohara, A. (1977) Agri.Biol.Chem. 41, 599-600.
Fujimoto, S., Urata, Y.; Nakagawa, T. and Ohara, A: (1984). J.Biochem. 96, 1079
-1088.
Fujimoto S., Murakami K., Ishikawa A., Himi K., Ohara A., (1988). Chem.
Pharm. Bull., 36, 3020-3026.
Fujimoto, S., Gotoh, H., Ohbayashi, T., Yazaki, H. and Ohara, A. (1993). Biol.
Pharm. Bull. 16, 745 – 750.
Garcia N. A. T., Olivera M., Iribarne C. and Lluch C., (2004) Plant Physiol.
Biochem., 42, 585.
Golgberg, J., huang, H.B., Kwon, Y.G., Greengard,P., Nairn, A.C. and Kuriyan, J.
(1995). Nature. 376, 745-753.
Griffith, J.P., Kim, J.L., Kim, E.E., Sintchak, M.D., Thomson, J.A., Fitzgibbon,
M.J., Fleming, M.A., Caron, P.R., Hsiao, K. and Naria, m.A. (1995) Cell. 82,
507-522.
Guan, K.J. and Dixan, J.E. (1991), J.Biol.Chem. 266. 17026-17030.
Hefler, S. and Averill, B.A. (1987). Biochem.Biophys.Res.Commun. 146, 11731177.
Heinrikson, R.L. (1969). J.Biol. Chem. 244, 299-307.
127
Helwig, J.J., Farooqi, A.A., Bollack C. and Mandel, P. (1978) J.Biochem. 175,
321.
Igarashi, M. and Hollander, P.W. (1968). J. Biol. Chem. 243 ,6084 – 6089.
Janska H., Kubicz A., (1985). Comp. Biochem. Physiol., 82B, 563-567.
Janska H., Kubicz A., Szalewicz A. and Harazna J., (1988). Comp. Biochem.
Physiol., 90B, 173.
Jing G., Li L., Li Y., Xie L. and Zhang R., (2006) Comp. Biochem. Physiol.,
143B, 229.
Kaida R., Hayashi T. and Kaneko T.S. (2008). Phytochem. 69, 2548-2551.
Kim, D.W., Hong, J.W., Eum, S.W., Choi, H.S., Choi, S.H., Kim, S.Y., Lee, B.R.,
Ann, J.J., Lee, S.H., Lee, S.R., Kwon, O.S., Kwon, H.Y., Cho, S.W., Lee, K.S.,
Park, J. and Choi, S.Y. (2005). J. Biochem. Mol. Bio. 38, 58-64.
Kissinger, C.R., Parge, H.E., Knighton, D.R., Lewis, C., Pelletier, l.A. Tempezyk,
A., Kalish, V.J., Tuker, K.D., Showalter, R.E. and Moomaw, E.W. (1995).
Nature. 378, 641-644.
Kostrewa D., Wyss M., D'Arcy A. and Van Loon A.P.G.M., (1999) J. Mol. Biol.,
288, 965.
Laemmli, U.K. (1970). Nature 277 , 680 – 685.
Lawrence, G.L., and Van Etten, R.L. (1981). Arch. Biochem. Biophys. 206, 122131.
Lin, M.F., Lee C.li , Steven , S.L. and Chu, T.M.(1983). Biochemistry 22,10551062.
Lineweaver, H. and Burk, D.J. (1934). Am. Chem. Soc. 56 , p. 658.
Magboul, A.A.A. and Mc Sweeney (2006). Theriogenology. 66, 2152-2159.
Manao G., Pazzagli L., Cirri P., Caselli A., Camici G., Cappugi G., Saeed A.,
Ramponi G., (1992). J. Prot. Chem., 3, 333-345.
Merkx, M. and Averilli, B.A. (1998) Biochemistry. 37, 11223-11231.
Moss, D.W., Raymond, F.D.and Wile.D.B. (1995). Crit.Rev.Clin.Lab.Sci. 32,
431-467.
Mumby, M.C. and Walter, G. (1993). Physiol. Rev.73, 673-699.
128
Narise S., (1984). Insect Biochem., 14, 473-480.
Naz R., Saeed A., Asma Saeed, (2006).The Protein J. 25,135-146.
Ostanin K., Saeed A. and Van Etten R. L., (1994). J. Biol. Chem., 269,8971.
Ostrowski, W. (1968). Acta. Biochem.Polonica. 15, 213-225.
Panara, F., Angiolillo. A. and Pascolini. R.(1989). Comp. Biochem. Physiol.,
92B: 751-754.
Panara, F., Angiolillo. A. and Pascolini. R.(1989) Comp. Biochem. Physiol. B.
93. 877-882.
Panara, F., Angiolillo, A., Fagotti, A., Rosa, I.D., Francesca, S. and Pascolini, R.
(1992). Int. J. Biochem. 24, 1619 – 1623.
Panara, F., Angiolillo, A., Fagotti, A., Rosa, I.D. and Pascolini, R. (1993). Trends
in Comp.Biochem. and Physiol. 1, 675-692.
Panara, F. (1997). J. Fish. Biol. 51 , 275 – 283.
Pizauro, J.M., Ciancaglini, P. and Leone, F.A. (1993). Biochem.Biophys.Acta.
1202, 22-28.
Ramponi G., Manao G., Camici G., Cappugi G., Ruggiero M., Bottaro B.P.,
(1989). FEBS Lett., 250, 469-473.
Ramponi, G., Adv. Prot. Phosphatases, 8, 1-25 (1994).
Ramponi, G. and stefani, M. (1997). Biochem. Biophys. Acta 1341, 137-156.
Saeed A., Tremori E., Manao G., Camici G., Cappugi G., Ramponi G., (1990).
Physiol. Chem. Phys. Med. NMR, 22, 81-94.
Saeed A., Khan A. R., Naz R. and Hassan M., (1998). Pak .J. Sci .Ind. Res., 41,
264.
Saeed A., (1999). Jour. Chem. Soc. Pak. 21, 311-320.
Saeed A. and Naz R., (2003) “Protein Structure-Function Relationship,”ed. by
Abbasi A., Abid Ali S., BCC& T Press,University of Karachi,Karachi, pp.87-98.
Saini, M.S and Van Etten, R.L. (1978) Arch. Biochem. Biophys. 191, 613-624.
129
Sambrook, J., Fritisch E.F. (1989) Molecular Biology: a laboratory manual, cold
spring Harbor, Laboratory press.
Schwartz, J.H. and Lipmann, F. (1961). Proc. Natl. Acad. Sci. U.S.A. 47, 19962005
Shan, J. (2002). Dissertation, Research Center for Molecular Endocrinology.
Faculty of Medicine, University of Oulu, Oulu,Finland.
Siddiqua, A., Rehmat, M., Asma Saeed, Amin, S., Naz, R., M. Sherazi, Khan G.
M. and Saeed, A. (2008). Biol. Pharm. Bull., 31, 802-808.
Strater, N., Klabunde, T., Tucker, P., Witzel, H. and Krebs, B. (1995) Science.
268, 1489-1492.
Sugiura, Y., Kawabe, H. and Tanaka, H. (1981). J.Am.Chem.Soc. 102, 6581-6582.
Sugiura, Y., Kawabe, H., Tanaka, H., Fujimoto, S. and Ohara, A.(1981). J. Biol.
Chem. 256, 10664-10670.
Szalewicz A., Grabska T., Kubicz A., (1997). Comp. Biochem. Physiol., 117B,
293-298.
Taga E.M. and Van Etten R.L. (1982). Arch. Biochem. Biophys., 214, 505-515.
Tanizaki M.M., Bittencourt H.M.S., Chaimovich H. (1977) Biochim. Biophys.
Acta, 485,116-123.
Tso S. C., Chen Y. R., (1997) Bot. Bull. Acad. Sin., 38, 245.
Tsuda, J., Kimura, T., Tanino, H., Schimohama, S. and Fujimoto, S. (1998). Biol.
Pharm. Bull. 21, 1218 – 1221.
Uehara, K., Fujimoto, S. and Taniguchi, T.(1974). J. Biochem. (Tokyo) 75,627638.
Van Etten, R.L., and Mc Tigue, J.J. (1977). Biochim. Biophys. Acta 484, 386397.
Van Etten, R.L. and Saini, M.S. (1977) Biochim. Biophys. Acta 484,487-492.
Van Etten R.L. and Saini M.S. (1978). Clin. Chem., 24, 1525-1530.
Van Etten, R. L. (1982). Ann. NV. Acad. Sci. 390, 27-51
130
Vihko, P., Kontturi, M. and Korhonen, L.K.(1978). Clin.Chem. 24, 466-470.
Vincent, J.B., Olivier-Lilley, G.L. and Averill, B.A.(1990) Chem.Rev. 90, 14471467.
Vincent, J.B., Crowder, M.W., and Averill, B.A.(1992).Trends Biochem. Sci.
17,105-110.
Waheed A., Laidler P.M., Wo Y.Y.P., Van Etten R.L., (1988). Biochemistry 27,
4265-4273.
Weber K. and Osborn M., (1969) J. Biol. Chem., 244, 4406.
Wera, S. and Hemmings, B. A.(1995). Biochem. J. 31, 17-29.
Wo, Y.Y., Zhou, M.M., Stevis, p., Davis, J.P., Zhang, Z.Y. and Van Etten, R.L.
(1992). Biochemistry, 31, 1712-1721
Wysocki, P. and Strzezek, J. (2006). Theriogenology 66, 2152-2159.
Yam, L.T. (1974). Am. J. Med.56, 604-616.
Zhang Z.Y. and Van Etten R.L. (1990). Arch. Biochem. Biophys., 282, 39-49.
Zhou R., Cheng L. and Wayne R., (2003) Plant Sci., 165, 227.
131
LIST OF PUBLICATIONS
1. Acid phosphatases from the liver of Labeo rohita:- Purification and
characterization.
Aisha Siddiqua, Mamoona Rehmat, Asma Saeed, Shazia Amin, Rubina Naz,
Mehrin Sherazi, Gul Majeed Khan and Ahmad Saeed.
Biol. Pharm. Bull. 2008, 31, 802-808.
2. 130 kDa acid phosphatase from the liver of Labeo Rohita: Isolation,
Purification and some kinetic properties
Aisha Siddiqua, , Mehrin Sherazi, Rubina Naz, Irshad Ali, Asma Saeed, Abdul
Haleem Shah, Abdur Rahim Khan, Mushtaq Ahmad, Hidayat Ullah Khan, and
Ahmad Saeed
Jour. Chem. Soc. Pak. 2009, 31, 801-808.
3. Partial purification and biochemical properties of acid phosphatase from
Rohu fish liver
Aisha Siddiqua, Asma Saeed, Rubina Naz, Mehrin Sherazi, Shazia Ameen and
Ahmad Saeed
Int.J.Agr.&Biol. 2012, 14(2), 223-228.
132
Academia.edu no longer supports Internet Explorer.
To browse Academia.edu and the wider internet faster and more securely, please take a few seconds to upgrade your browser.
Isolation, Purification And Characterization Of Acid Phosphatases From Rohu (labaeo Rohita) Fish Liver
2012
...Read more
Related Papers
… Journal of Agriculture …, 2012
Download

Biological & Pharmaceutical Bulletin, 2008
Download

Asian Journal of Biochemistry, 2011
Download
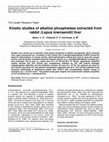
Comparative biochemistry and physiology. B, Comparative biochemistry, 1989
Download

Comparative biochemistry and physiology. B, Comparative biochemistry, 1988
Download

Download

Journal of the Chemical Society of Pakistan, 2012
Download


Education Sciences, 2024
Download

Download


Download


Women: A Cultural Review
Download

Espaces sacrés et environement, 2024
Download
