Sustainable Cities and Society 48 (2019) 101508
Contents lists available at ScienceDirect
Sustainable Cities and Society
journal homepage: www.elsevier.com/locate/scs
Public perceptions from hosting communities: The impact of displaced
persons on critical infrastructure
T
Felipe Arayaa, , Kasey M. Faustb, Jessica A. Kaminskyc
⁎
a
Civil, Architectural and Environmental Engineering, The University of Texas at Austin, 301 Dean Keeton C1752, Austin, TX 78751, USA
Civil, Architectural and Environmental Engineering, The University of Texas at Austin, 301 Dean Keeton C1752, Austin, TX 78751, USA
c
Civil and Environmental Engineering, The University of Washington, 121H More Hall, Seattle, WA 98195, USA
b
A R T I C LE I N FO
A B S T R A C T
Keywords:
Public perceptions
Displaced persons
Statistical analysis
Water
Wastewater
Transportation systems
In 2016, there were over 65 million people around the world forcibly displaced. Such a massive displacement of
population creates challenges for host communities trying to provide them infrastructure services. For example,
no front-end planning or construction may be possible given the unexpected nature of disaster events. This study
assesses host communities’ public perceptions, at both city and national scales, of displaced persons’ impacts on
water, wastewater, and transportation systems. This study draws on data gathered through a survey deployed in
August 2016 to the public in Germany, where approximately 722,000 people sought refuge the same year.
Statistical analyses show that heterogeneous drivers of public perceptions include both geographic and demographic parameters. Nonparametric tests reveal that the public perceived the impact on infrastructure systems
similarly within city and national scales, but differently across. It is hypothesized here that the difference is due
to residents perceiving this group of infrastructure systems as a system-of-systems that is part of their built
environment. If we understand how hosting communities perceive the impacts of displaced persons, we may gain
insights into perceived infrastructure disruptions. With such insights, we may assist policy-makers and engineers
in planning locally acceptable infrastructure alternatives to integrate displaced population.
1. Introduction
In 2016, 65.6 million people around the world were forcibly displaced (including internally displaced persons, asylum seekers, and
refugees). Compared to five years earlier (2011) this was a 50% increase (UNHCR, 2017). Of these 65.6 million, approximately 25.3
million were either refugees or asylum seekers (UNHCR, 2017). Historical drivers of displacement include, but are not limited to, persecution, violence, and natural disasters. Recent events resulting in mass
displacement include the Syrian Arab Republic War (UNHCR, 2015a),
the Iraq War (UNHCR, 2015b), and, in the United States, Hurricanes
Katrina (Mitchell, Esnard, & Sapat, 2012; Sterett, 2011) Irma, and
Harvey (Hendry & Regan, 2017; Sullivan, Samuels, & Wax-Thibodeaux,
2017).
In 2016, and primarily due to instability in the Middle East, the
European Union (EU) received a record 1.2 million first-time asylum
applications. Receiving most of these was Germany, the context of this
study. It received 722,000 applications (approximately 60%; Eurostat,
2017). In 2017, the number of displaced persons continued to rise,
reaching approximately 68.5 million people (UNHCR, 2018). In the EU,
⁎
Germany again received the most applications (approximately 200,000;
Eurostat, 2018).
These asylum seekers were distributed throughout the nation, and
thereby to different infrastructure systems using a quota system that is
“calculated at the federal level on an annual basis by the FederationLänder Commission” (BAMF, 2017). For each federal state, asylum
seekers are distributed based on a system that weights the total population by one-third and the tax revenue by two-thirds (Katz, Noring, &
Garrelts, 2016). The distribution system has some disadvantages; it fails
to account for a region's population density, housing availability, or the
fact that “individuals may attempt to settle in regions other than those
assigned” (Katz et al., 2016, p. 11). As such, the system is unable to
capture potential secondary migration patterns. Similarly, the system
fails consider the status or capacity of the existing infrastructure systems that serve those regions, assuming that they will be able to provide
infrastructure services to both, existing and incoming new users.
It is important to note that the challenge of receiving displaced
persons is not isolated to the EU, and is likely to become a global issue,
one that will call for innovative solutions (Dabaieh & Alwall, 2018). For
instance, in 2015 the United States received 262,000 first-time asylum
Corresponding author.
E-mail addresses: felipe.araya@utexas.edu (F. Araya), faustk@utexas.edu (K.M. Faust), jkaminsk@uw.edu (J.A. Kaminsky).
https://doi.org/10.1016/j.scs.2019.101508
Received 6 December 2018; Received in revised form 8 March 2019; Accepted 12 March 2019
Available online 21 March 2019
2210-6707/ © 2019 Elsevier Ltd. All rights reserved.
�Sustainable Cities and Society 48 (2019) 101508
F. Araya, et al.
end-user perceptions while managing infrastructure projects and systems (Knoeri, Steinberger, & Roelich, 2016; Valentin et al., 2017). To
do this, project managers need to have a grasp of public perceptions in
the aggregate. Moreover, they need to understand the locational and
socio-demographic drivers (e.g., location, age, income) of heterogeneity
in perceptions that may trigger the support or opposition of infrastructure projects in communities.
The assessment of public perceptions from hosting communities is
done in the context of place attachment theory. Place attachment
theory suggests that when a community is disrupted their residents may
develop negative sentiments toward the disruptor (Devine-Wright,
2009). Place attachment literature focused on the effects of disruptions
at the household or neighborhood level (Lewicka, 2011). When it comes
to assessing the influence of disruptions at higher scales of analysis such
as at city or national level, there is a gap in the literature. This study
aims to explore the perceived impact of hosting communities on infrastructure systems at the city and national scales. The study provides
avenues with which researchers can target information on key sociodemographic groups, gather feedback from those opposing projects,
and tailor alternatives to fit the unique needs and culture of each project context. Furthermore, researchers can use public perceptions to
explore the effectiveness of existing systems and identify locations that
call for infrastructure alternatives.
Given this research context and the critical need to provide infrastructure services to displaced populations, this study poses the following questions: How do public perceptions of infrastructure systems—water, wastewater, and transportation—vary according to
system and across city and national levels? What are the drivers of such
perceptions? How does the perceived impact of displaced persons vary
by location and scale (city versus country)?
applicants, of whom more than 50% were from Mexico or countries in
Central America (UNHCR, 2017). In other words, the technical issues
involved in hosting displaced persons such as accommodating increased
demand for water and housing resources or the costs of additional infrastructure are globally and domestically relevant (UNHCR, 2016,
2017, 2018).
Any rapid influx of population creates additional and unexpected
demands on infrastructure systems. These demands could impact the
services received by existing end users (Varis, Biswas, Tortajada, &
Lundqvist, 2006) as well as the displaced population. Authors of infrastructure assessment often focus on the physical components of infrastructure systems. Yet what populations value most about these
systems are the services they provide (Little, 2002). It is critical then to
understand how users perceive changes in their infrastructure services
caused by displaced persons in addition to understanding the technical
impact they have on infrastructure systems. Another challenge in this
regard is distinguishing between how end users perceive changes in the
infrastructure services and how experts assess those infrastructure services (de Franca Doria, Pidgeon, & Hunter, 2005, 2009). In the case of
water quality, while a population's water supply might meet technical
standards, residents may reject it due to esthetic attributes (Jardine,
Gibson, & Hrudey, 1999).
Population growth and urbanization have caused residents to perceive impacts on such infrastructure services as water, wastewater, and
transportation infrastructure systems (Islam, Rana, & Ahmed, 2014). In
fact, residents were highly dissatisfied with the perceived changes.
What is interesting, though, the levels of dissatisfaction were not distributed homogeneously among the dwellers, as such, within the same
city, residents from different locations manifested different levels of
dissatisfaction (Islam et al., 2014). However, a gap exist in understanding how a disruption caused by hosting displaced persons might
influence public perceptions of the impacts such hosting communities
has on multiple infrastructure systems—e.g., water, wastewater, and
transportation. This topic is becoming increasingly important due to a
rise in the frequency and severity of disasters (Bier, 2017; Faust &
Kaminsky, 2017; Mitchell et al., 2012; Sterett, 2011). Consider, for
instance, the following: In 2015, approximately 850,000 refugees arrived in Greece (OPRS, 2019); in 2017 after Hurricane Maria over
130,000 people arrived in Florida (Sutter, 2018); in 2018 after California's most destructive forest fire ever, approximately 50,000 displaced people arrived in—towns near Campfire (Phillips, 2018); between 2015 and 2018 approximately three million Venezuelans
migrated to nearby Latin American countries (UNHCR, 2019). This
paper contributes to the limited literature dealing with the impact,
actual and perceived, of displaced populations on infrastructure systems. The paper's focus is on the water, wastewater, and transportation
systems because this study examines the impact on critical infrastructure systems whose services community members share. The way
individuals interact with these systems, in real time, can cascade to
impact the level of service for other users.
In addition to the influence of population dynamics on public perceptions of infrastructure projects (e.g., wind energy projects, coal, and
nuclear power plants), these perceptions are also influenced by the
perceived costs (e.g., environmental harm; Ansolabehere & Konisky,
2009; MIT, 2003, 2007; Valentin, Naderpajouh, & Abraham, 2017). If a
community perceives an infrastructure project to be a cost, they are
likely to oppose it. Interestingly, infrastructure projects facing public
opposition have faced different risks such as negative impacts on projects’ budget, schedule, and scope (DiChristopher, 2017; Hurlimann &
Dolnicar, 2010; Valentin et al., 2017). Therefore, the way communities
perceive potential costs from developing infrastructure projects influences their public attitudes toward such projects.
These perceptions then may complicate management aspects of infrastructure projects, which given their size and scope, are traditionally
considered complex projects. Therefore, if project managers want to
mitigate challenges posed by public opposition, they need to include
2. Literature review
In this literature review, we frame population displacement as an
instance of extreme population dynamics caused by a disaster event.
When displaced populations move to a geographically distinct infrastructure system, there are significant technical implications for the
recipient system due to increased loads. If infrastructure managers fail
to manage these changes, real or perceived reductions in levels of service may result. To service incoming displaced persons, cities may
propose infrastructure projects, but the public, already dissatisfied with
their service, may protest these projects or even try to negatively impact
the integration of the displaced population. Researchers have yet to
fully study this important type of secondary disaster impact and its
consequences on infrastructure systems.
2.1. Population dynamics and infrastructure services
Extreme population dynamics present a challenge for infrastructure
systems. The technical capacity of infrastructure systems may be
overburdened, ultimately affecting the level of service provided to endusers (Varis et al., 2006). Displacement-induced growth is certainly
different from typical population growth, which occurs more slowly
and predictably. Still, there are similarities due to increases in the loads
placed on the existing infrastructure systems that provide insights into
the impacts of the more extreme cases. For example, water and wastewater infrastructure may be strained as they are pushed to meet water
demands (Dawadi & Ahmad, 2013); municipalities; ability to provide
sanitation and water services may be constrained by limited water resources (Van der Bruggen, Borghgraef, & Vinckier, 2010). Previous
studies of transportation systems have also identified challenges imposed by population dynamics such as traffic congestion (Kolankiewicz,
Griffith, Camarota, & Beck, 2015) and growth in required maintenance
activities (Asoka, Thuo, & Bunyasi, 2013). Overall, these studies have
shown that infrastructure managers must contend with a variety of
uncertainties when coping with population dynamics (Zeferino,
2
�Sustainable Cities and Society 48 (2019) 101508
F. Araya, et al.
displaced populations was found to be mustering support from hosting
communities to provide such services. Disaster migration is of course
unexpected and typically lacks front-end planning (Faust & Kaminsky,
2017). Given this gap in the literature, this paper examines then impact
that displaced persons have on hosting communities’ perceptions of
water, wastewater, and transportation infrastructure services, in the
context of disaster response that is geographically distinct from the
primary disaster event.
Antunes, & Cunha, 2012). And post-disaster population displacement is
no exception. However, little research has been done on the impact of
hosting a sudden population influx on infrastructure systems from
hosting communities.
2.2. Disasters events and construction
Researchers have assessed reconstruction, recovery, and resiliency
aspects of construction projects in such disaster scenarios as earthquakes or typhoons (e.g., El-Anwar & Chen, 2012; Opdyke, Lepropre,
Javernick-Will, & Koschmann, 2017; Sun & Xu, 2010). These previous
studies may be divided into two categories: (1) literature assessing the
impact of the disaster at the same location of the disaster, and (2)
cascading impacts of the disaster on locations geographically distinct
from the disaster.
Research from the former group has focused on reconstruction
projects and primarily on three areas: factors influencing the performance of the projects (e.g., Johnson, Lizarralde, & Davidson, 2006),
optimization of resources during a reconstruction project (e.g., Orabi,
El-Rayes, Senouci, & Al-Derham, 2009), and interaction among resources and stakeholders (e.g., Hwang, Park, Lee, Lee, & Kim, 2014).
Previous studies that investigated factors affecting reconstruction projects assessed the influence of different organizational and technical
systems in housing projects. Johnson et al. (2006) found that the performance of reconstruction projects is influenced by the organizational
design of the project teams and programs. Project managers should
consider these organizational aspects to be as important as the technical
design of the reconstruction project. Other studies developed models to
estimate the time and cost associated with the reconstruction project
after an earthquake (Sun & Xu, 2010). Hwang, Park, Lee, and Lee
(2016) modeled uncertain conditions of the facility restoration-planning activities.
A second aspect of previous research has concerned optimizing resources during reconstruction projects. Orabi et al. (2009) studied a
recovery-planning model for a transportation network. The authors
used a multi-optimization model to minimize the performance loss and
reconstruction costs while facing limited resources during the planning
of the recovery project. El-Anwar, El-Rayes, and Elnashai (2009) considered the evaluation of the housing's configuration to maximize the
sustainability aspects of housing reconstruction projects. Hosseini, de la
Fuente, and Pons (2016) studied the location of post-disaster projects in
urban areas. The authors found that decision makers may optimize the
location based on variables such as the cost or building methods. ElAnwar and Chen (2012) proposed another technique—considering
displacement distance for temporary housing projects to optimize a
displaced family's needs under budgetary constraints.
The third segment of this literature—the interaction among resources and stakeholders—has focused on the role government plays in
recovery efforts. Hwang et al. (2014) highlighted the fundamental role
governments play during the design of recovery plans. Similarly,
Opdyke et al. (2017) studied the value of information in recovery efforts. These authors found that the most common resource shared under
disaster conditions is information. They also reaffirmed, consistent with
findings from Hwang et al. (2014), how central a role government’
agencies play in recovery. Arneson, Deniz, Javernick-Will, Liel, and
Dashti (2017) examined information deficits in post-disaster situations
and its role among community stakeholders. The authors found that
information deficits fall into five categories, including stakeholder coordination, data management, and social disengagement.
In contrast to the plethora of resarch cited above, there is limited
research on the cascading effects of a response that is geographically
distinct from the location of the disaster. In the context of the resiliency
of water and wastewater systems, Faust and Kaminsky (2017) leveraged
knowledge from experts, to find that disaster migration poses challenges to the provision of infrastructure services to hosting communities. One obstacle to providing new infrastructure services to
2.3. Stakeholders and construction projects
When it comes to building and infrastructure projects, the construction engineering literature has long recognized the importance of
interactions between stakeholders as well as their perceptions. Previous
research has assessed the impact of stakeholders on project management (e.g., Herazo & Lizarralde, 2016; Olander, 2007), the role of
stakeholders in contributing to the uncertainty of infrastructure projects
(e.g., Ward & Chapman, 2008), and stakeholder roles in achieving
sustainable civil infrastructure systems (e.g., Hendricks et al., 2018;
Mostafa & El-Gohary, 2014; Prouty, Koenig, Wells, Zarger, & Zhang,
2017). Olander (2007) proposed an approach to evaluating the needs
and expectations of stakeholders regarding housing projects. To avoid
reactive management and the making of ill-informed decisions, Olander
(2007) highlighted the need to proactively assess stakeholder views.
Finally, Olander suggested the assessment of stakeholder management
across different stages in the execution of construction projects. Ward
and Chapman (2008) stated that a major source of uncertainty in projects are stakeholder roles, and these must thus be clearly defined.
Mostafa and El-Gohary (2014) proposed a model to evaluate the collective benefits of infrastructure project alternatives for stakeholders.
They proposed a plan to integrate participatory actions into the decision-making process. Leung, Yu, and Liang (2013) studied the relationship between stakeholders’ power, conflict, interest, and satisfaction with a project. These authors found that conflict among
stakeholders, as well as the level of final satisfaction with the project,
are influenced by the power and interest held by stakeholders. Concerning the engagement process of stakeholders in construction projects, their engagement prior to the decision-making process has been
crucial for projects success (Eschenbach & Eschenbach, 1996; Li, Zhang,
Ng, & Skitmore, 2018; Li, Ng, & Skitmore, 2013; Valentin, Naderpajouh,
& Abraham, 2018). Moreover, incorporating stakeholders impacted by
construction projects during the early stages helps project implementation go smoothly (Yang & Shen, 2014).
In summary, these studies demonstrate that when project managers
fail to account for or misunderstand the role stakeholders they face
greater challenges. Indeed, the efficacy and successful completion of a
project are associated with the perceptions and attitude of the stakeholders impacted. As such, integrating public perceptions into project
decision-making has become an increasingly important strategy used to
support project success and minimize public protest.
2.4. Public perceptions and project protest
For engineers, the level of service received by end users is defined
by technical metrics such as water pressures or traffic congestion. End
users themselves, however, often take no account of the metrics focusing instead on changes in levels of service (Little, 2002; Yang &
Faust, 2019). Examples of these changes could be a drop in water
pressure, a difference in taste of tap water, or longer commutes. When
service has changed, regardless of whether it is within the acceptable
levels set by regulatory standards or utility expectations, complaints (or
increased satisfaction, if these changes are improvement) arise.
Hosting displaced persons and the related increased demands for
infrastructure services may cause temporary or permanent changes in
the infrastructure systems. Regardless of the time frame, though, the
sudden arrival of displaced persons creates immediate and increased
3
�Sustainable Cities and Society 48 (2019) 101508
F. Araya, et al.
research on perceptions typically provides cross-sectional representations, perceptions are dynamic, and change with new information, and
events. Still, in the context of public policies and decision-making, there
is evidence that even cross-sectional insights into public perceptions
can identify (and potentially minimize) sources of opposition due to the
intrinsic interrelation between policy and public perceptions (Burstein,
2003; Gray, Lowery, Fellowes, & McAtee, 2004; Soroka & Wlezien,
2004). For example, Jorgensen, Graymore, and O’Toole (2009) explored the impact of public voice on water-utility initiatives, finding
that the level of trust of end users may play a fundamental role in water
consumption and can be used by water utilities to develop water consumption initiatives. Other studies have found that end users perceptions and trust in the water utility provider impacts their water consumption and perceived quality (Doria, 2006; de Franca Doria et al.,
2009).
Another potential influence of variation in the study of public perceptions in hosting communities is the use of different geographical
units of analysis. Previous studies have addressed the potential effects
of differing geographical scales, such as the relationships among the
scales of interest to resolve a problem within the community, or the
influence of the sense of community on the perception of community
disruptors. Kingston, Carver, Evans, and Turton (2000) stated that
when the geographic scale increases in size (e.g., from city to country),
a smaller portion of people directly affected by the problem will sustain
interest and continue working to resolve the problem. The literature
suggests that, from an individual perspective, when people have lived
in a place over time, they develop a positive emotional link with it,
known as place attachment (Clarke, Murphy, & Lorenzoni, 2018; DevineWright, 2007, 2009). The development of these feelings of attachment
are influenced by attributes such as the length of time in a dwelling
(Brown & Perkins, 1992), education (Anton & Lawrence, 2014), personal experience with the living environment (Clarke et al., 2018), and
perceptions and evaluations of the place (Rollero & De Piccoli, 2010).
Sometimes the concept of the community is more relevant than the
individual. Researchers Kasarda and Janowitz (1974) and Perkins and
Long (2002) refer to this phenomena as community attachment. Disruptions affecting that location can lead to negative sentiments or opposition toward the disruptors (Devine-Wright, 2007, 2009).
Existing literature has reported that residents’ perceptions of community disruptions can interact with different levels of place-attachment sentiments. This has occurred in the context of different disruptors
such as implementing alternatives to mitigate climate change or urban
growth. Such interactions have resulted in communities showing either
public support or opposition toward these disruptions on communities
(Devine-Wright, 2013; Hovelsrud, Karlsson, & Olsen, 2018; Verbrugge
& Van Den Born, 2018; Von Wirth, Grêt-Regamey, Moser, &
Stauffacher, 2016). On the one hand, Devine-Wright (2013) discussed
potential negative impacts on place-attachment sentiments due to mitigation alternatives for climate change scenarios, e.g., communities
demonstrating limited ability to change or adapt. On the other hand,
von Wirth et al. (2016) found that when residents perceived a disruption positively—rapid urban growth—place-attachment sentiments
from residents can be strengthened. Similarly, Verbrugge and Van Den
Born (2018) found that the higher the place-attachment sentiments
among residents, the more positively they evaluated planned river interventions—e.g., flood safety improvements. Therefore, by accounting
for how communities perceive disruptions to their environment, authorities and decision makers may be able to manage and plan for
community-supported alternatives to respond to disruptions.
Existing literature has successfully linked community place-attachment sentiments with perceptions of alternatives disrupting their existing environment. Most of this literature has been focused on place
attachment at the household or neighborhood level (Lewicka, 2011). In
the current analysis, we study how, at the city and national scales,
hosting communities perceive the impact of displaced persons on water,
wastewater, and transportation infrastructure services.
demands for infrastructure services. These new demands may have
positive or negative effects on infrastructure services depending on a
variety of technical factors and responses (Faust & Kaminsky, 2017). As
such, decision makers tasked with providing displaced persons infrastructure services must also ensure the hosting communities’ services
are not negatively impacted (e.g., decreasing the level of quality of
received service or the end users’ level of satisfaction with the system).
By incorporating end-user perceptions into the management of infrastructure services, potential opposition that compounds these challenges may be mitigated by decision makers (Knoeri et al., 2016;
Valentin et al., 2017).
It is well established that public opposition poses risks for infrastructure projects, potentially impacting projects’ budget, schedule, or
execution, and therefore it is necessary to include public opinion in the
planning of building infrastructure projects (Jiang, Lin, & Qiang, 2016;
Valentin et al., 2018). In 2015, for instance, the Keystone pipeline
project in the United States faced major public opposition, temporarily
forcing the project to come to a halt (DiChristopher, 2017). Public
opposition can impact all types of civil infrastructure systems. It has
impacted water infrastructure projects (e.g., halting a proposed project
to enlarge the water supply system in Australia; Hurlimann & Dolnicar,
2010); transportation infrastructure, notably transit stations in Canada
(Kinawy, Bakht, & El-Diraby, 2017). Public opposition has impacted
industrial, mining, and dam projects (e.g., stopping a mining project in
Peru due to water pollution; Schneider, 2017) as well as energy sector
projects (e.g., overturning environmental permits in Chile for five dams
planned for electric generation; Howard, 2014). Implementing infrastructure alternatives over the objections of the public is likely to be
slow and inefficient (Faust, Mannering, & Abraham, 2016). In the
context of water and pipeline infrastructure projects, the legal and
political conflicts arising from projects are driven by contextual (e.g.,
country of execution, equity of host country, size of the project) and
stakeholder characteristics (Boudet, Jayasundera, & Davis, 2011).
The factors that sustain opposition toward a project were the subject
that Teo and Loosemore (2011) developed a model to study. The authors found that continuity of social opposition is a complex dynamic
process, that if better understood, could be beneficial for communities,
government, and firms related to the projects. Participatory processes
have thus become increasingly important in projects (Di Maddaloni &
Davis, 2017; Teo & Loosemore, 2017; Yang, Ng, Xu, & Skitmore, 2018).
Still, achieving meaningful public participation in infrastructure projects is difficult, partially because public perceptions vary across populations and locations. While aggregated measures of perceptions
provide insight into gauging where most of the public is, they do not
provide insight into the factors influencing these perceptions. This loss
of granularity can negatively impact the management of a system or the
alternatives considered in communities by giving rise to the assumption
that the average represents the distribution. For example, previous
studies have identified how geographic characteristics, influenced by
the contextualized surrounding of residents, impact their respective
perception toward specific infrastructure alternatives and the levels of
infrastructure services received (Faust et al., 2016; Faust, Hernandez, &
Anderson, 2018).
Similarly, socio-demographic characteristics have been found to
impact perceptions of infrastructure. Numerous studies have explored
the relationship between socio-demographic and behavioral parameters, and perceptions. Researchers have examined, for example, the
impact of demographic characteristics (e.g., age, gender) on pro-environmental behavior regarding climate change and physical infrastructure measurements such as highway roughness (Chen et al., 2011;
McCright, 2010; Shafizadeh & Mannering, 2006). Researchers have also
studied the relation between income and educational level regarding
concern about the environment (Klineberg, McKeever, & Rothenbach,
1998), how the source of the news impacts economic policies (Gilens,
2009), and how policy preference influences public attitudes toward
energy security and nuclear power (Corner et al., 2011). Although
4
�Sustainable Cities and Society 48 (2019) 101508
F. Araya, et al.
3. Methods
gender, income level, highest level of education achieved, and the
primary source of the news are significant in assessing public perceptions (Chen et al., 2011; Corner et al., 2011; Faust et al., 2016; Gilens,
2009; McCright, 2010). As such, we included an extensive set of sociodemographic parameters to identify the drivers of these perceptions in
our statistical models (see Table 2). Identifying socio-demographic
drivers increases the level of granularity in the assessment of public
perceptions. If our logic is correct, geographic locations and socio-demographic parameters should appear as significant parameters in the
statistical models (see Tables 5–7). Furthermore, the most relevant
parameters should be expected to be recurrent among different statistical models.
To carry out this study, researcher analyzed survey data that included nonparametric tests and statistical modeling. A survey was deployed among a representative sample of the German public to assess
public attitudes in hosting communities toward the impact of incoming
displaced persons in Germany. The survey approach was selected as
research strategy due to its capacity to produce a large amount of data
(n = 416) relatively quickly (Kelley, Clark, Brown, & Sitzia, 2003),
especially when compared with other approaches such as interviews,
questionnaires, or focus groups. Importantly, this approach allowed
researchers to capture hosting communities’ perceptions in 2016,
during the peak of the displaced persons’ crisis in Europe. However,
survey methods preclude interactions with respondents, thus limiting
researchers’ ability to discover emergent insights from respondents.
This study is focused on the responses to six survey questions that
statistically explored whether hosting communities perceived displaced
persons to be impacting the water, wastewater, and transportation
systems at either or both of the city or national scales.
Researchers also statistically modeled perceptions of each one of the
three infrastructure systems at each scale. The modeling was done using
an extensive set of locational and socio-demographic parameters to
identify the drivers of such perceptions.
3.2. Survey development and deployment
In August 2016, researchers distributed a survey among the German
public to assess the perceptions, awareness, knowledge, and attitudes in
hosting communities of the provision of infrastructure services for incoming displaced persons. Of particular interest were six questions intended to assess whether respondents perceived that incoming displaced persons had, during the three years prior (2013–2016), impacted
the water, wastewater, and transportation systems at the city scale as
well as at the national scale. Within the survey, respondents were asked
the following (translated to English below):
3.1. Identification of drivers of public perceptions
“The incoming displaced persons in the past three years have
strained my city's water/wastewater/transportation infrastructure,”
and
In this study, we used the locational and socio-demographic characteristics of hosting communities to model the perceived impact of
displaced persons in such communities. These characteristics are included as independent variables for the statistical modeling of public
perceptions. The locational characteristics are represented by the state
of residence (see Table 1). This characteristic is included based on the
“place attachment theory” (Devine-Wright, 2007, 2009) discussed in
the literature review. As such, we hypothesized that specific locations
might be statistically significant indicators of public opinion in hosting
communities. And, by including locational characteristics, we ensure
that the survey results are geographically representative of Germany as
well as representative of the distribution of incoming displaced persons
(see Table 1). Regarding the socio-demographic characteristics, a review of the literature of public perception toward infrastructure projects revealed that socio-demographic characteristics such as age,
“The incoming displaced persons in the past three years have
strained
Germany's
water/wastewater/transportation
infrastructure.”
Context for the circumstances and information sought were provided at the beginning of the survey, and other questions were asked
prior to the questions of interest here. Strain in this context was defined
as an additional physical demand on the infrastructure systems (i.e.,
water, wastewater, and transportation) due to incoming displaced
persons that consequentially impacted the performance of the system
and the service received by the end user/community. For the three
systems under study, public perceptions are intended to capture the
public and private domains of these systems. For example, transportation infrastructure used by both private vehicles (e.g., roadways) as
well as public transit (e.g., rail for local trains, roadways for busses).
Questions were posed on a five-point Likert scale—strongly disagree, disagree, agree, strongly agree, and I do not know. The I-do-notknow option was included to account for respondents not having been
aware of the impact on or the performance of the specific infrastructure
system in question. A neutral option was not included, so as to force
respondents to take a stance and avoid decision paralysis (Barge &
Gehlbach, 2012; Krosnick et al., 2002). The survey (conducted in
German) was electronically deployed by a third party, Qualtrics, LLC
(Qualtrics, 2016), using a random sample based on geographic quotas
to be representative of Germany, not a specific area/region/city in
Germany (see Table 1). Based on timestamps from the final valid
samples, the survey took on average 21 min, thus survey fatigue was
avoided (Savage & Waldman, 2008).
Prior to deployment, the survey was reviewed by eight subjectmatter experts with expertise spanning survey development and analyses, infrastructure systems, human-infrastructure interactions, modeling individual and aggregate public perceptions, and German language and culture. The survey was pre-deployed to 15 individuals to
assess the correctness of the data collected, German word choice, and
accessibility of questions by individuals with limited content knowledge. Notably, the pre-deployed sample was not included in the final
sample pool. The survey underwent Institutional Review Board (IRB)
review at the University of Texas at Austin and at the University of
Table 1
Distribution of German population, distribution of displaced persons allocated,
and distribution of survey responses, by German state.
State
Percentage of
German
population
(2016)
Percentage of
displaced persons
allocated by each
state (2016)
Percentage of
survey
responses
(2016)
Bavaria
Baden-Württemberg
Berlin
Brandenburg
Bremen
Hamburg
Hesse
Lower Saxony
MecklenburgWestern
Pomerania
North RhineWestphalia
Rhineland-Palatinate
Saarland
Saxony
Saxony-Anhalt
Schleswig-Holstein
Thuringia
15.7%
13.3%
4.3%
3.0%
0.8%
2.2%
7.5%
9.6%
2.0%
15.5%
12.9%
5.1%
3.1%
1.0%
2.5%
7.4%
9.3%
2.0%
16.1%
10.3%
7.9%
3.4%
1.2%
2.6%
11.5%
7.7%
2.4%
21.7%
21.2%
21.6%
4.9%
1.2%
4.9%
2.7%
3.5%
2.6%
4.8%
1.2%
5.1%
2.8%
3.4%
2.7%
3.8%
1.7%
2.9%
2.6%
2.4%
1.7%
5
�Sustainable Cities and Society 48 (2019) 101508
F. Araya, et al.
Table 2
Descriptive statistics of statistically significant parameters in the six models.
Independent parameter
Min/Max
Average
Geographic parameters
Rhineland-Palatinate (1 if being resident of Rhineland-Palatinate, otherwise 0)
Bavaria (1 if being resident of Bavaria, otherwise 0)
Brandenburg (1 if being resident of Brandenburg, otherwise 0)
Baden-Württemberg (1 if being resident of Baden-Württemberg)
Berlin (1 if being resident of Berlin)
Hamburg (1 if being resident of Hamburg)
0/1
0/1
0/1
0/1
0/1
0/1
0.04
0.17
0.03
0.11
0.08
0.03
Individual parameters
Gender (1 if male, otherwise 0)
Marital status (1 if single, otherwise 0)
Number of years lived in city (years)
Student (1 if being student, otherwise 0)
Retired (1 if being retired, otherwise 0)
Have you lived at least 5 years in the current city (1 if true, otherwise 0)
Born where currently living (1 if true, otherwise 0)
Highest level of education (1 if some high school, otherwise 0)
Highest level of education (1 if high school diploma, otherwise 0)
Individual income (1 if income is less than €34,999, otherwise 0)
Grew up in middle city (1 if true, otherwise 0)
Grew up in rural area (1 if true, otherwise 0)
Employed for wage or salary (1 if true, otherwise 0)
Responsible for water utility bill (1 if true, otherwise 0)
Radio is the primary source of news (1 if true, otherwise 0)
Internet is the primary source of news (1 if true, otherwise 0)
0/1
0/1
0/99
0/1
0/1
0/1
0/1
0/1
0/1
0/1
0/1
0/1
0/1
0/1
0/1
0/1
0.54
0.33
27.28
0.05
0.21
0.86
0.33
0.46
0.18
0.68
0.26
0.57
0.50
0.85
0.07
0.41
Household parameters
Number of people living in the household is 2 or less (1 if true, otherwise 0)
Household income (1 if household income is less than €34,999, otherwise 0)
Household income (1 if household income is €75,000 or above, otherwise 0)
Household owned by someone in household with mortgage or loan (1 if true, otherwise 0)
No children (1 if No children under the age of 5 living in the household. Otherwise 0)
0/1
0/1
0/1
0/1
0/1
0.69
0.49
0.18
0.21
0.94
characteristics of Germany (Destatis, 2018b). The percentage of males
responding to the survey was 54%, while Germany's actual percentage
of males in 2016 was 49% in 2016. The percentage of respondents
living in a household with two or fewer people was 69%, while 75% of
the German population meets this criterion (Destatis, 2018b).
An acknowledged limitation of this study is that public perceptions
are dynamic and may change over time with new information, new
facts, and social interactions. In contrast, this study is based on a crosssectional survey, reflecting a specific moment in time. Another methodological limitation is that the survey format minimizes interaction
with respondents, obtaining only information that concern the questions; no further information can emerge through interaction with research population as they are likely to when using interview or focusgroup methods. Furthermore, this study is focused on Germany, and as
such, there are cultural and social factors that may differ from those in
other developed countries. Additionally, this study considers only the
water, wastewater, and transportation infrastructure systems.
Therefore, the findings of this study may not be directly transferable to
other infrastructure systems such as the energy sector.
Washington. All respondents participated voluntarily and were over 18.
The first question concerned obtaining consent. Data was kept on
password-protected laptops by the research team and used for academic
purposes. No identifying information such as name or address was
collected by the research team.
The final sample consisted of residents from the 16 states in
Germany (see Table 1). As of the Federal Statistics Office of Germany
(Destatis), the total population of targeted states was approximately
82.5 million in 2016 (Destatis, 2018a). To obtain a confidence of
95% ± 5% margin of error, the sample size was calculated as shown in
Eq. (1) (Fellows & Liu, 2015; O’Leary, 2004; Peck & Devore, 2011;
Washington, Karlaftis, & Mannering, 2011):
Number of observations =
(z score)2⋅st. dev⋅(1 − st. dev)
ME2
(1)
where the corresponding z-score for a 95% confidence is 1.96, the
margin of error (ME) is 5%, and the standard deviation is 0.5, which
provides a conservatively large value for the required sample size
(Fellows & Liu, 2015; Peck & Devore, 2011). Thus, for a representative
sample of the German public, there is needed a minimum sample size of
385 valid responses. Notably, the final sample of this study consisted of
416 valid responses spanning 16 states in Germany.
Table 1 shows three components—the distribution, in 2016, of the
German population across those sixteen states (Destatis, 2018a), the
distribution of displaced persons in those same states (BAMF, 2017),
and finally the distribution of responses from the survey deployed in
this study for those sixteen states. The geographic distribution of the
survey responses was the primary parameter used to ensure that the
sample was representative of Germany and not representative of a
single state. The difference between the percentage of population living
in a German state and the percentage of survey responses from that
state was an average of 1.4%, indicating the sample distribution well
represents the German population. Regarding socio-demographic
characteristics, the survey sample aligned with the socio-demographic
3.3. Nonparametric tests
Questions regarding perceived impact at each scale were measured
using an ordinal scale from strongly disagree to strongly agree, with an
additional I-do-not-know option. I-do-not-know responses were removed from analysis. Due to the ordinal nature of questions, nonparametric techniques were considered to draw appropriate statistical
inferences from the data (McCrum-Gardner, 2008; Washington et al.,
2011).
At the city scale, researchers used the Kruskal–Wallis test to look for
differences in perceived impact on the (1) water, (2) wastewater, and
(3) transportation systems (Washington et al., 2011). Next, the authors
tested the same hypothesis at the national scale. These tests evaluate
the conventional notion of perceived differences between the visible
6
�Sustainable Cities and Society 48 (2019) 101508
F. Araya, et al.
The method of simulated maximum likelihood with Halton sequence was used to estimate random parameter models. Bhat (2003)
demonstrated that using the Halton sequence approach generates an
efficient way of drawing values of β from f(β|φ) to compute probabilities and estimate model parameters. In the current study, 500
Halton draws were used to estimate model parameters.
The best-fit model was determined using the Akaike Information
Criterion (AIC). The AIC indicates the amount of information lost while
using a specific model; a lower AIC indicates a better model (Bozdogan,
1987). Marginal effects were used to interpret the results and to
quantify the impact of each independent parameter on the dependent
variable. The values reported here of marginal effects were the average
marginal effect of each parameter across the sample, for a unit change
in the independent parameter (Washington et al., 2011). A positive
marginal effect indicates an increase in the likelihood that a respondent
perceived that displaced persons had impacted water/wastewater/
transportation systems at the city and national scales.
Researchers developed, for each question, a probit model with fixed
parameters and a probit model with random parameters. Likelihood
ratio tests were used to determine the appropriate model, as shown in
Eq. (5) (Washington et al., 2011):
transportation system and the underground, unseen water and wastewater systems. In addition, the authors tested for differences in perceived impact between the city and national scales within each infrastructure type (water, wastewater, transportation). This was tested
using the Mann–Whitney test (Washington et al., 2011). For example,
the authors compared the perceptions, at the city and national scales, of
the impact on the water systems to evaluate whether the two independent populations were statistically different. The wastewater and
transportation systems were each tested similarly.
3.4. Statistical modeling using binary probit models
Each of the six questions were collapsed to a binary variable, agree/
disagree. The agree component consisted of strongly agree and agree
responses; the disagree component consisted of strongly disagree and
disagree responses. There is the substantial evidence suggesting that
offering no-opinion options while studying attitudes does not enhance
data quality (Fowler & Cannell, 1996; Krosnick et al., 2002; Krosnick,
Judd, & Wittenbrink, 2005). Hence the I-do-not-know responses were
excluded from each question. Responses were collapsed as binary
variables to reflect the two possible states of agreeing or disagreeing
that there was a perceived impact of displaced persons on the infrastructure systems at the city and national scales. Independent parameters (see Table 2) included geographic (e.g., state of residence) and
socio-demographic characteristics (e.g., age, gender, educational level).
The inclusion of these parameters allowed for discovering subsets of the
resident German population that perceived impacts differently from the
displaced population.
Best-fit models for all questions were binary probit models with
random parameters. Eq. (2) is used to predict the level of (dis)agreement with whether incoming displaced persons have impacted the
water/wastewater/transportation system at city or national scale.
Tn = β⋅Xn + εn
χ 2 = −2[LL (βfp) − LL (βrp)]
where χ2 is the chi-squared statistic with degrees of freedom (dof)
determined by the number of random parameters; LL(βfp) is the loglikelihood at convergence for the fixed parameters model, and LL(βrp) is
the log-likelihood at convergence for the random parameters model.
For all questions, models including random parameters exhibited a
better fit than models with fixed parameters. Regarding the perceived
impact of displaced persons on the water system at the city scale a χ2 of
6.20 with two dof indicated a 95% confidence level that the random
parameter model was preferred; at the national scale, a χ2 of 18.48 with
two dof indicated a 99.99% confidence level that the random parameter
model was preferred. Regarding the incoming displaced persons impacting the wastewater system, at the city scale a χ2 of 7.20 with two
dof indicated a 97% confidence level that the random parameter model
was preferred; at the national scale a χ2 of 14.78 with three dof indicated a 99.8% confidence level that the random parameter model was
preferred. For models assessing the impact of incoming displaced persons on the transportation system at the city scale, a χ2 of 6.01 with two
dof indicated a 95% confidence level that the random parameter model
is preferred and at the national scale a χ2 of 12.30 with two dof indicated a 99.8% confidence level that the random parameter model was
preferred.
(2)
In Eq. (2), β is a vector of the estimated parameters for the outcome
n, Xn is a vector of observable or explanatory characteristics for the
outcome n such as the geographic or demographic characteristics of the
respondents (e.g., state of residence, age, gender, educational level,
income level), and εn is a vector of disturbance effects. Binary probit
models (Eq. (2)) were used to identify the geographic and socio-demographic parameters affecting the likelihood that respondents agree/
disagree with each statement under consideration.
Pn (agree) = Φ ⎜⎛
⎝
βagree⋅Xagree _ n ⎞
σ
⎟
⎠
(3)
Eq. (3) indicates the probability that respondents took one of the
two possible outcomes from observation n, where Phi (Φ) is the standardized cumulative normal distribution. βagree represents a vector of
estimated parameters for the agree outcome, and Xagree_n is a vector of
measured parameters that indicates the discrete outcome for a given
observation n. The disturbance effect vector εn is normally distributed
(Washington et al., 2011). Random parameters were incorporated to
capture the heterogeneity of the perceived impact across the population, introduced by a density function, f(β|φ), where φ is a vector of
parameters of a specified density function (see Eq. (4); Washington
et al., 2011). All random parameters were normally distributed.
Pnrp (agree) =
∫x Pn (agree)⋅f (β|φ) dβ
(5)
4. Results
4.1. Survey results
Figs. 1 and 2 show the distribution of responses for whether incoming displaced persons were perceived to have impacted the water/
wastewater/transportation systems at the city or national scales, respectively. Table 2 shows the descriptive statistics from the statistically
significant parameters from the six best-fit binary probit models.
Table 3 shows the percentage of responses that agree/disagree that
displaced persons have impacted the performance of none of the systems or all of the systems at a city scale and a national scale. Table 4
shows the percentage of responses that indicated that displaced persons
have impacted the infrastructure systems at the city scale as well as the
national scale. For instance, 22.5% of respondents perceived that displaced persons have impacted both the water and the wastewater systems at the city scale.
(4)
Fixed and random parameters reflect the impact of independent
variables on the dependent variable (i.e., perceived impact of displaced
persons on water/wastewater/transportation at the city and national
scales). Random parameters reflect the heterogeneous impact of the
parameter across the population (normally distributed marginal effect
in this study), while fixed parameters reflect the homogenous impact of
the parameter—or fixed marginal effect—across the population.
7
�Sustainable Cities and Society 48 (2019) 101508
F. Araya, et al.
Fig. 1. Displaced persons in the past three years (2013–2016) have strained the city's water/wastewater/transportation infrastructure.
4.2. Nonparametric tests
5–7. Due to space limitations, we do not discuss each of the 57 statistically significant parameters in this manuscript (see Tables 5–7). Instead, we have selected a set of recurrent parameters among the water,
wastewater, and transportation infrastructure systems, at the city and
national scales (see Table 8). We use this set to discuss how hosting
communities perceive the impacts of displaced persons on these infrastructure systems.
The results from the nonparametric tests reflect the removal of the Ido-not-know responses from the six questions. The remaining responses
for each question were coded as follows: strongly disagree—1, disagree—2, agree—3, and strongly agree—4 (n = 325). The
Kruskal–Wallis tests were used to assess the null hypothesis that public
perceptions of displaced persons impacting the three infrastructure
systems were statistically equivalent at each scale. For both tests, the
results indicated that the null hypothesis could be accepted and the
three infrastructure systems (water, wastewater, and transportation)
were perceived as the same, with corresponding p-values of 0.767 and
0.873 at the national and city scales, respectively. In other words, there
was no statistical difference in the public perceptions of the three infrastructure systems within each scale, for either city or nation.
The Mann–Whitney test was used to evaluate the null hypothesis
that there was no statistical difference in the perceived impacts toward
each systems water/wastewater/transportation between the city and
the national scale. The corresponding p-values were 0.019 for the water
system, 0.0275 for the wastewater system, and 0.0224 for the transportation system. Thus, the results indicate that the perceived impact of
displaced persons on each infrastructure system is statistically different
when the same infrastructure type is compared at the city and the national scale.
5. Discussion
5.1. Perceptions of infrastructure systems across scales
The nonparametric tests revealed that, within the city and national
scales, no statistical difference was present in the perceived impact of
displaced persons on the three infrastructure systems. Between the two
scales, however, a statistical difference was revealed in the perceived
impact on each infrastructure system. That is to say, at the city scale
people perceived the impact of displaced persons on the water/wastewater/transportation system differently to people considering the impact at the national scale. These findings are consistent with previous
work from Kingston et al. (2000). These results indicate the relevance of
the geographic scale selected when assessing public perceptions of the
impact on infrastructure systems.
These results may mean that individuals view the performance of
the infrastructure as a system-of-systems within the same geographic
scale, as opposed to individually assessing the performance of each
system. In other words, the systems are perceived to be functioning as
an integrated part of the built environment, inseparable from other
4.3. Statistical modeling
The results for the best-fit binary probit models are shown in Tables
Fig. 2. Displaced persons in the past three years (2013–2016) have strained the nation's water/wastewater/transportation infrastructure.
8
�Sustainable Cities and Society 48 (2019) 101508
F. Araya, et al.
Table 3
Respondents who perceive and who do not perceive an impact on the performance of the water, wastewater, and transportation infrastructure systems due to
displaced persons.
Respondents do not perceive an impact on any individual system (W, WW, and T)
Respondents perceive an impact on all system (W, WW, and T)
City scale
National scale
Both the City and National scales
79.24%
20.76%
68.21%
31.79%
78.15%
21.85%
Note: W, water; WW, wastewater; T, transportation.
received only 4.83% of all incoming displaced persons in Germany,
while its neighboring states Baden-Württemberg, Hesse, and North
Rhine-Westphalia received 12.97%, 7.23%, and 21.24% of displaced
persons, respectively (see Table 1; Katz et al., 2016). In sum, this region
received in 2015 more than 41% of Germany's total incoming displaced
persons. It may seem surprising that a state with a low percentage of
incoming displaced persons perceived the impact more strongly than a
state with a higher percentage. We suggest that these results may be
capturing opposition sentiments among the typically politically conservative residents of the state of Rhineland-Palatinate. For instance, it
has been reported that the refugee crisis enabled anti-immigration political parties to gain more popular support (The Guardian, 2016), potentially from among residents who feared the country could not handle
so many refugees (The Guardian, 2015; The New York Times, 2015). In
2016, for example, Rhineland Palatinate voted into parliament a populist right-wing party that supported anti-immigration policies (DW,
2016). Another possible explanation for this observed trend in the data
relates to the secondary migration patterns toward Rhineland-Palatinate from surrounding states. More than 41% of incoming displaced
persons arrived in states around Rhineland-Palatinate, and as these
individuals were not required to stay in their initially assigned locations, it is reasonable to think there may have been secondary migration
patterns in this area. This could have increased the number of displaced
persons allocated in the state of Rhineland-Palatinate and therewith the
stress placed on the infrastructure services in this region. Unfortunately,
no data exists, to the best of our knowledge, on secondary migration
trends that could validate this explanation.
Previous studies have suggested that anti-immigrant attitudes are
based on residents feeling their privileges are threatened by immigrants, and are also influenced by the country's economic situation
and the proportion of immigrants to the existing population (Quillian,
1995; Semyonov, Raijman, & Gorodzeisky, 2006). Residents of BadenWürttemberg were more likely to perceive displaced persons as impacting the transportation and the wastewater systems. For the transportation system, we modeled being a Baden-Württemberg resident as a
random parameter. We found that 91.50% of residents were more likely
to perceive displaced persons as impacting the transportation system
(see Table 7). Receiving 12.97% of Germany's displaced persons BadenWürttemberg was the third highest recipient (Katz et al., 2016). These
results, again, may be reflecting the influence of the quantity of displaced persons arriving to specific geographic locations in shaping
public perceptions from hosting communities. Respondents were more
likely to perceive that displaced persons had impacted the water system
at the city scale if they met one of three conditions: they were employed
for a wage or salary, had lived at least five years in the current city, or
infrastructure types. If one system is impacted negatively, such as the
transportation system being inundated, the results suggest that users
assume other systems are also negatively impacted. This appears to be
the case in spite of the underground water and wastewater systems
being out-of-sight, out-of-mind. These results may be linked to placeattachment theory. This theory holds that in a place where the sense of
community is higher than that of the individual, residents will eventually view negatively any disruptor to that place (Devine-Wright,
2009). Hosting communities may perceive as a disruptor to their
community the impact by displaced persons to any of the water, wastewater, and transportation systems. This would be true regardless their
framing that community at the local or national scale. This tendency
among people underscores the importance of interdependencies among
these three infrastructure systems (Rinaldi, Peerenboom, & Kelly,
2001). Disruptions to one infrastructure system may influence perceptions of the other infrastructure systems.
In contrast, a difference was found within geographic scales (and
between) when it came to the socio-demographic and geographic drivers influencing the perceived impact of displaced persons on each
system. Parameters influencing the likelihood of (not) perceiving an
impact differed for each infrastructure system. In the instances where a
parameter was revealed to influence multiple systems or scales, the
marginal impact varied for each system or scale (see Tables 5–7). From
a practical and theoretical point of view, this demonstrates, importantly, that while aggregate perceptions may not differ across units
of analysis, the underlying drivers influencing those perceptions do in
fact differ. For example, while the water, wastewater, and transportation systems were in aggregate perceived consistently within a geographic scale, each system's relative contribution to that aggregate
differed. Practically speaking, this means that before a targeted solution
can be introduced to provide such services engineers must discover
which infrastructure system is driving the perception of impact. Theoretically speaking, this attests to the heterogeneity of perceptions and
respective drivers that may, taken in the aggregate, appear homogenous.
5.2. City scale
Considering the influences of the geographic parameters at the city
scale (see Tables 5–7), if one was a resident of either of RhinelandPalatinate or Baden-Württemberg, one was more likely to perceive that
displaced persons impacted at least two (of the three) systems (see
Tables 5–7). Residents of Rhineland-Palatinate were more likely to
perceive that displaced persons impacted the water, wastewater, and
transportation systems within their city. In 2015, Rhineland-Palatinate
Table 4
Percentage of responses that perceive an impact on a system/scale due to the arrival of displaced persons.
Perceived an impact on the system at
the specified scale
Water system,
city
Wastewater system,
city
Transportation system,
city
Water system,
nation
Wastewater system,
nation
Transportation system,
nation
Water system, city
Wastewater system, city
Transportation system, city
Water system, nation
Wastewater system, nation
Transportation system, nation
23.10%
22.50%
18.20%
21.20%
21.80%
19.40%
22.50%
24.90%
19.10%
22.50%
23.40%
21.50%
18.20%
19.10%
27.40%
19.40%
19.40%
26.80%
21.20%
22.50%
19.40%
32.00%
29.80%
27.10%
21.80%
23.40%
19.40%
29.80%
32.00%
26.80%
19.40%
21.50%
26.80%
27.10%
26.80%
36.60%
9
�Sustainable Cities and Society 48 (2019) 101508
F. Araya, et al.
Table 5
Model results regarding whether incoming displaced persons in the past three years (2013–2016) impacted the respondents’ water system service at city and national
scales.
Independent variable
Unless otherwise indicated, variables are 1 if true, otherwise 0
City scale
National scale
Parameter
(t-stat)
St.Dev.
(t-stat)
Fixed
Fixed
0.002
Residing in Bavaria
−2.260
(−4.470)
1.274
(2.860)
–
–
–
Residing in Brandenburg
–
–
–
Residing in Baden-Württemberg
–
–
–
Gender (male)
Fixed
Being a student
−0.490
(−1.800)
0.861
(2.650)
–
Being retired from workforce
Primary source of news the Internet
Constant
Residing in Rhineland-Palatinate
Marginal effects
Parameter
(t-stat)
St.Dev.
(t-stat)
−0.705
(−1.550)
–
Fixed
Marginal effects
–
–
Fixed
0.006
Fixed
0.004
8.544
(4.860)
–
0.003
−0.0009
4.662
(4.980)
3.073
(2.690)
2.499
(3.020)
–
Fixed
0.001
–
–
–
–
–
Fixed
−0.010
–
–
–
Fixed
−0.002
0.996
(3.800)
–
Fixed
0.001
−8.091
(−4.270)
−2.101
(−3.400)
–
–
–
–
–
Fixed
−0.004
−2.268
(−3.620)
–
6.597 (5.630)
−0.004
Fixed
0.001
–
–
Fixed
Number of people living in the household is 2 or less
0.725
(1.800)
−1.936
(−3.920)
–
No children under the age of 5 living in household
–
Employed for wage or salary
Primary source of news the radio
Highest level of education is some high school
Grew up in middle city
Have you lived at least 5 years in the current city
Individual income less than €34,999
–
Fixed
0.002
0.001
−3.781
(−3.520)
1.205
(2.880)
1.601
(3.540)
–
–
–
3.404 (5.880)
−0.003
–
–
–
–
–
Fixed
−0.003
–
–
−3.016
(−4.540)
−1.742
(−2.930)
7.203
(5.780)
−0.002
Log likelihood at convergence
AIC
Number of observations
−178.909
377.80
352
−198.319
422.60
346
had an increased likelihood of perceiving displaced persons as having
impacted the wastewater system, while 65.40% of them had a decreased likelihood. Respondents that used the internet as their primary
source of news was a random parameter that indicated that 43.00% had
an increased likelihood of perceiving that displaced persons had impacted the wastewater system, while 57.00% had a decreased likelihood. The parameter for source of news may capture the versatility of
various media and their command of a wider variety of information.
Furthermore, the influence of the source of the news is consistent with
previous findings from Kosho (2016). Kosho (2016) found that the
media has a strong influence on public attitudes in the context of migration, and how information is presented to hosting communities influences public opinions and policies regarding migration issues. In this
study, the method of receiving news is a proxy for “how.” Various news
sources selected by respondents may represent the flexibility of the
news received. For instance, the internet provides a user flexibility in
selecting news stories and providers (This is shown in the data, where
getting news from the internet shows both negative and positive impacts on different models). In contrast, the radio provides minimal selection on the story delivered (also shown in the data, where getting the
news from the radio does not show this variability in directionality).
Nonetheless, no clear trend was found that linked the primary source of
news with residents being more or less likely to perceive the impacts of
displaced persons.
Concerning household characteristics, respondents with no children
under the age of five living in the household had a decreased likelihood
had used the internet as a primary source of news. Respondents that
were born where they are currently living had an increased likelihood
of perceiving that displaced persons had impacted the wastewater and
transportation systems at the city scale. This possibly captures the influence of their longevity using the infrastructure system. Residents that
were born where they are currently living and have lived at least five
years in the city develop a stronger place attachment sentiment toward
their community, and are likely to be more familiar with the infrastructure systems (Brown & Perkins, 1992). These stronger sentiments
can make residents more protective of their environment and community following an event that they perceive modifies the status quo.
Respondents with an individual income below €34,999 or with the
highest level of education as high school had a decreased likelihood of
perceiving that displaced persons had impacted the water system and
were found to be random parameters (see Table 5). Approximately 37%
of respondents having a maximum of a high school education had an
increased likelihood of perceiving displaced persons as having impacted
the water system, while 63% of them had a decreased likelihood. The
random parameter individual income below €34,999 showed that
28.50% of respondents had an increased likelihood of perceiving that
displaced persons had impacted the water system while 71.50% had a
decreased likelihood. Respondents whose highest level of education
was high school and whose primary source of news was the Internet had
a decreased likelihood of perceiving displaced persons as having impacted the wastewater systems; they were modeled as random parameters (see Table 6). Among high school-educated respondents, 34.60%
10
�Sustainable Cities and Society 48 (2019) 101508
F. Araya, et al.
Table 6
Model results regarding whether incoming displaced persons in the past three years (2013–2016) impacted the respondents’ wastewater system service at city and
national scales.
Independent variable
Unless otherwise indicated, variables are 1 if true, otherwise 0
City scale
National scale
Parameter
(t-stat)
St.Dev.
(t-stat)
Fixed
Residing in Baden-Württemberg
Residing in Rhineland-Palatinate
Residing in Bavaria
−0.774
(−3.070)
1.227 (3.230)
1.670 (3.530)
–
Fixed
Fixed
–
0.086
0.118
–
Residing in Berlin
–
–
–
Primary source of news the radio
–
–
–
Gender (male)
–
–
–
Born where currently living
Being a student
Fixed
Fixed
0.044
−0.333
Highest level of education is high school diploma
0.634 (2.470)
−4.716
(−3.350)
–
–
–
Household income is less than €34,999
0.730 (2.970)
Fixed
0.051
Number of people living in the household is 2 or less
Fixed
−0.068
Fixed
No children under the age of 5 living in household
−0.967
(−3.740)
−0.731
(−2.220)
−0.769
(−2.140)
−1.127
(−3.200)
–
Marital status (single)
–
Constant
Household owned by someone in household with mortgage or loan
Primary source of news is the Internet
Highest level of education is some high school
Log likelihood at convergence
AIC
Number of observations
Marginal effects
Parameter
(t-stat)
St.Dev.
(t-stat)
Fixed
−0.051
1.272
(2.500)
–
–
1.517
(4.360)
−1.198
(−2.160)
−3.973
(−3.500)
−0.664
(−2.590)
–
−6.974
(−3.970)
−1.476
(−3.740)
−0.515
(−1.430)
−1.073
(−3.760)
–
4.376 (6.11)
−0.054
2.851 (6.31)
Marginal effects
–
–
Fixed
–
–
0.126
Fixed
−0.099
Fixed
−0.331
Fixed
−0.055
–
Fixed
–
−0.581
Fixed
−0.123
6.393
(6.400)
Fixed
−0.043
–
–
–
–
–
−0.079
–
–
–
–
–
–
1.300
(6.820)
1.923
(5.130)
−0.100
–
−1.200
(−2.470)
0.485
(1.540)
−178.884
381.80
348
−0.089
0.040
−192.165
412.30
343
Moreover, our results provide some evidence of cases showing that
involving hosting communities during the allocation and provision of
services to displaced persons can positively influence public attitudes.
Interestingly, Bavaria residents were found to be statistically significant in all three models at the national scale. They were more likely
to perceive displaced persons impacting the water, wastewater, and
transportation systems (see Tables 5–7). These results may be influenced by Bavaria receiving in 2015 the second highest percentage
(15.33%) of displaced persons in Germany (Katz et al., 2016), and by
opposition sentiments among the residents of Bavaria and the support
of local authorities to minimize the quantity of incoming displaced
persons being allocated on Bavaria (BBC, 2016; DW, 2017). Similarly to
results concerning systems at the city scale in Baden-Württemberg,
these results may be evidence that the magnitude of displaced persons
allocated to a particular state influences public perceptions. Regarding
demographic parameters, respondents identifying as students were
statistically significant across all three systems at the national scale,
decreasing, on average, the likelihood of perceiving impacts from displaced persons (see Tables 5–7). These results may be capturing the
influence of generational and educational levels, consistent with previous studies that have suggested younger or educated individuals have
more positive attitudes about immigration (Berg, 2010; Foster, 2008;
Hainmueller & Hiscox, 2007). Interestingly, the citizenship of respondents—whether German citizen or not—was only statistically significant parameter in one out of the six models (see Table 7). These
results may reflect a lack of existing bias regarding whether being a
citizen from the country hosting displaced persons is an issue while
perceiving the impacts on infrastructure systems.
of perceiving that displaced persons had impacted the transportation
city; this was modeled as a random parameter. As such, 75.12% of respondents had a decreased likelihood of perceiving that displaced
persons had impacted the transportation system, and 24.88% had an
increased likelihood.
5.3. National scale
In general, the statistically significant geographic parameters made
people more likely to perceive displaced persons as having impacted the
infrastructure systems. In Bavaria, for instance, residents were more
likely to perceive impacts on the water, wastewater, and transportation
systems (See Tables 5–7). Notably, however, residents of the state of
Berlin and Hamburg were less likely to perceive impacts on the wastewater and transportation system, respectively. According to Katz et al.
(2016), the states of Hamburg and Berlin demonstrated a particular
ability to innovate when it came to receiving and integrating displaced
persons. Hamburg innovated by unifying the delivery of services such
as shelter and food to displaced persons, joining services with the implementation of cross-disciplinary agencies.
With the goal of minimizing local opposition, residents were invited
to participate in the process of situating displaced persons, of initiating
changes to building regulation and zoning ordinances to effectively
allocate centers for displaced persons (Katz et al., 2016). Berlin adopted
modular housing to create villages in communities, and to identify locations to install long-term housing for displaced persons (Katz et al.,
2016). These unique circumstances presented in these two states may
have influenced residents’ attitudes toward incoming displaced persons.
11
�Sustainable Cities and Society 48 (2019) 101508
F. Araya, et al.
Table 7
Model results regarding whether incoming displaced persons in the past three years (2013–2016) impacted the respondents’ transportation system service at city and
national scales.
Independent variable
Unless otherwise indicated, variables are 1 if true, otherwise 0
Constant
Residing in Rhineland-Palatinate
City scale
National scale
Parameter
(t-stat)
St.Dev.
(t-stat)
−0.008
(−0.020)
4.677
(4.320)
–
Fixed
Marginal effects
Fixed
0.003
–
–
2.373
(3.710)
–
0.002
Residing in Brandenburg
3.256
(4.400)
–
Residing in Hamburg
–
–
–
Gender (male)
−0.734
(−2.140)
−2.745
(−4.130)
2.069
(4.210)
–
Fixed
−0.0005
Fixed
−0.001
Fixed
0.001
–
–
−3.356
(−3.260)
–
Fixed
−0.002
–
–
Fixed
0.0006
Household Income is at least €75,000
0.946
(2.650)
–
–
–
If number of people living in the household is 2 or less
–
–
–
No children under the age of 5 living in household
−4.199
(−5.500)
–
6.190
(6.280)
–
−0.002
Residing in Bavaria
Residing in Baden-Württemberg
Grew up in rural area
Born where currently living
Primary source of news is the internet
Primary source of new is the radio
Citizenship (German)
Household income is between €35,000–€74,999
Being a student
Log likelihood at convergence
AIC
Number of observations
–
–
−205.393
432.80
368
Parameter
(t-stat)
St.Dev.
(t-stat)
Marginal effects
2.805 (2.390)
Fixed
1.416
(2.560)
1.392
(4.110)
1.159
(3.170)
1.227
(2.130)
−2.071
(−2.320)
–
Fixed
0.407
Fixed
0.401
Fixed
0.333
Fixed
0.353
Fixed
−0.596
–
–
−0.731
(−2.390)
0.881
(3.520)
0.543
(2.420)
–
Fixed
−0.21
Fixed
0.253
Fixed
0.156
–
–
−2.454
(−2.190)
–
Fixed
−0.706
–
–
−0.920
(−2.890)
−0.828
(−3.110)
−1.136
(−2.740)
−3.530
(−3.270)
Fixed
−0.265
Fixed
−0.238
2.394
(9.150)
2.857
(2.750)
−0.327
−1.016
−218.954
469.90
360
displaced persons may facilitate the provision of infrastructure services
as well as the integration process of displaced persons into hosting
communities. In addition, identifying geographies where public outreach has been particularly effective allows the replication of successful
infrastructure policy. For instance, the described community-supported
initiatives from Berlin and Hamburg attest to the benefits of public
involvement in infrastructure projects intended to support the provision
of services to displaced persons.
In summary, recent conflicts, natural and human-made, have drastically increased the global number of displaced persons. This means
that engineers and policy makers around the globe must consider how
the resulting population dynamics impact critical infrastructure systems
and their users. Of course, infrastructure policy and design must take
into account more than just communities’ perceptions. Key aspects of
any project plan, for example, include cost, regulatory standards,
schedules, quality, and safety. Nevertheless, and as shown here, if we
improve our understanding of the public perceptions of infrastructure
systems we may be able to better provide critical infrastructure services
to incoming displaced persons and hosting communities alike.
In the context of respondents’ household characteristics, all significant parameters had a decreased likelihood of perceiving displaced
persons having impacted the infrastructure systems (i.e., number of
people living in the household, household income, and having no
children under the age of five living in the household). In particular,
53.20% of households with an income below €34,999 were less likely to
perceive displaced persons as having impacted the wastewater system.
The parameter of residents having no children under the age of five
living in the household was modeled as a random parameter in all three
models at the national scale. It was found that for the three different
systems 59.60% of respondents were less likely to perceive displaced
persons as having impacted the water system. In addition, 82.20% of
respondents were less likely to perceive displaced persons as having
impacted the wastewater system. Furthermore, 68.20% of respondents
were less likely to perceive displaced persons as having impacted the
transportation system. The presence of multiple random parameters
indicates a considerable heterogeneity among respondents.
It is important that engineers and decision makers know about these
geographic and socio-demographic parameters driving public perceptions of hosting communities. With such knowledge, they could identify
specific geographies where infrastructure projects may experience
public protest, and where public outreach and participation in projects
is particularly needed. At a higher level of decision-making, ministries
and municipalities may be benefited from identifying sources of public
support or opposition during the distribution process of displaced persons. Cities and regions with more positive perceptions of incoming
6. Conclusions
This study addresses a gap in the literature regarding public perceptions of the impact, at both city and national scales, of extreme
population dynamics on water, wastewater, and transportation systems.
This research contributes to the knowledge regarding infrastructure
12
�Sustainable Cities and Society 48 (2019) 101508
F. Araya, et al.
Table 8
Recurrent parameters influencing public perceptions.
Across scales
Infrastructure systems
Discussion points
Water, Wastewater, and Transportation systems at the city scale
• No statistical difference in the perceived impact of displaced persons on the three infrastructure systems
at the city scale
• Statistical difference in the perceived impact on each infrastructure system
• No statistical difference in the perceived impact of displaced persons on the three infrastructure systems
at the national scale
• Statistical difference in the perceived impact on each infrastructure system
• Results indicate the relevance of the geographic scale selected to assess public perceptions of the impact
on infrastructure systems
Water, Wastewater, and Transportation systems at the national scale
Influence of the city and national scale
City scale
Independent variable
Unless otherwise indicated, variables are 1 if true, otherwise 0
Discussion points
Residing in Rhineland-Palatinate
Residing in Baden-Württemberg
• Influence of the quantity of incoming displaced persons on the public perceptions of hosting communities
• Potential influence of the secondary migration patterns from surrounding states influencing public
perceptions from residents
• Opposition sentiments among residents
• Influence of the longevity of end users in the system on the public perceptions of hosting communities
• Place attachment theory
• Primary source of the news reflects the influence of news source on public perceptions
Born where currently living
Resided in current city for at least 5 years
Primary source of news the radio
Primary source of news the Internet
National scale
Independent variable
Unless otherwise indicated, variables are 1 if true, otherwise 0
Discussion points
Residing in Baden-Württemberg
Residing in Bavaria
Residing in Berlin
Residing in Hamburg
Household income
No children under the age of 5 living in the household
Being a student
• Quantity of incoming displaced persons influence public perceptions of hosting communities
• Opposition sentiments among residents
• Community supported initiatives to receive and integrate displaced persons influence public perceptions of
hosting communities
• Modeled as random parameter on the three infrastructure systems, and as such, indicates a considerable
heterogeneity among respondents
• Potential influence of generational and educational level in attitudes toward incoming displaced persons
geographic scale.
The results also emphasize that, when dealing with planning and
construction, local authorities (e.g., municipalities), engineers, and
policy makers must consider the influence of different geographic scales
on public perceptions. The identification of the heterogeneous drivers
of public support can lead to community-supported infrastructure solutions to provide services to displaced persons. It is important for engineers and policymakers to understand the public perceptions of the
ways that population displacement impacts infrastructure, as well as
the corresponding heterogeneous drivers of those perceptions. Such an
understanding allows them to implement end user-supported solutions,
minimize project protest, and ensure high levels of infrastructure service.
Future research should explore hosting community perceptions with
alternative data-collection methods, such as interviews with residents.
These methods may capture the reasons behind the statistical trends
observed here, thereby enriching the results of the present study.
Additionally, we recommend a study that assesses the impact of displaced persons on the housing sector. Indeed, this aspect of the built
environment has been extensively discussed in the media as a source of
stress for hosting communities (e.g., BBC, 2016; DW, 2017; Reuters,
2018). We also recommend exploring geographic contexts other than
those included in this study to assess possible cultural similarities and
differences amongst hosting communities and the displaced population.
It would be interesting, for instance, to study attitudes and perceptions
of hosting communities in Turkey, which is a developing country and
has, during the past four years, hosted more displaced persons than any
other country in the world (UNHCR, 2018). Finally, and from a practical perspective, future research should consider how existing projectdelivery systems (e.g., public-private-partnerships or integrated project
systems that host a disaster-displaced population, but that are geographically distinct from a primary disaster event.
One contribution of this study is that it identifies the influence of the
geographic scale on public perceptions of the hosting communities, as
revealed by the nonparametric tests. Within the city or national scale,
public perceptions of the impact of displaced persons on the water,
wastewater, and transportation systems were not statistically different.
What were statistically different in contrast, were perceptions of the
impact on each infrastructure system between geographic scales. This
difference in public perceptions across the city and national scales may
be due to respondents perceiving the impacts from displaced persons on
one system of systems at the city scale, and as another, distinct system
of systems at the national scale.
The second contribution of this study is that the demographic
parameters influencing public perceptions were different for the three
infrastructure systems at both city and national scales. Nonetheless,
there were certain parameters that were significant in more than one
model (e.g., the longevity of respondents with the systems, having no
children under the age of five living in the household, the primary
source of news, and the highest level of education; Tables 5–7). These
parameters suggest that end users with more experience with the infrastructure systems from their community are more likely to perceive
the impacts or disruptions on the systems in their community (DevineWright, 2009). These results may have been shaped by place attachment (Devine-Wright, 2009). Place attachment theory states that residents from a hosting community will develop negative sentiments
toward disruptions to their community. This interpretation is supported
by the nonparametric test results, which indicated the absence of statistical difference in perceptions of the impact of displaced persons on
water, wastewater, and transportation systems within the same
13
�Sustainable Cities and Society 48 (2019) 101508
F. Araya, et al.
delivery) can leverage public perceptions during the different stages of
infrastructure projects such as planning, design, and construction.
place identities in a climate changed world. Global Environmental Change, 23(1),
61–69.
Di Maddaloni, F., & Davis, K. (2017). The influence of local community stakeholders in
megaprojects: Rethinking their inclusiveness to improve project performance.
International Journal of Project Management, 35(8), 1537–1556.
DiChristopher, T. (2017). Nebraska commission approves keystone CL pipeline route. CNBC
https://www.cnbc.com/2017/11/20/nebraska-commission-approves-keystone-xlpipeline-route.html (01.02.18).
Doria, M. F. (2006). Bottled water versus tap water: Understanding consumers’ preferences. Journal of Water and Health, 4(2), 271–276.
DW (2016). Rhineland-Palatinate plays it safe, re-electing SPD for sixth consequtive term.
http://www.dw.com/en/rhineland-palatinate-plays-it-safe-re-electing-spd-for-sixthconsecutive-term/a-19112416 (10.07.17).
DW (2017). Bavarian government to release new refugee policy so ‘Germany remains
Germany’. https://www.dw.com/en/bavarian-government-to-release-new-refugeepolicy-so-germany-remains-germany/a-37044492 (25.08.18).
El-Anwar, O., & Chen, L. (2012). Computing a displacement distance equivalent to optimize plans for postdisaster temporary housing projects. Journal of Construction
Engineering and Management. https://doi.org/10.1061/(ASCE)CO.1943-7862.
0000601.
El-Anwar, O., El-Rayes, K., & Elnashai, A. S. (2009). Maximizing the sustainability of
integrated housing recovery efforts. Journal of Construction Engineering and
Management. https://doi.org/10.1061/(ASCE)CO.1943-7862.0000185.
Eschenbach, R. C., & Eschenbach, T. G. (1996). Understanding why stakeholders matter.
Journal of Management in Engineering, 59–64. https://doi.org/10.1061/(ASCE)0742597X(1996)12:6(59).
Eurostat (2017). 1.2 million first time asylum seekers registered in 2016 – Eurostat new release. http://ec.europa.eu/eurostat/en/web/products-press-releases/-/3-16032017BP (15.03.17).
Eurostat (2018). Asylum statistics. https://ec.europa.eu/eurostat/statistics-explained/
index.php/Asylum_statistics (08.02.19).
Faust, K., Mannering, F., & Abraham, D. (2016). Statistical analysis of public perceptions
of water infrastructure sustainability in shrinking cities. Urban Water Journal, 13(6),
618–628.
Faust, K. M., Hernandez, S., & Anderson, J. (2018). Willingness to pay for perceived
increased costs of water and wastewater service in shrinking US Cities: A latent class
approach. Journal of Water Resources Planning and Management. https://doi.org/10.
1061/(ASCE)WR.1943-5452.0000946.
Faust, K. M., & Kaminsky, J. A. (2017). Building water & wastewater system resiliency to
disaster migration: Utility perspectives. Journal of Construction Engineering and
Management. https://doi.org/10.1061/(ASCE)CO.1943-7862.0001352.
Fellows, R. F., & Liu, A. M. (2015). Research methods for construction. John Wiley & Sons.
Foster, C. H. (2008). The welfare queen: Race, gender, class, and public opinion. Race,
Gender and Class, 15(3–4), 162–179.
Fowler, F. J., Jr., & Cannell, C. F. (1996). Using behavioral coding to identify cognitive
problems with survey questions.
Gilens, M. (2009). Why Americans hate welfare: Race, media, and the politics of antipoverty
policy. University of Chicago Press.
Gray, V., Lowery, D., Fellowes, M., & McAtee, A. (2004). Public opinion, public policy,
and organized interests in the American states. Political Research Quarterly, 57(3),
411–420.
Hainmueller, J., & Hiscox, M. J. (2007). Educated preferences: Explaining attitudes toward immigration in Europe. International Organization, 61(2), 399–442.
Hendricks, M. D., Meyer, M. A., Gharaibeh, N. G., Van Zandt, S., Masterson, J., Cooper, J.
T., Jr., et al. (2018). The development of a participatory assessment technique for
infrastructure: Neighborhood-level monitoring towards sustainable infrastructure
systems. Sustainable Cities and Society, 38, 265–274.
Hendry, E., & Regan, M. (2017). What you need to know about Hurricane Irma. PBS https://
www.pbs.org/newshour/nation/need-know-hurricane-irma (25.04.18).
Herazo, B., & Lizarralde, G. (2016). Understanding stakeholders’ approaches to sustainability in building projects. Sustainable Cities and Society, 26, 240–254.
Hosseini, S. A., de la Fuente, A., & Pons, O. (2016). Multicriteria decision-making method
for sustainable site location of post-disaster temporary housing in urban areas.
Journal of Construction Engineering and Management. https://doi.org/10.1061/
(ASCE)CO.1943-7862.0001137.
Hovelsrud, G. K., Karlsson, M., & Olsen, J. (2018). Prepared and flexible: Local adaptation
strategies for avalanche risk. Cogent Social Sciences, 4(1), 1460899.
Howard, B. C. (2014). Chile scraps huge patagonia dam project after years of controversy.
https://news.nationalgeographic.com/news/energy/2014/06/140610-chilehidroaysen-dam-patagonia-energy-environment/ (05.10.2018).
Hurlimann, A., & Dolnicar, S. (2010). When public opposition defeats alternative water
projects – The case of Toowoomba Australia. Water Research, 44(1), 287–297.
Hwang, S., Park, M., Lee, H. S., & Lee, S. (2016). Hybrid simulation framework for immediate facility restoration planning after a catastrophic disaster. Journal of
Construction Engineering and Management. https://doi.org/10.1061/(ASCE)CO.19437862.0001146.
Hwang, S., Park, M., Lee, H. S., Lee, S., & Kim, H. (2014). Postdisaster interdependent
built environment recovery efforts and the effects of governmental plans: Case analysis using system dynamics. Journal of Construction Engineering and Management.
https://doi.org/10.1061/(ASCE)CO.1943-7862.0000939.
Islam, M. S., Rana, M. M. P., & Ahmed, R. (2014). Environmental perception during rapid
population growth and urbanization: A case study of Dhaka city. Environment,
Development and Sustainability, 16(2), 443–453.
Jardine, C. G., Gibson, N., & Hrudey, S. E. (1999). Detection of odour and health risk
perception of drinking water. Water Science and Technology, 40(6), 91–98.
Jiang, H., Lin, P., & Qiang, M. (2016). Public-opinion sentiment analysis for large hydro
Acknowledgements
This material is based upon work supported by the National Science
Foundation under Grant Nos. 1624409 and 1624417, and by Conicyt
under the program Becas Chile Grant No. 72170369. FA would like to
acknowledge the support from Departamento de Obras Civiles from
Universidad Tecnica Federico Santa Maria through the Faculty
Development Scholarhip provided by the Chilean Fulbright
Commission.
References
Ansolabehere, S., & Konisky, D. M. (2009). Public attitudes toward construction of new
power plants. Public Opinion Quarterly, 73(3), 566–577.
Anton, C. E., & Lawrence, C. (2014). Home is where the heart is: The effect of place of
residence on place attachment and community participation. Journal of Environmental
Psychology, 40, 451–461.
Arneson, E., Deniz, D., Javernick-Will, A., Liel, A., & Dashti, S. (2017). Information deficits and community disaster resilience. Natural Hazards Review, 18(4), https://doi.
org/10.1061/(ASCE)NH.1527-6996.0000251.
Asoka, G. W., Thuo, A. D., & Bunyasi, M. M. (2013). Effects of population growth on
urban infrastructure and services: A case of Eastleigh neighborhood Nairobi, Kenya.
Journal of Anthropology and Archaeology, 1(1), 41–56.
BAMF (2017). Initial Distribution of Asylum-Seekers (EASY). http://www.bamf.de/EN/
Fluechtlingsschutz/AblaufAsylv/Erstverteilung/erstverteilung-node.html (18.05.17).
Barge, S., & Gehlbach, H. (2012). Using the theory of satisficing to evaluate the quality of
survey data. Research in Higher Education, 53(2), 182–200. https://doi.org/10.1007/
s11162-011-9251-2.
BBC (2016). Migrant crisis: Bavaria mayor sends refugees to Merkel. https://www.bbc.com/
news/world-europe-35316913 (25.08.18).
Berg, J. A. (2010). Race, class, gender, and social space: Using an intersectional approach
to study immigration attitudes. The Sociological Quarterly, 51(2), 278–302.
Bhat, C. R. (2003). Simulation estimation of mixed discrete choice models using randomized and scrambled Halton sequences. Transportation Research Part B:
Methodological, 37(9), 837–855.
Bier, V. M. (2017). Understanding and mitigating the impacts of massive relocations due
to disasters. Economics of Disasters and Climate Change, 1(2), 179–202.
Boudet, H. S., Jayasundera, D. C., & Davis, J. (2011). Drivers of conflict in developing
country infrastructure projects: Experience from the water and pipeline sectors.
Journal of Construction Engineering and Management. https://doi.org/10.1061/
(ASCE)CO.1943-7862.0000333.
Bozdogan, H. (1987). Model selection and Akaike's information criterion (AIC): The
general theory and its analytical extensions. Psychometrika, 52(3), 345–370.
Brown, B. B., & Perkins, D. D. (1992). Disruptions in place attachment. In I. Altman, & S.
M. Low (Vol. Eds.), Place attachment. Human behavior and environment (advances in
theory and research): Vol. 12. Boston, MA: Springer.
Burstein, P. (2003). The impact of public opinion on public policy: A review and an
agenda. Political Research Quarterly, 56(1), 29–40.
Chen, X., Peterson, M. N., Hull, V., Lu, C., Lee, G. D., Hong, D., et al. (2011). Effects of
attitudinal and sociodemographic factors on pro-environmental behavior in urban
China. Environmental Conservation, 38(1), 45–52.
Clarke, D., Murphy, C., & Lorenzoni, I. (2018). Place attachment, disruption and transformative adaptation. Journal of Environmental Psychology, 55, 81–89.
Corner, A., Venables, D., Spence, A., Poortinga, W., Demski, C., & Pidgeon, N. (2011).
Nuclear power, climate change and energy security: Exploring British public attitudes. Energy Policy, 39(9), 4823–4833.
Dabaieh, M., & Alwall, J. (2018). Building now and building back. Refugees at the centre
of an occupant driven design and construction process. Sustainable Cities and Society,
37, 619–627.
Dawadi, S., & Ahmad, S. (2013). Evaluating the impact of demand-side management on
water resources under changing climatic conditions and increasing population.
Journal of Environmental Management, 114, 261–275.
de Franca Doria, M., Pidgeon, N., & Hunter, P. (2005). Perception of tap water risks and
quality: A structural equation model approach. Water Science and Technology, 52(8),
143.
de Franca Doria, M., Pidgeon, N., & Hunter, P. R. (2009). Perceptions of drinking water
quality and risk and its effect on behaviour: A cross-national study. Science of the Total
Environment, 407(21), 5455–5464.
Destatis (2018a). Regional statistics. https://www.destatis.de/EN/FactsFigures/
CountriesRegions/RegionalStatistics/RegionalStatistics.html (04.06.18).
Destatis (2018b). Society & state. https://www.destatis.de/EN/Homepage.html
(04.06.18).
Devine-Wright, P. (2007). Reflections on place attachment and favourite places. IAPS
Bulletin, 31, 6–8.
Devine-Wright, P. (2009). Rethinking NIMBYism: The role of place attachment and place
identity in explaining place-protective action. Journal of Community & Applied Social
Psychology, 19(6), 426–441.
Devine-Wright, P. (2013). Think global, act local? The relevance of place attachments and
14
�Sustainable Cities and Society 48 (2019) 101508
F. Araya, et al.
projects. Journal of Construction Engineering and Management, 142(2), 05015013.
https://doi.org/10.1061/(ASCE)CO.1943-7862.0001039.
Johnson, C., Lizarralde, G., & Davidson, C. H. (2006). A systems view of temporary
housing projects in post-disaster reconstruction. Construction Management and
Economics, 24(4), 367–378.
Jorgensen, B., Graymore, M., & O’Toole, K. (2009). Household water use behavior: An
integrated model. Journal of Environmental Management, 91(1), 227–236.
Kasarda, J. D., & Janowitz, M. (1974). Community attachment in mass society. American
Sociological Review, 328–339.
Katz, B., Noring, L., & Garrelts, N. (2016). Cities and refugees: The German experience.
Washington, DC: Brookings Institution Press/Centennial Scholar Initiative at
Brookings.
Kelley, K., Clark, B., Brown, V., & Sitzia, J. (2003). Good practice in the conduct and
reporting of survey research. International Journal for Quality in Health Care, 15(3),
261–266.
Kinawy, S. N., Bakht, M. N., & El-Diraby, T. E. (2017). Mismatches in stakeholder communication: The case of the Leslie and Ferrand transit stations, Toronto, Canada.
Sustainable Cities and Society, 34, 239–249.
Kingston, R., Carver, S., Evans, A., & Turton, I. (2000). Web-based public participation
geographical information systems: An aid to local environmental decision-making.
Computers, Environment and Urban Systems, 24(2), 109–125.
Klineberg, S. L., McKeever, M., & Rothenbach, B. (1998). Demographic predictors of
environmental concern: It does make a difference how it's measured. Social Science
Quarterly, 734–753.
Knoeri, C., Steinberger, J. K., & Roelich, K. (2016). End-user centred infrastructure operation: Towards integrated end-use service delivery. Journal of Cleaner Production,
132, 229–239.
Kolankiewicz, L., Griffith, B., Camarota, S. A., & Beck, R. (2015). Immigration, population
growth, and the environment. Center for Immigration Studies.
Kosho, J. (2016). Media influence on public opinion attitudes toward the migration crisis.
International Journal of Scientific & Technology Research, 5(5).
Krosnick, J. A., Holbrook, A. L., Berent, M. K., Carson, R. T., Hanemann, W., Kopp, R. J.,
et al. (2002). The impact of ‘no opinion’ response options on data quality: Non-attitude reduction or an invitation to satisfice? Public Opinion Quarterly, 66(3),
371–403.
Krosnick, J. A., Judd, C. M., & Wittenbrink, B. (2005). The measurement of attitudes. The
handbook of attitudes, Vol. 21, 76.
Leung, M. Y., Yu, J., & Liang, Q. (2013). Improving public engagement in construction
development projects from a stakeholder's perspective. Journal of Construction
Engineering and Management, 139(11), 04013019. https://doi.org/10.1061/
(ASCE)CO.1943-7862.0000754.
Lewicka, M. (2011). Place attachment: How far have we come in the last 40 years?
Journal of Environmental Psychology, 31(3), 207–230.
Li, H., Zhang, X., Ng, S. T., & Skitmore, M. (2018). Quantifying stakeholder influence in
decision/evaluations relating to sustainable construction in China – A Delphi approach. Journal of Cleaner Production, 173, 160–170.
Li, T. H., Ng, S. T., & Skitmore, M. (2013). Evaluating stakeholder satisfaction during
public participation in major infrastructure and construction projects: A fuzzy approach. Automation in Construction, 29, 123–135.
Little, R. G. (2002). Controlling cascading failure: Understanding the vulnerabilities of
interconnected infrastructures. Journal of Urban Technology, 9(1), 109–123.
Massachusetts Institute of Technology (MIT) (2003). The future of nuclear power. An interdisciplinary MIT study. Cambridge, MA: MIT Press.
Massachusetts Institute of Technology (MIT) (2007). The future of coal. An interdisciplinary
MIT study. Cambridge, MA: MIT Press.
McCright, A. M. (2010). The effects of gender on climate change knowledge and concern
in the American public. Population and Environment, 32(1), 66–87.
McCrum-Gardner, E. (2008). Which is the correct statistical test to use? British Journal of
Oral and Maxillofacial Surgery, 46(1), 38–41.
Mitchell, C. M., Esnard, A.-M., & Sapat, A. (2012). Hurricane events, population displacement, and sheltering provision in the United States. Natural Hazards Review.
https://doi.org/10.1061/(ASCE)NH.1527-6996.0000064.
Mostafa, M. A., & El-Gohary, N. M. (2014). Stakeholder-sensitive social welfare-oriented
benefit analysis for sustainable infrastructure project development. Journal of
Construction Engineering and Management. https://doi.org/10.1061/(ASCE)CO.19437862.0000788.
Olander, S. (2007). Stakeholder impact analysis in construction project management.
Construction Management and Economics, 25(3), 277–287.
O’Leary, Z. (2004). The essential guide to doing research. Sage.
Opdyke, A., Lepropre, F., Javernick-Will, A., & Koschmann, M. (2017). Inter-organizational resource coordination in post-disaster infrastructure recovery. Construction
Management and Economics, 35(8–9), 514–530.
Operational Portal Refugee Situations. (2019). Available online: https://data2.unhcr.org/
en/situations/mediterranean/location/5179 (13.02.19).
Orabi, W., El-Rayes, K., Senouci, A. B., & Al-Derham, H. (2009). Optimizing postdisaster
reconstruction planning for damaged transportation networks. Journal of Construction
Engineering and Management. https://doi.org/10.1061/(ASCE)CO.1943-7862.
0000070.
Peck, R., & Devore, J. L. (2011). Statistics: The exploration & analysis of data. Cengage
Learning.
Perkins, D. D., & Long, D. A. (2002). Neighborhood sense of community and social capital.
Psychological sense of community. Springer US291–318.
Phillips, A. (2018). Los Angeles Times ‘Where do people go?’: Camp fire makes California's
housing crisis worse. https://www.latimes.com/local/lanow/la-me-paradise-housingshortage-20181123-story.html (13.02.19).
Prouty, C., Koenig, E. S., Wells, E. C., Zarger, R. K., & Zhang, Q. (2017). Rapid assessment
framework for modeling stakeholder involvement in infrastructure development.
Sustainable Cities and Society, 29, 130–138.
Qualtrics. (2016). https://www.qualtrics.com/homepage/.
Quillian, L. (1995). Prejudice as a response to perceived group threat: Population composition and anti-immigrant and racial prejudice in Europe. American Sociological
Review, 586–611.
Rinaldi, S. M., Peerenboom, J. P., & Kelly, T. K. (2001). Identifying, understanding and
analyzing critical infrastructure interdependencies. IEEE Control Systems Magazine,
21(6), 11–25.
Rollero, C., & De Piccoli, N. (2010). Place attachment, identification and environment
perception: An empirical study. Journal of Environmental Psychology, 30(2), 198–205.
Savage, S. J., & Waldman, D. M. (2008). Learning and fatigue during choice experiments:
A comparison of online and mail survey modes. Journal of Applied Econometrics,
23(3), 351–371.
Schneider, K. (2017). Massive infrastructure projects are failing at unprecedented rates.
National Geographic https://news.nationalgeographic.com/2017/11/mega-projectsfail-infrastructure-energy-dams-nuclear/ (08.04.18).
Semyonov, M., Raijman, R., & Gorodzeisky, A. (2006). The rise of anti-foreigner sentiment in European societies, 1988–2000. American Sociological Review, 71(3),
426–449.
Shafizadeh, K., & Mannering, F. (2006). Statistical modeling of user perceptions of infrastructure condition: Application to the case of highway roughness. Journal of
Transportation Engineering, 132(2), 133–140. https://doi.org/10.1061/(ASCE) 0733947X(2006)132:2(133).
Soroka, S. N., & Wlezien, C. (2004). Opinion representation and policy feedback: Canada
in comparative perspective. Canadian Journal of Political Science, 37(3), 531–559.
Sterett, S. M. (2011). Need and citizenship after disaster. Natural Hazards Review. https://
doi.org/10.1061/(ASCE)NH.1527-6996.0000072.
Sullivan, K., Samuels, R., & Wax-Thibodeaux, E. (2017). More than 30,000 people expected in shelters as extent of Harvey's blow comes into chilling focus. The
Washington Post https://www.washingtonpost.com/politics/full-extent-of-harveysaftermath-starts-to-come-into-chilling-focus/2017/08/27/1b2b184a-8b56-11e78df5c2e5cf46c1e2_story.html?utm_term=.129f454a059b (25.04.18).
Sun, C., & Xu, J. (2010). Estimation of time for Wenchuan earthquake reconstruction in
China. Journal of Construction Engineering and Management, 137(3), https://doi.org/
10.1061/(ASCE)CO.1943-7862.0000277.
Sutter, J. (2018). 130,000 left Puerto Rico after Hurricane Maria, Census Bureau says. CNN
https://www.cnn.com/2018/12/19/health/sutter-puerto-rico-census-update/index.
html (13.02.19).
Teo, M. M., & Loosemore, M. (2011). Community-based protest against construction
projects: A case study of movement continuity. Construction Management and
Economics, 29(2), 131–144.
Teo, M. M., & Loosemore, M. (2017). Understanding community protest from a project
management perspective: A relationship-based approach. International Journal of
Project Management, 35(8), 1444–1458.
The Guardian (2015). Refugee crisis: Germany creaks under strain of open door policy.
https://www.theguardian.com/world/2015/oct/08/refugee-crisis-germany-creaksunder-strain-of-open-door-policy (25.08.18).
The Guardian (2016). German elections: Setbacks for Merkel's CDU as anti-refugee AfD makes
big gains. https://www.theguardian.com/world/2016/mar/13/anti-refugee-partymakes-big-gains-in-german-state-elections (25.08.18).
The New York Times (2015). Germany's small towns feel the cost of Europe's migrant crisis.
https://www.nytimes.com/2015/04/23/world/europe/germany-immigrationrefugees-asylum-integration.html (25.08.18).
Thomson Reuters (2018). Germany's housing crisis fuels black market for refugees. https://
www.reuters.com/article/us-germany-refugees-housing-feature/germanys-housingcrisis-fuels-black-market-for-refugees-idUSKCN1MW1H9 (11.02.19).
UNHCR (2017). Global trends. Forced displacement in 2016. http://www.unhcr.org/
globaltrends2016/ (09.01.17).
UNHCR (Office of the United Nations High Commissioner for Refugees (2015a). Seven
factors behind movement of Syrian refugees to Europe. Briefing notes, September 25.
http://www.unhcr.org/560523f26.html (13.01.17).
UNHCR (Office of the United Nations High Commissioner for Refugees (2015b). Wars in
Syria and Iraq drive highest asylum numbers in 22 years. Press releases, March 26.
http://www.unhcr.org/en-us/news/press/2015/3/5512b8d59/wars-syria-iraqdrive-highest-asylum-numbers-22-years.html?query=Iraq%20war (13.01.17).
UNHCR (Office of the United Nations High Commissioner for Refugees) (2016). Global
trends: Forced displacement in 2015, 20 June 2016. http://www.refworld.org/docid/
57678f3d4.html (09.01.17).
UNHCR (Office of the United Nations High Commissioner for Refugees) (2018). Global
trends: Forced displacement in 2017, 25 June 2018. http://www.unhcr.org/
5b27be547.pdf (26.08.18).
UNHCR (Office of the United Nations High Commissioner for Refugees) (2019). Regional
refugee and migrant response plan for refugees and migrants from Venezuela. https://
www.unhcr.org/partners/donors/5c330bc74/2019-regional-refugee-migrantresponse-plan-refugees-migrants-venezuela.html (12.02.19).
Valentin, V., Naderpajouh, N., & Abraham, D. (2017). Impact of characteristics of infrastructure projects on public opinion. Journal of Management in Engineering, 34(1),
04017051.
Valentin, V., Naderpajouh, N., & Abraham, D. M. (2018). Integrating the input of stakeholders in infrastructure risk assessment. Journal of Management in Engineering,
34(6), 04018042.
Van der Bruggen, B., Borghgraef, K., & Vinckier, C. (2010). Causes of water supply problems in urbanised regions in developing countries. Water Resources Management,
24(9), 1885–1902.
Varis, O., Biswas, A. K., Tortajada, C., & Lundqvist, J. (2006). Megacities and water
15
�Sustainable Cities and Society 48 (2019) 101508
F. Araya, et al.
qualitative analysis of bottled and filtered water use in U.S. shrinking cities. Journal
of Water Resources Planning and Management (in press).
Yang, R. J., & Shen, G. Q. P. (2014). Framework for stakeholder management in construction projects. Journal of Management in Engineering, 04014064. https://doi.org/
10.1061/(ASCE)ME.1943-5479.0000285.
Yang, Y., Ng, S. T., Xu, F. J., & Skitmore, M. (2018). Towards sustainable and resilient
high density cities through better integration of infrastructure networks. Sustainable
Cities and Society, 42, 407–422.
Zeferino, J. A., Antunes, A. P., & Cunha, M. C. (2012). Regional wastewater system
planning under population dynamics uncertainty. Journal of Water Resources Planning
and Management. https://doi.org/10.1061/(ASCE)WR.1943-5452.0000334.
management. Water Resources Development, 22(2), 377–394.
Verbrugge, L., & Van Den Born, R. (2018). The role of place attachment in public perceptions of a re-landscaping intervention in the river Waal (The Netherlands).
Landscape and Urban Planning, 177, 241–250.
Von Wirth, T., Grêt-Regamey, A., Moser, C., & Stauffacher, M. (2016). Exploring the influence of perceived urban change on residents' place attachment. Journal of
Environmental Psychology, 46, 67–82.
Ward, S., & Chapman, C. (2008). Stakeholders and uncertainty management in projects.
Construction Management and Economics, 26(6), 563–577.
Washington, S., Karlaftis, M., & Mannering, F. (2011). Statistical and econometric methods
for transportation data analysis (2nd ed.). Boca Raton, FL: Chapman & Hall/CRC.
Yang, E., & Faust, K. (2019). Understanding drinking water use behavior: Statistical and
16
�
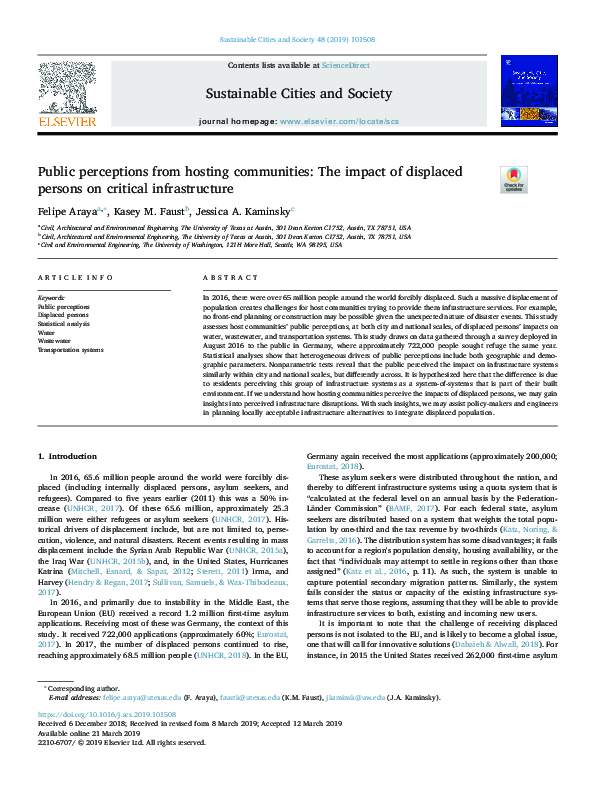
 Felipe Araya