DBSCAN Clustering in ML | Density based clustering

Last Updated : 23 May, 2023
Summarize
Comments
Improve
Suggest changes
Like Article
Like
Save
Share
Report
News Follow

Clustering analysis or simply Clustering is basically an Unsupervised learning method that divides the data points into a number of specific batches or groups, such that the data points in the same groups have similar properties and data points in different groups have different properties in some sense. It comprises many different methods based on differential evolution. 
E.g. K-Means (distance between points), Affinity propagation (graph distance), Mean-shift (distance between points), DBSCAN (distance between nearest points), Gaussian mixtures (Mahalanobis distance to centers), Spectral clustering (graph distance), etc.

Fundamentally, all clustering methods use the same approach i.e. first we calculate similarities and then we use it to cluster the data points into groups or batches. Here we will focus on the Density-based spatial clustering of applications with noise (DBSCAN) clustering method. 

Density-Based Spatial Clustering Of Applications With Noise (DBSCAN)

Clusters are dense regions in the data space, separated by regions of the lower density of points. The DBSCAN algorithm is based on this intuitive notion of “clusters” and “noise”. The key idea is that for each point of a cluster, the neighborhood of a given radius has to contain at least a minimum number of points. 


Why DBSCAN? 

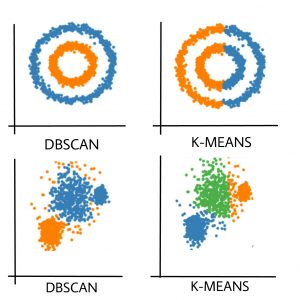
Partitioning methods (K-means, PAM clustering) and hierarchical clustering work for finding spherical-shaped clusters or convex clusters. In other words, they are suitable only for compact and well-separated clusters. Moreover, they are also severely affected by the presence of noise and outliers in the data.

Real-life data may contain irregularities, like:

  1. Clusters can be of arbitrary shape such as those shown in the figure below. 
  2. Data may contain noise.

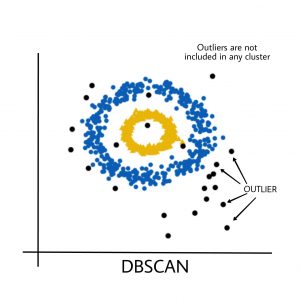
The figure above shows a data set containing non-convex shape clusters and outliers. Given such data, the k-means algorithm has difficulties in identifying these clusters with arbitrary shapes.

Parameters Required For DBSCAN Algorithm

  1. eps: It defines the neighborhood around a data point i.e. if the distance between two points is lower or equal to ‘eps’ then they are considered neighbors. If the eps value is chosen too small then a large part of the data will be considered as an outlier. If it is chosen very large then the clusters will merge and the majority of the data points will be in the same clusters. One way to find the eps value is based on the k-distance graph.
  2. MinPts: Minimum number of neighbors (data points) within eps radius. The larger the dataset, the larger value of MinPts must be chosen. As a general rule, the minimum MinPts can be derived from the number of dimensions D in the dataset as, MinPts >= D+1. The minimum value of MinPts must be chosen at least 3.
     

In this algorithm, we have 3 types of data points.
Core Point: A point is a core point if it has more than MinPts points within eps. 
Border Point: A point which has fewer than MinPts within eps but it is in the neighborhood of a core point. 
Noise or outlier: A point which is not a core point or border point.

Steps Used In DBSCAN Algorithm

  1. Find all the neighbor points within eps and identify the core points or visited with more than MinPts neighbors.
  2. For each core point if it is not already assigned to a cluster, create a new cluster.
  3. Find recursively all its density-connected points and assign them to the same cluster as the core point. 
    A point a and b are said to be density connected if there exists a point c which has a sufficient number of points in its neighbors and both points a and b are within the eps distance. This is a chaining process. So, if b is a neighbor of c, c is a neighbor of d, and d is a neighbor of e, which in turn is  neighbor of a implying that b is a neighbor of a.
  4. Iterate through the remaining unvisited points in the dataset. Those points that do not belong to any cluster are noise.

Pseudocode For DBSCAN Clustering Algorithm 

DBSCAN(dataset, eps, MinPts){
# cluster index
C = 1
for each unvisited point p in dataset {
         mark p as visited
         # find neighbors
         Neighbors N = find the neighboring points of p

         if |N|>=MinPts:
             N = N U N'
             if p' is not a member of any cluster:
                 add p' to cluster C 
}

Implementation Of DBSCAN Algorithm Using Machine Learning In Python 

Here, we’ll use the Python library sklearn to compute DBSCAN. We’ll also use the matplotlib.pyplot library for visualizing clusters.

Import Libraries 

Python3


import matplotlib.pyplot as plt
import numpy as np
from sklearn.cluster import DBSCAN
from sklearn import metrics
from sklearn.datasets import make_blobs
from sklearn.preprocessing import StandardScaler
from sklearn import datasets


Prepare dataset 

We will create a dataset using sklearn for modeling. We make_blob for creating the dataset 

Python3


# Load data in X
X, y_true = make_blobs(n_samples=300, centers=4,
                       cluster_std=0.50, random_state=0)


Modeling The Data Using DBSCAN 

Python3


db = DBSCAN(eps=0.3, min_samples=10).fit(X)
core_samples_mask = np.zeros_like(db.labels_, dtype=bool)
core_samples_mask[db.core_sample_indices_] = True
labels = db.labels_
 
# Number of clusters in labels, ignoring noise if present.
n_clusters_ = len(set(labels)) - (1 if -1 in labels else 0)
 
# Plot result
 
# Black removed and is used for noise instead.
unique_labels = set(labels)
colors = ['y', 'b', 'g', 'r']
print(colors)
for k, col in zip(unique_labels, colors):
    if k == -1:
        # Black used for noise.
        col = 'k'
 
    class_member_mask = (labels == k)
 
    xy = X[class_member_mask & core_samples_mask]
    plt.plot(xy[:, 0], xy[:, 1], 'o', markerfacecolor=col,
             markeredgecolor='k',
             markersize=6)
 
    xy = X[class_member_mask & ~core_samples_mask]
    plt.plot(xy[:, 0], xy[:, 1], 'o', markerfacecolor=col,
             markeredgecolor='k',
             markersize=6)
 
plt.title('number of clusters: %d' % n_clusters_)
plt.show()


Output:

Cluster of dataset

Cluster of dataset 

Evaluation Metrics For DBSCAN Algorithm In Machine Learning 

We will use the Silhouette score and Adjusted rand score for evaluating clustering algorithms. Silhouette’s score is in the range of -1 to 1. A score near 1 denotes the best meaning that the data point i is very compact within the cluster to which it belongs and far away from the other clusters. The worst value is -1. Values near 0 denote overlapping clusters.

Absolute Rand Score is in the range of 0 to 1. More than 0.9 denotes excellent cluster recovery, and above 0.8 is a good recovery. Less than 0.5 is considered to be poor recovery. 

Python3


# evaluation metrics
sc = metrics.silhouette_score(X, labels)
print("Silhouette Coefficient:%0.2f" % sc)
ari = adjusted_rand_score(y_true, labels)
print("Adjusted Rand Index: %0.2f" % ari)


Output:

Coefficient:0.13
Adjusted Rand Index: 0.31

Black points represent outliers. By changing the eps and the MinPts, we can change the cluster configuration.
Now the question that should be raised is – 

When Should We Use DBSCAN Over K-Means In Clustering Analysis?

DBSCAN(Density-Based Spatial Clustering of Applications with Noise) and K-Means are both clustering algorithms that group together data that have the same characteristic. However, They work on different principles and are suitable for different types of data. We prefer to use DBSCAN when the data is not spherical in shape or the number of classes is not known beforehand.

Difference Between DBSCAN and K-Means.


                        DBSCAN                                                         K-Means                            

In DBSCAN we need not specify the number

of clusters.

K-Means is very sensitive to the number of clusters so it 

need to specified

Clusters formed in DBSCAN can be of any arbitrary shape.

Clusters formed in K-Means are spherical or 

convex in shape

DBSCAN can work well with datasets having noise and outliers

K-Means does not work well with outliers data. Outliers 

can skew the clusters in K-Means to a very large extent. 

In DBSCAN two parameters are required for training the Model

In K-Means only one parameter is required is for training 

the model

Clusters formed in K-means and DBSCAN
Clusters formed in K-means and DBSCAN

Outlier influence on DBSCAN

Outlier influence on DBSCAN

More differences between these two algorithms can be found here


Previous Article
Next Article

Similar Reads

DBSCAN for Clustering Data by Location and Density in R
Clustering is an important technique in data analysis used to group similar data points together. One of the popular clustering algorithms is DBSCAN (Density-Based Spatial Clustering of Applications with Noise). Unlike other clustering methods such as K-Means, DBSCAN does not require the user to specify the number of clusters beforehand. Instead, i
5 min read
Difference between CURE Clustering and DBSCAN Clustering
Clustering is a technique used in Unsupervised learning in which data samples are grouped into clusters on the basis of similarity in the inherent properties of the data sample. Clustering can also be defined as a technique of clubbing data items that are similar in some way. The data items belonging to the same clusters are similar to each other i
2 min read
DBScan Clustering in R Programming
Density-Based Clustering of Applications with Noise(DBScan) is an Unsupervised learning Non-linear algorithm. It does use the idea of density reachability and density connectivity. The data is partitioned into groups with similar characteristics or clusters but it does not require specifying the number of those groups in advance. A cluster is defin
3 min read
Hierarchical Density-Based Spatial Clustering of Applications with Noise (HDBSCAN)
Clustering is a machine-learning technique that divides data into groups, or clusters, based on similarity. By putting similar data points together and separating dissimilar points into separate clusters, it seeks to uncover underlying structures in datasets. In this article, we will focus on the HDBSCAN (Hierarchical Density-Based Spatial Clusteri
6 min read
DBSCAN Full Form
DBSCAN stands for Density-Based Spatial Clustering of Applications with Noise. It is a popular unsupervised learning method used for model construction and machine learning algorithms. It is a clustering method utilized for separating high-density clusters from low-density clusters. It divides the data points into many groups so that points lying i
2 min read
Implementing DBSCAN algorithm using Sklearn
Prerequisites: DBSCAN Algorithm Density Based Spatial Clustering of Applications with Noise(DBCSAN) is a clustering algorithm which was proposed in 1996. In 2014, the algorithm was awarded the 'Test of Time' award at the leading Data Mining conference, KDD. Dataset - Credit Card Step 1: Importing the required libraries import numpy as np import pan
3 min read
ML | DBSCAN reachability and connectivity
Prerequisite : DBSCAN Clustering in ML Density-based clustering algorithm has played a vital role in finding nonlinear shapes structure based on the density. Density-Based Spatial Clustering of Applications with Noise (DBSCAN) is the most widely used density-based algorithm. It uses the concept of density reachability and density connectivity. Cons
2 min read
Difference Between Agglomerative clustering and Divisive clustering
Hierarchical clustering is a popular unsupervised machine learning technique used to group similar data points into clusters based on their similarity or dissimilarity. It is called "hierarchical" because it creates a tree-like hierarchy of clusters, where each node represents a cluster that can be further divided into smaller sub-clusters. There a
5 min read
Social Network Analysis Based on BSP Clustering Algorithm
Social Network Analysis (SNA) is a powerful tool used to study the relationships and interactions within a network of individuals, organizations, or other entities. It helps in uncovering patterns, identifying influential nodes, and understanding the overall structure of the network. One of the critical aspects of SNA is the ability to cluster simi
6 min read
Clustering Based Algorithms in Recommendation System
Recommendation systems have become an essential tool in various industries, from e-commerce to streaming services, helping users discover products, movies, music, and more. Clustering-based algorithms are a powerful technique used to enhance these systems by grouping similar users or items, enabling more personalized and accurate recommendations. T
5 min read
Non Parametric Density Estimation Methods in Machine Learning
Non-parametric methods: Similar inputs have similar outputs. These are also called instance-based or memory-based learning algorithms. There are 4 Non - parametric density estimation methods: Histogram EstimatorNaive EstimatorKernel Density Estimator (KDE)KNN estimator (K - Nearest Neighbor Estimator)Histogram Estimator It is the oldest and the mos
5 min read
Histograms and Density Plots in R
A histogram is a graphical representation that organizes a group of data points into user-specified ranges and an approximate representation of the distribution of numerical data. In R language the histogram is built with the use of the hist() function. Syntax: hist(v,main,xlab,xlim,ylim,breaks,col,border) Parameters: v:- It is a vector containing
3 min read
Probability Density Estimation & Maximum Likelihood Estimation
Probability density and maximum likelihood estimation (MLE) are key ideas in statistics that help us make sense of data. The probability density function (PDF) tells us how likely different outcomes are for a continuous variable, while Maximum Likelihood Estimation helps us find the best-fitting model for the data we observe. By understanding these
9 min read
What is the difference between word-based and char-based text generation RNNs?
Answer: Word-based RNNs generate text based on words as units, while char-based RNNs use characters as units for text generation.Word-based RNNs emphasizing semantic meaning and higher-level structures, while char-based RNNs excel in capturing finer character-level patterns. AspectWord-based RNNsChar-based RNNsUnit of ProcessingOperates on words as
2 min read
Clustering in R Programming
Clustering in R Programming Language is an unsupervised learning technique in which the data set is partitioned into several groups called clusters based on their similarity. Several clusters of data are produced after the segmentation of data. All the objects in a cluster share common characteristics. During data mining and analysis, clustering is
6 min read
Analysis of test data using K-Means Clustering in Python
This article demonstrates an illustration of K-means clustering on a sample random data using open-cv library. Pre-requisites: Numpy, OpenCV, matplot-lib Let's first visualize test data with Multiple Features using matplot-lib tool. # importing required tools import numpy as np from matplotlib import pyplot as plt # creating two test data X = np.ra
2 min read
Different Types of Clustering Algorithm
The introduction to clustering is discussed in this article and is advised to be understood first. The clustering Algorithms are of many types. The following overview will only list the most prominent examples of clustering algorithms, as there are possibly over 100 published clustering algorithms. Not all provide models for their clusters and can
5 min read
ML | Unsupervised Face Clustering Pipeline
Live face-recognition is a problem that automated security division still face. With the advancements in Convolutions Neural Networks and specifically creative ways of Region-CNN, it’s already confirmed that with our current technologies, we can opt for supervised learning options such as FaceNet, YOLO for fast and live face-recognition in a real-w
15+ min read
ML | Determine the optimal value of K in K-Means Clustering
Prerequisite: K-Means Clustering | IntroductionThere is a popular method known as elbow method which is used to determine the optimal value of K to perform the K-Means Clustering Algorithm. The basic idea behind this method is that it plots the various values of cost with changing k. As the value of K increases, there will be fewer elements in the
2 min read
Image compression using K-means clustering
Prerequisite: K-means clustering The internet is filled with huge amounts of data in the form of images. People upload millions of pictures every day on social media sites such as Instagram, and Facebook and cloud storage platforms such as google drive, etc. With such large amounts of data, image compression techniques become important to compress
6 min read
ML | Mean-Shift Clustering
Meanshift is falling under the category of a clustering algorithm in contrast of Unsupervised learning that assigns the data points to the clusters iteratively by shifting points towards the mode (mode is the highest density of data points in the region, in the context of the Meanshift). As such, it is also known as the Mode-seeking algorithm. Mean
6 min read
ML | K-Medoids clustering with solved example
K-Medoids (also called Partitioning Around Medoid) algorithm was proposed in 1987 by Kaufman and Rousseeuw. A medoid can be defined as a point in the cluster, whose dissimilarities with all the other points in the cluster are minimum. The dissimilarity of the medoid(Ci) and object(Pi) is calculated by using E = |Pi - Ci| The cost in K-Medoids algor
3 min read
ML | OPTICS Clustering Explanation
Prerequisites: DBSCAN Clustering OPTICS Clustering stands for Ordering Points To Identify Cluster Structure. It draws inspiration from the DBSCAN clustering algorithm. It adds two more terms to the concepts of DBSCAN clustering. OPTICS (Ordering Points To Identify the Clustering Structure) is a density-based clustering algorithm, similar to DBSCAN
7 min read
ML | Classification vs Clustering
Prerequisite: Classification and Clustering As you have read the articles about classification and clustering, here is the difference between them. Both Classification and Clustering is used for the categorization of objects into one or more classes based on the features. They appear to be a similar process as the basic difference is minute. In the
2 min read
Criterion Function Of Clustering
Cluster examination isolates information into bunches (clusters) that are important, valuable, or both. In case significant bunches are the objective, at that point, the clusters ought to capture the common structure of the information. In a few cases, be that as it may, cluster investigation is as it were a valuable beginning point for other purpo
2 min read
Difference between Hierarchical and Non Hierarchical Clustering
Hierarchical Clustering: Hierarchical clustering is basically an unsupervised clustering technique which involves creating clusters in a predefined order. The clusters are ordered in a top to bottom manner. In this type of clustering, similar clusters are grouped together and are arranged in a hierarchical manner. It can be further divided into two
2 min read
Hierarchical Clustering in R Programming
Hierarchical clustering in R Programming Language is an Unsupervised non-linear algorithm in which clusters are created such that they have a hierarchy(or a pre-determined ordering). For example, consider a family of up to three generations. A grandfather and mother have their children that become father and mother of their children. So, they all a
3 min read
ML | BIRCH Clustering
Clustering algorithms like K-means clustering do not perform clustering very efficiently and it is difficult to process large datasets with a limited amount of resources (like memory or a slower CPU). So, regular clustering algorithms do not scale well in terms of running time and quality as the size of the dataset increases. This is where BIRCH cl
3 min read
Difference between K means and Hierarchical Clustering
k-means is method of cluster analysis using a pre-specified no. of clusters. It requires advance knowledge of 'K'. Hierarchical clustering also known as hierarchical cluster analysis (HCA) is also a method of cluster analysis which seeks to build a hierarchy of clusters without having fixed number of cluster. Main differences between K means and Hi
2 min read
Image Segmentation using K Means Clustering
Image Segmentation: In computer vision, image segmentation is the process of partitioning an image into multiple segments. The goal of segmenting an image is to change the representation of an image into something that is more meaningful and easier to analyze. It is usually used for locating objects and creating boundaries. It is not a great idea t
4 min read