Power BI – Administration Role

Last Updated : 13 Dec, 2023
Comments
Improve
Suggest changes
Like Article
Like
Save
Share
Report
News Follow

The Administration role allows users to manage and administer the Power BI service. Users with this role have access to administrative features such as managing users, workspaces, and data sources, setting up security policies, and monitoring usage and performance. To administrate Power BI for you, your organization should either Power BI Admin or Power Platform Admin, or Microsoft 365 Global Admin.


Limitations and Considerations

  • Ability to modify users and licenses within the Microsoft 365 admin center. Depending on the admin role assigned, there may be limitations on the level of access to certain areas of the Power BI service.
  • Access to audit logs.
  • Admin roles in Power BI have significant control over the service, including user accounts and data. It’s important to ensure that appropriate security measures are in place to prevent unauthorized access or misuse of the service.

Administrator roles related to Power BI

  • Global Admin: A Global admin is a user with full access to the entire Microsoft 365 or Azure Active Directory environment, which includes Power BI. They have complete control over the user accounts and permissions, including access to Power BI.
  • Billing Admin: A Billing admin has access to billing and subscription management for Power BI. They can view and manage the subscription details, purchase additional licenses, and manage billing and payment options.
  • License Admin: A License admin has control over the Power BI licenses assigned to users in an organization. They can view and manage license assignments, assign or remove licenses, and control the access level of each license.
  • User Admin: A User admin has control over user accounts and permissions in Power BI. They can create and manage user accounts, assign roles and permissions, and control access to content and data in Power BI.
  • Power Platform Administrator: A Platform admin has control over a specific Platform in Power BI. They can manage content, add or remove members, and configure permissions for the Platform.
  • Power BI Admin: Full access to Power BI management tasks, Enable and disable Power BI features, Report on usage and performance, Review and manage to audit.
  • Power BI Premium Capacity Administrator: Assign workspaces to the capacity, manage user permission to the capacity, and manage workloads to configure memory usage.
  • Power BI Embedded Capacity Administrator: Assign workspaces to the capacity Manage user permission to the capacity Manage workloads to configure memory usage.
Type of administrator Administrative scope Power BI tasks
Global Administrator Microsoft 365 Has unlimited access to all management features for the organization
Assigns roles to other users
Billing Administrator Microsoft 365 Manage subscriptions
Purchase licenses
License Administrator Microsoft 365 Assign or remove licenses for users
User admin Microsoft 365 Create and manage users and groups
Reset user passwords
Power Platform Administrator Power Platform Full access to Power BI management tasks
Enable and disable Power BI features
Report on usage and performance
Review and manage auditing
Power BI Administrator Power BI service Full access to Power BI management tasks
Enable and disable Power BI features
Report on usage and performance
Review and manage to auditto audit
Power BI Premium Capacity
Administrator
A single premium capacity Assign workspaces to the capacity
Manage user permission to the capacity
Manage workloads to configure memory usage
Power BI Embedded Capacity
Administrator
A single Embedded capacity Assign workspaces to the capacity
Manage user permission to the capacity
Manage workloads to configure memory usage

Administrative Tasks and Tools

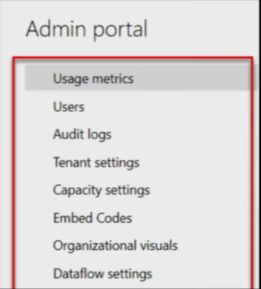
  • Usage Metrics: They provide information on how users are interacting with content in Power BI, such as report views, data refreshes, and user activity.
  • Users: It includes creating and managing user accounts, assigning roles and permissions, and controlling user access to content and data.
  • Audit Logs: These include sign-in and sign-out activity, changes to content and data, and security-related events. For the purpose of compliance, security, and troubleshooting, this information can be used.
  • Tenant Settings: They control how security rules are applied, how long data is retained, and whether or not certain features are enabled or disabled.
  • Capacity settings: Setting the CPU, memory, and storage capacities. Using this data will improve performance and guarantee proper resource allocation.
  • Embed Codes: These allow content to be embedded in external websites or applications. Administrators can generate embed codes, manage the usage of embed codes, and control access to embedded content.
  • Organizational Visuals: They allow administrators to create and manage custom visualizations that can be used across the organization. This can be useful for ensuring consistency and standardization in reporting and analytics.
  • Dataflow Settings: It provides control over the configuration of dataflows, including setting up data source connections, managing data refresh schedules, and controlling data transformations.
Power BI - Administration Role


Purchasing

In Power BI, the admin role of Purchasing is responsible for managing the purchasing and licensing of Power BI products for the organization. Microsoft Power BI could be a freshly designed tool from Microsoft, that consists of the subsequent elements that are Power BI Desktop, Power BI Service, and Connector entry

  • Acquiring Power BI licenses: The Purchasing admin is in charge of doing this for the company and making sure that the appropriate amount of licenses is purchased for the users who require them.
  • Managing licenses: The purchasing administrator is in charge of allocating and assigning Power BI licenses to users inside the company. To access the necessary Power BI functionality, they make sure each user has the proper license.
  • Renewing licenses: The purchasing administrator makes sure that Power BI licenses are renewed on time and that the use of the software is not hampered by expired licenses.
  • Managing costs: The buying administrator is in charge of keeping costs for obtaining and renewing Power BI licenses. They make sure the business is getting the most value for its money and that the licensing expenses are within its set spending limits.

Security

The admin role of Security is responsible for managing the security of the Power BI environment and ensuring that the data within it is protected. This includes:

  • Managing access to Power BI: Controlling who has access to Power BI and what level of access they have is the responsibility of the security administrator. They create security groups, manage user accounts, and give the proper permissions and roles to users, ensuring that only authorized individuals have access to the data.
  • Data security: The Security Admin is responsible for ensuring that Power BI data is secure. To this end, privacy policies must be established, data classification must be controlled, and only authorized users should have access to sensitive information.
  • Monitoring and Auditing: to ensure that security policies are followed and to identify potential security issues, the Security Officer monitors and audits the Power BI environment. He or she also performs routine security audits to find and address potential vulnerabilities.
  • Compliance: The Security Administrator ensures that Power BI’s environment complies with all applicable data privacy laws, including GDPR and CCPA.

Also, When a user logs in to the Power BI service using their Azure Active Directory (AAD) credentials, AAD authentication is used in Power BI. When a user logs in to the Power BI service using their Azure Active Directory (AAD) credentials, AAD authentication is used in Power BI. Network security, security for multitenant environments, and security mostly based on AAD.

Rest API

The admin position in Power BI is in charge of administering and setting up different elements of the Power BI platform. Working with the Power BI REST API to programmatically administer the Power BI system is one of the main duties of the Power BI administrator.

Power BI resources, such as workspaces, datasets, reports, dashboards, and users, may be managed programmatically via the Power BI REST API, which is a collection of HTTP endpoints. Power BI administrators may automate the creation, modification, and deletion of Power BI resources as well as the integration of Power BI with other programmers and systems by using the REST API.

The REST API is based on OData Standards, which gives a common syntax for accessing and altering data on the web. The API is so easy to use and can be accessed by a variety of the programming languages such as C#, Java, Python, and PowerShell.

  • Managing workspaces: Admins can create, amend, and delete workspaces as well as add and remove people from workspaces using the Power BI REST API.
  • Managing datasets: The creation, deletion, and updating of datasets, as well as the management of the schema and data sources connected to the datasets, may all be automated using the REST API.
  • Managing reports and dashboards: Admins can use the API to automatically create, delete, and modify reports and dashboards as well as control the data sources, visualizations, and filters that are contained inside them.
  • Managing users and permissions: The Power BI environment’s REST API may be used to automatically manage users and their permissions.
  • Configuring security: Setting up security: For Power BI resources like workspaces, datasets, and reports, security settings can be set up using the REST API. Role-based access control, row-level security, and organizational content packs management are all included in this.
  • Embedding reports and dashboards: Reports and dashboards can be programmatically embedded into unique applications or websites using the REST API, which is available to admins. This might be helpful for developing unique dashboards for certain business requirements or for including reports inside of already-existing apps.
  • Automating data refresh: Data refresh automation is possible for admins thanks to the Power BI REST API for datasets, reports, and dashboards. This can help to guarantee that information is current and that reports are correct.
  • Management capacity: The REST API may be used to configure capacity settings, scale up or down capacity, and monitor consumption and performance for Power BI.
  • Managing dataflows: The REST API allows admins to automate the creation and management of dataflows, which are used to extract, transform, and load data into Power BI. This includes creating dataflow definitions, configuring dataflow entities, and managing dataflow refresh.

Assign Users to an Admin Role

Assign Users to an Admin Role can be done by:

  • With Microsoft 365 admin center
  • With PowerShell
Power BI - Administration Role


With Microsoft 365 admin center

Follow these steps t assign users to an Admin Role:

  1. In the Microsoft 365 admin center, select Users>Active Users.
  2. Select the user that you want to assign the role to and under Roles, select manage roles.
  3. Expand Show all by category, then select power BI admin or power platform admin.
Power BI - Administration Role


Assign users to the admin role with PowerShell

Follow these steps t assign users to an Admin Role:

  1. Connect to Azure AD: PS “C:\Windows\system32>Connect-AzureAD”
  2. Get the ObjectID for the Power BI admin role. You can run “Get-AzureADDirectoryRole” to get the ObjectID
  3. Next, get the user’s ObjectID. You can find that by “Get-AzureADUser”.
  4. To add the member to the role, run “Add-AzureADDirectoryRoleMember”.
Power BI - Administration Role


To learn more about using PowerShell to assign admin roles, see AzureAD Directory Roles. https://learn.microsoft.com/en-us/powershell/module/azuread/?view=azureadps-2.0#directory-roles. After, assigning the admin role, you’ll get the admin portal by clicking on Settings>Admin portal, which looks like this.

Power BI - Administration Role


Similar Reads

Power BI - Differences Between Microsoft Power BI and SSRS
In this article, we will cover what is SSRS and Power BI, their Features, Types, and Differences Between Microsoft Power BI and SSRS. What is SQL SSRS (Server Reporting Services)?SSRS stands for SQL Server Reporting Services. A tool developed by Microsoft is used to create visualizations and reports on data such as graphs, tables, charts, etc. It c
5 min read
Connect Power BI Desktop with Power BI Service
Power BI Desktop is the system version of Power BI present in the local system, It is downloaded as a free application. The comprehensive report authoring tool for report designers is Power BI Desktop. You can connect to many data sources through the desktop and then turn the data into a data model. The addition of visuals based on the data model i
5 min read
Power BI : Hiding tables, columns, and fields from Power Pivot
A robust data modeling tool in Power BI called Power Pivot enables users to build data models by fusing several data sources, building relationships, and including computed columns and metrics. But occasionally you might want to exclude some tables, columns, or fields from the Power Pivot view in Power BI. This could be done to clean up the area, s
4 min read
Power BI - How to edit in Power BI App?
Power BI is a data visualization application that lets you connect, transform and find insights into the most pressing matters of your business. It helps in sourcing your data and creating visual dashboards, KPIs, and reports by editing the data as per your concerns. You can collaborate, share and integrate your data easily across products document
8 min read
Power BI - Differences between Power BI personal Gateway and Data Management Gateway
In Power BI, a gateway is a software component that enables secure and seamless data connectivity between Power BI and on-premises data sources. A gateway acts as a bridge between the cloud-based Power BI service and on-premises data sources, allowing you to use Power BI to access and visualize data that is stored on-premises. We may need to use a
5 min read
Power BI - Rise of Microsoft Power BI as a Data Analytics powerhouse
Today's analytics and machine learning both greatly benefit from data science, which deals with data. Finding patterns and interesting findings is made easier with the use of data science and exploratory data analysis. Through data exploration, EDA enables us to learn about entirely new facets of data. Maximizing earnings while also boosting organi
9 min read
Power BI - Explain Self-Service Business Intelligence (SSBI).
Self Service Business Intelligence (SSBI) allows a user to filter, sort, analyze and visualize data himself without the intervention of an organization's BI team or IT teams. Some features of SSBI are: It allows a user to gain insights into the data without having any background or prior experience in using BI tools. SSBI ensures that the user inte
10 min read
Power BI - How to add Video to Dashboard?
A dashboard is only part of the Power BI online service and not the Power BI desktop. Hence, adding a video to a dashboard can only be done in the Power BI online service. Adding a video is a part of tile features/widgets in dashboards. Videos are extremely helpful for a better understanding of a dashboard, as we can provide links to various videos
3 min read
Power BI - How to create a Report using Excel Data in Workspace?
Microsoft Power BI has multiple features and functions to make reports simple and easy to understandable through various techniques. Power BI also has a feature to generate reports using excel files. These excel files may be saved in the local file system or either web-based for example drive or share point. We can choose excel files from any of th
3 min read
Power BI - Tools and Functionalities
Power BI is a Data Visualization and Business Intelligence tool by Microsoft that converts data from different data sources to create various business intelligence reports. It provides interactive visualizations using which end users can create reports and interactive dashboards by themselves. It is highly recommended to download Power-BI tool befo
5 min read
Power BI - Drilling Down and Up in Hierarchies
Prerequisite: Tools and Functionalities This article shows how to drill up and down so as to visualize the data through different levels in Power BI. Using drill-down and drill up on your data points, you can explore in-depth details about your data. When a visual has a hierarchy, you can drill down to reveal additional details. What is Drilling? D
3 min read
Power BI - Maps, Scatterplots and Interactive BI Reports
Prerequisite: Power BI – Timeseries, Aggregation, and Filters This article discusses some important concepts used to create interactive dashboards so as to make large business intelligence decisions. We will be discussing the following topics : MapsScatter plotsInteractive BI Reports Dataset Used: The Excel file 'AmazingMartGeo' contains the 2 data
5 min read
Power BI - Interactive BI Dashboards
A dashboard includes various interactive visualizations that help gain information and make important business intelligence decision. This article discusses various concepts for creating Interactive Dashboards in Power BI. The topics include: Filled MapsPie ChartsBin DistributionTreemap Dataset Used The dataset used is of BankCustomers. Upload the
4 min read
Power BI - DAX Math Functions
A robust set of cloud-based business analytics tools called Power BI makes it simple to combine data from many sources, analyze and visualize information, and share insights. The Mathematical functions in Excel are quite similar to those in Data Analysis Expressions (DAX). Many functions in the Data Analysis Expression (DAX) return tables as oppose
11 min read
Power BI - How to Publish App?
Microsoft Power BI Provides an interface to create and publish our content and reports as an app. With this app, we can include many reports and dashboards in one app and all this information can be accessed by the user or authorized person on the created app. We can also include multiple audiences and can also select what information should be dis
4 min read
Power BI - Ribbon Charts and Multi-Row Card Visualization
In this article, we will learn to implement basic ribbon charts and multi-row card visualization using Power BI. This discusses some important concepts used to create the very common bar and column charts so as to make large business intelligence decisions. We will be discussing the following topics and their implementation in the Power BI desktop.
5 min read
Power BI - How to Create a Waterfall Chart?
A waterfall chart shows a running value as quantities are added or subtracted. It’s helpful to visualize how an underlying value is influenced by a series of positive and negative changes. The columns are usually encoded using color so that you can quickly identify increments and decrements. In a waterfall chart, a particular bar is positioned at t
2 min read
Power BI - How to add Reports to Dashboards?
Reports can be transformed into dashboards, for viewing and explaining purposes. One can add a complete report, to the dashboard, or components of it can also be added. We could also add multiple reports and their components in a single dashboard. In this article, we will learn how to add reports to dashboards. Creating a Dashboard in Power BI One
3 min read
Power BI - Line Clustered Column Chart
In this article, we will learn to implement Line Clustered Column charts using Power BI. This discusses some important concepts used to create the very common Line Clustered Column charts to make large business data analysis. We will be discussing their implementation in the Power BI desktop. Power BI has the capacity to incorporate AI and machine
4 min read
Power BI - DAX Information Functions
Data Analysis Expressions, or DAX, are formulas or expressions that are used for calculations and data analysis. These expressions consist of a number of different functions, operators, and constants that are all evaluated together as a single formula to produce the desired results (value or values). In BI tools like Power BI, DAX formulas are very
5 min read
Power BI - Format Line and Stacked Column Chart
A Line and Stacked Column chart is a combination of a line chart with a stacked column chart. We could add a secondary y-axis, with just 2 mouse clicks in Power BI. We have various options to format line and stacked column charts, we can change the value of the x-axis, y-axis, its title, etc. We can also add various options like series labels, mark
11 min read
Power BI - Add alternative Row Colors to the Table
In Microsoft Power Bi, “Alternate Row Color” is substantially used in a table to display their data more accurately. utmost of the association needs to present their data professionally. Applying alternate and unique colors to the data makes the waste more perfect, making the data view in various formats. It is a very common method to add colors to
2 min read
Managing & Editing Table Relationships | Power BI
Managing and editing table relationships typically refers to the process of defining and maintaining the connections between tables in a relational database. Table relationships are crucial for maintaining data integrity, enforcing referential integrity, and ensuring efficient data retrieval. visualizationsPower BI is a powerful tool to understand
6 min read
Power BI - Add Data Bars to Table
Power Bi Data Bars may be a really powerful feature for visualizing values in a range of cells. supported some conditions, it can facilitate your highlighting of the cells or data range in a worksheet. Power BI - Add Data Bars to Table Power Bi Data Bars feature is a kind of conditional formatting option that combines Data and a Bar Chart inside th
2 min read
Power BI - How to rename a Report in Workspace?
Renaming a report, in the power bi online service is very important. As in a company, the reports change their location from one project to another. Renaming a file is a short process. In this article, we will learn how to rename a report, in a workspace in Power BI. How to rename a Report in Workspace in PowerBI Following are the steps to open a w
2 min read
Power BI - Practical Applications
A feature of Microsoft Office 365 called Power BI gives business users access to insights from their data. Users of the software can visualize information using a range of tools, such as graphs and diagrams. In other words, Power BI serves as a link between your data and the individual who will ultimately utilize it to make crucial decisions. Power
7 min read
Power BI - How to Share a Report?
The reason to develop, Power BI online service was to create a dynamic sharing and updating of reports and dashboards. This helps developers, to work on a real-time project, and also helps to keep track of the entire project by others. Hence, having knowledge of how to share Reports is important. In this article, we will learn how to share the repo
2 min read
Power BI - How to Share the Dashboards?
The reason to develop, Power BI online service was to create a dynamic sharing and updating of reports and dashboards. This helps developers, to work on a real-time project, and also helps to keep track of the entire project by others. Hence, having knowledge of how to share Dashboards is important. In this article, we will learn how to share the d
2 min read
Power BI - How to Delete Dashboard?
In this article, we will learn how to delete a dashboard, in a workspace in PowerBI What is a Workspace? A workspace can be considered a container, where everything related to a report is stored. For example, the data set, report, dashboard, workbook, and its pages. Following are the steps to open a workspace: Step 1: Go to the power bi online serv
2 min read
Power BI - Rename a Dataset in Workspace
In this article, we will learn how to a rename data set, in a workspace in Power BI. What is a Workspace? A workspace can be considered a container, where everything related to a report is stored. For example, the data set, report, dashboard, workbook, and its pages. Following are the steps to open a workspace: Step 1: Go to the power bi online ser
2 min read
Article Tags :