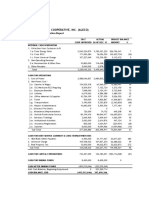
Albay Electric Cooperative, Inc. (Aleco) : 2017 Budget Utilization Report
Albay Electric Cooperative, Inc. (Aleco) : 2017 Budget Utilization Report
Uploaded by
Edsel Alfred OtaoCopyright:
Available Formats
Albay Electric Cooperative, Inc. (Aleco) : 2017 Budget Utilization Report
Albay Electric Cooperative, Inc. (Aleco) : 2017 Budget Utilization Report
Uploaded by
Edsel Alfred OtaoOriginal Title
Copyright
Available Formats
Share this document
Did you find this document useful?
Is this content inappropriate?
Copyright:
Available Formats
Albay Electric Cooperative, Inc. (Aleco) : 2017 Budget Utilization Report
Albay Electric Cooperative, Inc. (Aleco) : 2017 Budget Utilization Report
Uploaded by
Edsel Alfred OtaoCopyright:
Available Formats
ALBAY ELECTRIC COOPERATIVE, INC.
(ALECO)
2017 Budget Utilization Report
(In Philippine Peso)
2017 ACTUAL BUDGET BALANCE
COOP APPROVED AS OF DEC. 31 AMOUNT %
INTERNAL CASH GENERATION
1. Collection from Customers A/R
1.a. From Energy Sales 2,943,524,879 3,150,321,220 206,796,341 7
1.b. From RFSC 171,490,284 76,056,550 (95,433,734) (56)
1.c. From Universal Charge 107,227,069 112,339,581 5,112,512 5
2. Non-Operating Revenue
2.a. Reconnection & Other Fees 10,800,000 114,048,131 103,248,131 956
3. Other Receipts 5,000,000 2,878,578 (2,121,422) (42)
Total 3,238,042,232 3,455,644,059 217,601,827 7
CASH FOR OPERATIONS
1. Cost of Power 2,588,046,837 2,980,833,442 392,786,605 15
2. Non-Power Cost -
2.a. Salaries & Wages 134,525,518 61,965,071 72,560,447 54
2.b. SSS/Medicare/ECC/Pag-Ibig 8,504,874 7,132,724 1,372,150 16
2.c. Employee Benefits 7,848,000 2,124,151 5,723,849 73
2.d. Utilities 6,079,063 4,589,588 1,489,475 25
2.e. Office Materials & Supplies 10,784,109 5,757,559 5,026,550 47
2.f. Travel 500,000 1,806,867 (1,306,867) (261)
2.g. Transportation 3,190,000 5,353,830 (2,163,830) (68)
2.h. Repairs & Maintenance 10,683,000 3,505,536 7,177,464 67
2.i. Directors' Per Diems 0 0 0
2.j. Allowances/Representation 720,000 74,752 645,248 90
2.k. Outside Professional Service 80,194,416 96,844,417 (16,650,001) (21)
2.l. Seminars/Trainings 2,669,900 1,609,641 1,060,259 40
2.m. Institutional Activities 3,062,000 2,614,876 447,124 15
2.n. Insurance/Registration 800,000 1,024,931 (224,931) (28)
2.o. Sundries 8,000,000 9,094,966 (1,094,966) (14)
Sub-Total 277,560,880 203,498,911 74,061,969 27
CASH FOR DEBT SERVICE (CURRENT & LONG-TERM)/OTHER USES
1. NEA/Bank/Other Payables 6,500,000 31,177,027 24,677,027 380
2. Universal Charge 105,548,632 167,837,254 62,288,622 59
3. Real Property Tax 12,000,000 44,632,873 32,632,873 272
Sub-Total 124,048,632 243,647,153 119,598,521 96
CASH FOR CAPITAL EXPENDITURES 733,497,929 142,783,901 (590,714,028) (81)
CASH FOR SINKING FUNDS 8,400,000 8,400,000 0
CASH AFTER SINKING FUNDS (493,512,046) (123,519,349)
Add: Cash Balance, Beginning/Adjustment 0 521,209,714
CASH BALANCE, END (493,512,046) 397,690,366
CAMARINES NORTE ELECTRIC COOPERATIVE, INC. (CANORECO)
2017 Budget Utilization Report
(In Philippine Peso)
2017 ACTUAL BUDGET BALANCE
APPROVED AS OF DEC. 31 AMOUNT %
INTERNAL CASH GENERATION
1. Collection from Customers A/R
1.a. From Energy Sales 1,130,355,342 1,151,530,975 21,175,633 2
1.b. From RFSC 42,446,773 54,647,500 12,200,727 29
1.c. From Universal Charge/FIT-ALL 35,468,300 78,764,096 43,295,796 122
1.d. From VAT 49,650,952 51,363,621 1,712,669 3
2. Non-Operating Revenue
2.a. Reconnection & Other Fees 35,000,000 32,139,901 (2,860,099) (8)
2.b. Interest Income 1,000,000 557,978 (442,022) (44)
3. Other Receipts 45,000,000 7,521,629 (37,478,371) (83)
4. Loan from NEA/Banks/Other Fin. Institutions 90,000,000 (45,206,716) (135,206,716) (150)
5. Subsidy 33,737,540 5,398,825 (28,338,715) (84)
Total 1,462,658,907 1,336,717,811 (125,941,096) (9)
CASH FOR OPERATIONS
1. Cost of Power 822,858,322 957,134,397 134,276,075 16
2. Non-Power Cost -
2.a. Salaries & Wages 72,442,391 63,959,019 8,483,372 12
2.b. SSS/Medicare/ECC/Pag-Ibig 4,672,103 3,932,627 739,476 16
2.c. Employee Benefits 30,844,307 27,752,033 3,092,274 10
2.d. Utilities 2,984,200 3,205,747 (221,547) (7)
2.e. Office Materials & Supplies 5,899,000 3,462,377 2,436,623 41
2.f. Travel 6,123,280 3,837,701 2,285,579 37
2.g. Transportation 8,967,240 5,382,444 3,584,796 40
2.h. Repairs & Maintenance 6,976,200 5,180,572 1,795,628 26
2.i. Directors' Per Diems 2,233,800 1,993,228 240,572 11
2.j. Allowances/Representation 2,754,600 2,342,236 412,364 15
2.k. Outside Professional Service 20,230,112 20,055,528 174,584 1
2.l. Seminars/Trainings 2,832,175 1,381,333 1,450,842 51
2.m. Institutional Activities 7,074,437 3,370,033 3,704,404 52
2.n. Insurance/Registration 1,662,871 588,779 1,074,092 65
2.o. Sundries 4,079,500 2,122,101 1,957,399 48
Sub-Total 179,776,216 148,565,759 31,210,457 17
CASH FOR DEBT SERVICE (CURRENT & LONG-TERM)/OTHER USES
1. NEA/Bank/Other Payables 77,959,518 27,843,006 (50,116,512) (64)
2. Universal Charge/FIT-ALL 35,468,300 76,147,606 40,679,306 115
3. VAT Payable 49,650,952 42,264,763 (7,386,189) (15)
Sub-Total 163,078,770 146,255,375 (16,823,395) (10)
CASH FOR CAPITAL EXPENDITURES 314,147,852 67,472,057 (246,675,795) (79)
CASH FOR SINKING FUNDS 24,635,547 22,147,018 (2,488,529) (10)
CASH AFTER SINKING FUNDS (41,837,800) (4,856,796)
Add: Cash Balance, Beginning/Adjustment 50,865,202 77,276,034
CASH BALANCE, END 9,027,402 72,419,238
CAMARINES SUR I ELECTRIC COOPERATIVE, INC. (CASURECO I)
2017 Budget Utilization Report
(In Philippine Peso)
2017 ACTUAL BUDGET BALANCE
APPROVED AS OF DEC. 31 AMOUNT %
INTERNAL CASH GENERATION
1. Collection from Customers A/R
1.a. From Energy Sales 589,307,693 614,809,870 25,502,177 4
1.b. From RFSC 25,136,026 0 (25,136,026) (100)
1.c. From Universal Charge 31,294,946 0 (31,294,946) (100)
1.d. From VAT 20,971,881 58,662,360 37,690,479 180
2. Non-Operating Revenue
2.a. Reconnection & Other Fees 9,406,289 11,482,904 2,076,615 22
2.b. Interest Income 2,434,562 4,220,068 1,785,506 73
3. Loan 362,644,163 74,989,650 ### (79)
4. Other Receipts 17,304,277 55,619,642 38,315,365 221
Total ### 819,784,494 10,623,806 1
CASH FOR OPERATIONS
1. Cost of Power 468,852,846 456,903,032 (11,949,814) (3)
2. Non-Power Cost -
2.a. Salaries & Wages 58,398,243 60,635,214 (2,236,971) (4)
2.b. SSS/Medicare/ECC/Pag-Ibig 3,997,870 3,946,640 51,230 1
2.c. Employee Benefits 26,814,308 25,503,683 1,310,625 5
2.d. Utilities 653,418 621,155 32,263 5
2.e. Office Materials & Supplies 1,927,437 1,546,519 380,918 20
2.f. Travel 2,003,574 1,992,785 10,789 1
2.g. Transportation 1,507,840 1,976,180 (468,340) (31)
2.h. Repairs & Maintenance 2,742,292 3,362,698 (620,406) (23)
2.i. Directors' Per Diems 1,871,400 1,391,713 479,688 26
2.j. Allowances/Representation 3,735,200 2,884,205 850,995 23
2.k. Outside Professional Service 6,434,058 6,930,751 (496,693) (8)
2.l. Seminars/Trainings 1,126,286 616,572 509,714 45
2.m. Institutional Activities 2,861,201 2,649,604 211,597 7
2.n. Insurance/Registration 977,086 949,508 27,578 3
2.o. Sundries 604,092 603,548 544 0
Sub-Total 115,654,305 115,610,775 43,530 0
CASH FOR DEBT SERVICE (CURRENT & LONG-TERM)/OTHER USES
1. NEA/Bank/Other Payables 151,548,986 76,572,893 (74,976,093) (49)
2. Universal Charge/FIT-ALL 31,294,946 32,542,613 1,247,667 4
3. VAT Payable 26,533,624 33,452,411 6,918,787 26
Sub-Total 209,377,556 142,567,917 (66,809,639) (32)
CASH FOR CAPITAL EXPENDITURES 272,771,400 67,321,829 ### (75)
CASH FOR SINKING FUNDS 32,078,657 31,252,538 (826,119) (3)
CASH AFTER SINKING FUNDS (40,234,927) 6,128,404
Add: Cash Balance, Beginning 43,257,301 43,124,394
CASH BALANCE, END 3,022,374 49,252,798
CAMARINES SUR II ELECTRIC COOPERATIVE, INC. (CASURECO II)
2017 Budget Utilization Report
(In Philippine Peso)
2017 ACTUAL BUDGET BALANCE
APPROVED AS OF DEC. 31 AMOUNT %
INTERNAL CASH GENERATION
1. Collection from Customers A/R
1.a. From Energy Sales 2,059,074,817 2,142,842,260 83,767,443 4
1.b. From RFSC 240,617,791 57,246,556 (183,371,235) (76)
1.c. From Universal Charge 127,197,412 148,066,757 20,869,345 16
1.d. From VAT 201,140,242 164,862,145 (36,278,097) (18)
1.e. From Franchise/Business Tax 1,908,658 1,678,805 (229,853) (12)
2. Non-Operating Revenue
2.a. Reconnection & Other Fees 29,406,548 67,063,977 37,657,428 128
3. Other Receipts 90,686,419 81,372,369 (9,314,051) (10)
4. Subsidy 10,281,417 0 (10,281,417) (100)
NEA Loan & from Other Institution 76,462,725 0 (76,462,725) (100)
Total 2,836,776,029 2,663,132,868 (173,643,161) (6)
CASH FOR OPERATIONS
1. Cost of Power 1,921,387,828 1,886,767,784 (34,620,045) (2)
2. Non-Power Cost -
2.a. Salaries & Wages 81,456,727 86,397,520 (4,940,793) (6)
2.b. SSS/Medicare/ECC/Pag-Ibig 5,499,324 6,600,198 (1,100,874) (20)
2.c. Employee Benefits 43,547,976 36,097,596 7,450,380 17
2.d. Utilities 2,687,044 1,923,047 763,997 28
2.e. Office Materials & Supplies 3,651,252 2,306,243 1,345,009 37
2.f. Travel 3,728,650 1,049,426 2,679,224 72
2.g. Transportation 13,567,096 5,503,232 8,063,864 59
2.h. Repairs & Maintenance 7,485,000 3,184,115 4,300,885 57
2.i. Directors' Per Diems 961,200 902,674 58,526 6
2.j. Allowances/Representation 2,499,600 1,246,023 1,253,577 50
2.k. Outside Professional Service 15,163,181 23,946,879 (8,783,698) (58)
2.l. Seminars/Trainings 1,565,000 156,671 1,408,330 90
2.m. Institutional Activities 10,925,000 4,358,882 6,566,118 60
2.n. Insurance/Registration 3,963,000 369,120 3,593,880 91
2.o. Sundries 2,061,945 694,497 1,367,448 66
Sub-Total 198,761,995 174,736,124 24,025,871 12
CASH FOR DEBT SERVICE (CURRENT & LONG-TERM)/OTHER US
1. NEA/Bank/Other Payables 68,123,614 40,593,073 (27,530,541) (40)
2. Non - Operating Expense 3,382,194 0 (3,382,194) (100)
3. Universal Charge/FIT-ALL 127,197,412 141,168,248 13,970,836 11
4. VAT Payable 201,140,242 93,514,627 (107,625,615) (54)
5. Franchise/Business/ Real Property Taxes 1,908,658 4,209,344 2,300,687 121
Sub-Total 401,752,120 279,485,293 (122,266,827) (30)
CASH FOR CAPITAL EXPENDITURES 322,719,228 41,433,801 (281,285,427) (87)
CASH FOR SINKING FUNDS 105,345,000 110,958,446 5,613,446 5
CASH AFTER SINKING FUNDS (113,190,142) 169,751,421
Add: Cash Balance, Beginning/Adjustments 159,301,493 (10,624,826)
CASH BALANCE, END 46,111,351 159,126,595
CAMARINES SUR III ELECTRIC COOPERATIVE, INC. (CASURECO III)
2017 Budget Utilization Report
(In Philippine Peso)
2017 ACTUAL BUDGET BALANCE
APPROVED AS OF DEC. 31 AMOUNT %
INTERNAL CASH GENERATION
1. Collection from Customers A/R
1.a. From Energy Sales 748,773,143 748,882,975 109,831 0
1.b. From RFSC 39,853,052 43,909,666 4,056,614 10
1.c. From Universal Charge/FIT-ALL 40,916,612 38,793,954 (2,122,658) (5)
1.d. From VAT 9,600,000 84,016,788 74,416,788 775
2. Non-Operating Revenue
2.a. Reconnection & Other Fees 16,800,000 14,834,847 (1,965,153) (12)
2.b. Collection from Non-Operating Revenue 0 5,630,816 5,630,816
3. Other Receipts 7,920,000 154,546,205 146,626,205 1,851
4. NEA Loan 123,271,950 0 ### (100)
Total 987,134,758 ### 226,752,444 23
CASH FOR OPERATIONS
1. Cost of Power 587,720,640 713,794,159 126,073,519 21
2. Non-Power Cost -
2.a. Salaries & Wages 49,192,435 48,109,026 1,083,409 2
2.b. SSS/Medicare/ECC/Pag-Ibig 6,319,665 3,054,563 3,265,102 52
2.c. Employee Benefits 11,971,938 9,007,934 2,964,004 25
2.d. Utilities 931,200 841,476 89,724 10
2.e. Office Materials & Supplies 2,500,000 1,364,244 1,135,756 45
2.f. Travel 1,000,000 807,155 192,845 19
2.g. Transportation 1,107,390 2,224,227 (1,116,837) (101)
2.h. Repairs & Maintenance 1,440,240 1,180,827 259,413 18
2.i. Directors' Per Diems 340,800 226,250 114,550 34
2.j. Allowances/Representation 772,800 790,475 (17,675) (2)
2.k. Outside Professional Service 5,093,000 4,762,733 330,267 6
2.l. Seminars/Trainings 1,472,760 411,249 1,061,511 72
2.m. Institutional Activities 2,991,700 802,641 2,189,059 73
2.n. Insurance/Registration 320,569 493,277 (172,708) (54)
2.o. Sundries 1,598,280 1,261,643 336,637 21
Sub-Total 87,052,777 75,337,718 11,715,059 13
CASH FOR DEBT SERVICE (CURRENT & LONG-TERM)/OTHER USES
1. NEA/Bank/Other Payables 42,090,443 23,323,929 (18,766,515) (45)
2. Non - Operating Expense 90,862,385 71,591,402 (19,270,982) (21)
3. Universal Charge/FIT-ALL 48,368,660 22,520,015 (25,848,645) (53)
4. VAT Payable 9,600,000 644,036 (8,955,964) (93)
5. Real Property Tax 3,000,000 995,146 (2,004,854) (67)
Sub-Total 193,921,488 119,074,527 (74,846,961) (39)
CASH FOR CAPITAL EXPENDITURES 161,879,183 37,592,580 ### (77)
CASH FOR SINKING FUNDS 0 110,968,471 110,968,471
CASH AFTER SINKING FUNDS (43,439,330) 33,847,796
Add: Cash Balance, Beginning 47,853,492 47,853,492
CASH BALANCE, END 4,414,162 81,701,288
CAMARINES SUR IV ELECTRIC COOPERATIVE, INC. (CASURECO IV)
2017 Budget Utilization Report
(In Philippine Peso)
2017 ACTUAL BUDGET BALANCE
APPROVED AS OF DEC. 31 AMOUNT %
INTERNAL CASH GENERATION
1. Collection from Customers A/R
1.a. From Energy Sales 458,576,146 494,771,571 36,195,425 8
1.b. From RFSC 19,462,184 19,942,136 479,952 2
1.c. From Universal Charge/FIT-ALL 23,266,966 24,975,497 1,708,531 7
1.d. From VAT 11,904,410 13,475,228 1,570,818 13
2. Non-Operating Revenue
2.a. Reconnection & Other Fees 13,754,380 15,852,660 2,098,280 15
2.b. Collection from Non-Operating Reve 7,299,798 1,188,526 (6,111,272) (84)
3. Other Receipts 160,235 1,193,689 1,033,454 645
4. Loan from NEA/Banks/Other Fin. Institut 61,119,798 0 (61,119,798) (100)
Total 595,543,917 571,399,307 (24,144,610) (4)
CASH FOR OPERATIONS
1. Cost of Power 383,686,993 396,736,160 13,049,167 3
2. Non-Power Cost -
2.a. Salaries & Wages 35,350,082 29,213,415 6,136,667 17
2.b. SSS/Medicare/ECC/Pag-Ibig 2,529,540 2,193,457 336,083 13
2.c. Employee Benefits 8,833,165 8,064,980 768,185 9
2.d. Utilities 1,511,132 912,916 598,216 40
2.e. Office Materials & Supplies 2,950,049 2,317,048 633,001 21
2.f. Travel 2,588,018 1,138,869 1,449,149 56
2.g. Transportation 4,512,925 2,892,519 1,620,406 36
2.h. Repairs & Maintenance 3,377,110 1,121,289 2,255,821 67
2.i. Directors' Per Diems 1,638,000 1,619,010 18,990 1
2.j. Allowances/Representation 1,624,800 1,008,600 616,200 38
2.k. Outside Professional Service 14,556,774 13,531,070 1,025,704 7
2.l. Seminars/Trainings 2,192,410 485,702 1,706,708 78
2.m. Institutional Activities 1,683,700 1,122,074 561,626 33
2.n. Insurance/Registration 469,533 288,967 180,566 38
2.o. Sundries 333,000 101,041 231,959 70
Sub-Total 84,150,238 66,010,957 18,139,281 22
CASH FOR DEBT SERVICE (CURRENT & LONG-TERM)/OTHER USES
1. NEA/Bank/Other Payables 12,985,584 2,583,681 (10,401,903) (80)
2. Universal Charge/FIT-ALL 23,266,966 25,127,682 1,860,716 8
3. Refund to Customer Deposit 281,316 237,700 (43,616) (16)
4. VAT Payable 12,426,901 6,171,550 (6,255,351) (50)
5. Franchise/Business Tax Remittance 0 93,655 93,655
Sub-Total 48,960,767 34,214,268 (14,746,499) (30)
CASH FOR CAPITAL EXPENDITURES 100,180,686 10,025,007 (90,155,679) (90)
CASH FOR SINKING FUNDS 24,000,000 47,331,459 23,331,459 97
CASH AFTER SINKING FUNDS (45,434,767) 17,081,456
Add: Cash Balance, Beginning 68,131,514 67,278,894
CASH BALANCE, END 22,696,747 84,360,350
FIRST CATANDUANES ELECTRIC COOPERATIVE, INC. (FICELCO)
2017 Budget Utilization Report
(In Philippine Peso)
2017 ACTUAL BUDGET BALANCE
APPROVED AS OF DEC. 31 AMOUNT %
INTERNAL CASH GENERATION
1. Collection from Customers A/R
1.a. From Energy Sales 500,612,419 442,450,023 (58,162,396) (12)
1.b. From RFSC 18,882,389 23,286,843 4,404,454 23
1.c. From Universal Charge 16,462,528 16,304,587 (157,941) (1)
1.d. From VAT 54,240,037 45,141,159 (9,098,878) (17)
1.e. BAPA Discount (2,324,117) (2,391,691) (67,574) 3
2. Non-Operating Revenue
2.a. Reconnection & Other Fees 7,470,302 5,643,306 (1,826,996) (24)
2.b. Collection from Non-Operating Revenu 8,199,399 9,690,836 1,491,437 18
2.c. Power Purchase Discount 7,357,494 7,135,359 (222,135) (3)
3. Other Receipts 0 43,949,842 43,949,842
4. Loan from NEA/Banks/Other Fin. Instituti 9,022,269 50,705,704 41,683,435 462
5. Subsidy 0 2,012,138 2,012,138
Total 619,922,720 643,928,107 (63,417,894) (10)
CASH FOR OPERATIONS
1. Cost of Power 367,874,708 316,403,239 (51,471,469) (14)
2. Non-Power Cost -
2.a. Salaries & Wages 52,301,174 54,847,840 (2,546,666) (5)
2.b. SSS/Medicare/ECC/Pag-Ibig 6,112,354 4,064,813 2,047,541 33
2.c. Employee Benefits 26,331,867 26,331,867 (0) (0)
2.d. Utilities 2,240,844 2,268,956 (28,112) (1)
2.e. Office Materials & Supplies 2,377,750 3,467,913 (1,090,163) (46)
2.f. Travel 3,600,000 4,697,846 (1,097,846) (30)
2.g. Transportation 2,842,459 4,077,480 (1,235,021) (43)
2.h. Repairs & Maintenance 2,000,000 1,542,087 457,913 23
2.i. Directors' Per Diems 645,600 704,687 (59,087) (9)
2.j. Allowances/Representation 930,000 761,600 168,400 18
2.k. Outside Professional Service 3,543,800 6,839,416 (3,295,616) (93)
2.l. Seminars/Trainings 700,000 467,138 232,862 33
2.m. Institutional Activities 2,818,395 4,684,887 (1,866,492) (66)
2.n. Insurance/Registration 645,000 1,664,927 (1,019,927) (158)
2.o. Sundries 1,126,000 1,092,525 33,475 3
Sub-Total 108,215,243 117,513,981 (9,298,738) (9)
CASH FOR DEBT SERVICE (CURRENT & LONG-TERM)/OTHER USES
1. NEA/Bank/Other Payables 16,077,107 17,396,330 1,319,223 8
2. Refund of Customers' Deposit 3,999,399 2,406,044 (1,593,355) (40)
3. Universal Charge 16,462,528 15,774,997 (687,531) (4)
4. VAT Payable 54,240,037 34,543,023 (19,697,014) (36)
5. Real Property Tax Remittance 450,000 813,576 363,576 81
6. Business Tax Bill 750,000 4,270,548 3,520,548 469
Sub-Total 91,979,071 75,204,518 (20,295,100) (22)
CASH FOR CAPITAL EXPENDITURES 65,917,976 73,580,888 7,662,912 12
CASH FOR SINKING FUNDS 4,800,000 47,846,095 43,046,095 897
CASH AFTER SINKING FUNDS (18,864,278) 13,379,386
Add: Cash Balance, Beginning 19,519,396 32,798,984
CASH BALANCE, END 655,118 46,178,370
MASBATE ELECTRIC COOPERATIVE, INC. (MASELCO)
2017 Budget Utilization Report
(In Philippine Peso)
2017 ACTUAL BUDGET BALANCE
APPROVED AS OF DEC. 31 AMOUNT %
INTERNAL CASH GENERATION
1. Collection from Customers A/R
1.a. From Energy Sales 629,808,436 638,742,088 8,933,652 1
1.b. From RFSC 25,978,620 22,844,298 (3,134,322) (12)
1.c. From Universal Charge 27,152,964 25,359,048 (1,793,916) (7)
1.d. From VAT 62,093,686 65,728,304 3,634,617 6
2. Non-Operating Revenue
2.a. Reconnection & Other Fees 5,000,000 4,557,734 (442,266) (9)
2.b. Interest Income 200,000 96,434 (103,566) (52)
2.c. Collection from Non-Operating Reve 13,500,000 21,741,530 8,241,530 61
3. Other Receipts 7,156,200 9,882,387 2,726,187 38
4. Loan from NEA/Banks/Other Fin. Institu 60,522,979 (60,522,979) (100)
5. Subsidy/Calamity Fund 0 8,863,115 8,863,115
Total 831,412,885 797,814,938 (33,597,947) (4)
CASH FOR OPERATIONS
1. Cost of Power 496,565,663 505,417,796 8,852,133 2
2. Non-Power Cost -
2.a. Salaries & Wages 40,255,521 42,667,457 (2,411,936) (6)
2.b. SSS/Medicare/ECC/Pag-Ibig 5,201,019 5,688,506 (487,487) (9)
2.c. Employee Benefits 12,523,455 9,385,796 3,137,659 25
2.d. Utilities 1,611,740 1,688,460 (76,720) (5)
2.e. Office Materials & Supplies 2,648,682 3,851,369 (1,202,687) (45)
2.f. Travel 1,652,070 1,104,136 547,934 33
2.g. Transportation 3,348,749 3,550,979 (202,230) (6)
2.h. Repairs & Maintenance 2,640,600 3,938,071 (1,297,471) (49)
2.i. Directors' Per Diems 302,400 110,055 192,345 64
2.j. Allowances/Representation 829,200 557,862 271,338 33
2.k. Outside Professional Service 3,216,000 3,261,214 (45,214) (1)
2.l. Seminars/Trainings 2,008,250 695,027 1,313,223 65
2.m. Institutional Activities 1,975,000 1,021,795 953,205 48
2.n. Insurance/Registration 259,900 367,484 (107,584) (41)
2.o. Sundries 2,163,825 2,300,794 (136,969) (6)
Sub-Total 80,636,411 80,189,005 447,405 1
CASH FOR DEBT SERVICE (CURRENT & LONG-TERM)/OTHER USES
1. NEA/Bank/Other Payables 29,760,267 41,882,717 12,122,450 41
2. Universal Charge 27,152,964 18,561,707 (8,591,257) (32)
3. VAT Payable 80,093,686 126,343,938 46,250,251 58
4. Refund to Meter Deposit 3,617,136 1,971,568 (1,645,568) (45)
Sub-Total 140,624,054 188,759,930 48,135,877 34
CASH FOR CAPITAL EXPENDITURES 82,363,895 47,614,689 (34,749,206) (42)
CASH FOR SINKING FUNDS 32,240,916 9,395,284 (22,845,632) (71)
CASH AFTER SINKING FUNDS (1,018,053) (33,561,767)
Add: Cash Balance, Beginning 8,859,880 8,859,880
CASH BALANCE, END 7,841,827 (24,701,888)
SORSOGON I ELECTRIC COOPERATIVE, INC. (SORECO I)
2017 Budget Utilization Report
(In Philippine Peso)
2017 ACTUAL BUDGET BALANCE
APPROVED AS OF DEC. 31 AMOUNT %
INTERNAL CASH GENERATION
1. Collection from Customers A/R
1.a. From Energy Sales 451,006,037 449,720,544 (1,285,493) (0)
1.b. From RFSC 27,293,161 19,684,323 (7,608,838) (28)
1.c. From Universal Charge 22,578,649 25,268,571 2,689,922 12
1.d. From VAT 15,000,000 15,650,923 650,923 4
2. Non-Operating Revenue
2.a. Reconnection & Other Fees 20,065,887 26,734,085 6,668,198 33
2.b. Interest Income 4,000,000 329,918 (3,670,082) (92)
2.c. Collection from Non-Operating Revenue 3,194,484 1,581,587 (1,612,897) (50)
3. Other Receipts 0 1,044,463 1,044,463
4. Loan from NEA/Banks/Other Fin. Institutions174,879,630 0 (174,879,630) (100)
Total 718,017,848 540,014,414 (4,168,267) (1)
CASH FOR OPERATIONS
1. Cost of Power 324,639,216 361,027,767 36,388,551 11
2. Non-Power Cost -
2.a. Salaries & Wages 40,821,371 36,853,360 3,968,011 10
2.b. SSS/Medicare/ECC/Pag-Ibig 3,277,520 3,120,060 157,460 5
2.c. Employee Benefits 13,470,269 13,445,495 24,774 0
2.d. Utilities 1,024,825 833,176 191,649 19
2.e. Office Materials & Supplies 1,880,078 1,864,508 15,570 1
2.f. Travel 1,758,840 786,669 972,171 55
2.g. Transportation 3,660,909 3,660,557 352 0
2.h. Repairs & Maintenance 2,000,000 1,245,807 754,193 38
2.i. Directors' Per Diems 384,000 383,890 110 0
2.j. Allowances/Representation 443,400 379,410 63,990 14
2.k. Outside Professional Service 2,013,600 2,002,497 11,103 1
2.l. Seminars/Trainings 2,991,850 1,644,109 1,347,741 45
2.m. Institutional Activities 5,948,195 3,624,136 2,324,059 39
2.n. Insurance/Registration 2,183,399 1,390,643 792,756 36
2.o. Sundries 925,000 878,201 46,799 5
Sub-Total 82,783,256 72,112,518 10,670,738 13
CASH FOR DEBT SERVICE (CURRENT & LONG-TERM)/OTHER USES
1. NEA/Bank/Other Payables 107,369,407 22,749,857 (84,619,550) (79)
2. Universal Charge 22,578,649 24,725,021 2,146,372 10
3. VAT Payable 15,000,000 16,164,143 1,164,143 8
Sub-Total 144,948,056 63,639,021 (81,309,035) (56)
CASH FOR CAPITAL EXPENDITURES 157,439,906 20,331,716 (137,108,190) (87)
CASH FOR SINKING FUNDS 8,000,000 2,798,842 (5,201,158) (65)
CASH AFTER SINKING FUNDS 207,414 20,104,550
Add: Cash Balance, Beginning 8,230,727 3,881,039
CASH BALANCE, END 8,438,141 23,985,589
SORSOGON II ELECTRIC COOPERATIVE, INC. (SORECO II)
2017 Budget Utilization Report
(In Philippine Peso)
2017 ACTUAL BUDGET BALANCE
APPROVED AS OF DEC. 31 AMOUNT %
INTERNAL CASH GENERATION
1. Collection from Customers A/R
1.a. From Energy Sales 721,186,778 830,362,214 109,175,436 15
1.b. From RFSC 70,810,336 65,456,038 (5,354,298) (8)
1.c. From Universal Charge/FIT-ALL 40,799,928 54,175,744 13,375,816 33
1.d. From VAT 64,368,817 55,321,452 (9,047,365) (14)
2. Non-Operating Revenue
2.a. Reconnection & Other Fees 9,561,362 8,579,947 (981,415) (10)
2.b. Interest Income 2,207,038 1,813,793 (393,246) (18)
3. Other Receipts 31,522,750 76,845,945 45,323,195 144
4. Loan from NEA/Banks/Other Fin. Institutions 0 49,052,162 49,052,162
5. Subsidy 0 14,041,335 14,041,335
Total 940,457,009 ### 106,774,928 11
CASH FOR OPERATIONS
1. Cost of Power 547,353,888 678,626,074 131,272,186 24
2. Non-Power Cost -
2.a. Salaries & Wages 75,045,955 72,667,494 2,378,461 3
2.b. SSS/Medicare/ECC/Pag-Ibig 6,486,572 5,837,140 649,432 10
2.c. Employee Benefits 18,462,833 18,271,611 191,222 1
2.d. Utilities 3,105,869 2,937,635 168,234 5
2.e. Office Materials & Supplies 1,967,015 889,752 1,077,263 55
2.f. Travel 2,215,000 2,831,703 (616,703) (28)
2.g. Transportation 5,060,880 4,513,461 547,419 11
2.h. Repairs & Maintenance 4,389,500 4,262,113 127,387 3
2.i. Directors' Per Diems 973,000 868,042 104,958 11
2.j. Allowances/Representation 2,250,900 2,262,372 (11,472) (1)
2.k. Outside Professional Service 10,212,000 11,040,479 (828,479) (8)
2.l. Seminars/Trainings 1,441,750 1,049,767 391,983 27
2.m. Institutional Activities 5,484,520 3,058,536 2,425,984 44
2.n. Insurance/Registration 300,000 240,176 59,824 20
2.o. Sundries 2,357,500 2,520,096 (162,596) (7)
Sub-Total 139,753,294 133,250,377 6,502,917 5
CASH FOR DEBT SERVICE (CURRENT & LONG-TERM)/OTHER USES
1. NEA/Bank/Other Payables 62,638,064 69,529,886 6,891,822 11
2. Payable to Power Suppliers 1,500,000 2,258,548 758,548 51
3. Universal Charge/FIT-ALL 41,632,580 51,256,298 9,623,718 23
4. VAT Payable 65,682,467 56,395,039 (9,287,428) (14)
Sub-Total 171,453,111 179,439,771 7,986,660 5
CASH FOR CAPITAL EXPENDITURES 77,264,530 133,841,372 56,576,842 73
CASH FOR SINKING FUNDS 10,511,207 18,792,638 8,281,431 79
CASH AFTER SINKING FUNDS (5,879,021) 11,698,398
Add: Cash Balance, Beginning 8,493,475 8,493,475
CASH BALANCE, END 2,614,454 20,191,873
TICAO ISLAND ELECTRIC COOPERATIVE, INC. (TISELCO)
2017 Budget Utilization Report
(In Philippine Peso)
2017 ACTUAL BUDGET BALANCE
APPROVED AS OF DEC. 31 AMOUNT %
INTERNAL CASH GENERATION
1. Collection from Customers A/R
1.a. From Energy Sales 63,557,076 75,020,058 11,462,982 18
1.b. From RFSC 2,989,528 3,948,424 958,896 32
1.c. From Universal Charge 2,537,760 0 (2,537,760) (100)
1.d. From VAT 7,037,489 0 (7,037,489) (100)
2. Non-Operating Revenue
2.a. Reconnection & Other Fees 0 1,657,530 1,657,530
2.c. Collection from Non-Operating Revenue 0 217,686 217,686
3. Other Receipts 0 241,411 241,411
4. Loan from NEA/Banks/Other Fin. Institutions 25,557,395 0 (25,557,395) (100)
5. Subsidy 28,019,047 8,682,807 (19,336,240) (69)
Total 129,698,295 89,767,917 4,721,845 4
CASH FOR OPERATIONS
1. Cost of Power 41,189,825 53,974,714 12,784,889 31
2. Non-Power Cost -
2.a. Salaries & Wages 6,189,033 4,136,719 2,052,314 33
2.b. SSS/Medicare/ECC/Pag-Ibig 466,182 2,931,639 (2,465,457) (529)
2.c. Employee Benefits 3,072,800 3,874,106 (801,306) (26)
2.d. Utilities 196,800 244,729 (47,929) (24)
2.e. Office Materials & Supplies 415,718 498,190 (82,472) (20)
2.f. Travel 466,700 998,818 (532,118) (114)
2.g. Transportation 463,080 468,238 (5,158) (1)
2.h. Repairs & Maintenance 373,800 174,464 199,337 53
2.i. Directors' Per Diems 206,400 87,600 118,800 58
2.j. Allowances/Representation 206,400 395,026 (188,626) (91)
2.k. Outside Professional Service 854,168 890,491 (36,323) (4)
2.l. Seminars/Trainings 350,000 253,223 96,777 28
2.m. Institutional Activities 320,000 370,363 (50,363) (16)
2.n. Insurance/Registration 12,000 0 12,000 100
2.o. Sundries 305,500 2,102,020 (1,796,520) (588)
Sub-Total 13,898,581 17,425,625 (3,527,044) (25)
CASH FOR DEBT SERVICE (CURRENT & LONG-TERM)/OTHER USES
1. NEA/Bank/Other Payables 9,440,000 6,867,912 (2,572,088) (27)
2. Universal Charge 2,537,760 0 (2,537,760) (100)
3. VAT Payable 7,637,489 501,830 (7,135,659) (93)
Sub-Total 19,615,249 7,369,742 (12,245,507) (62)
CASH FOR CAPITAL EXPENDITURES 55,787,192 9,634,522 (46,152,670) (83)
CASH FOR SINKING FUNDS 778,778 263,206 (515,572) (66)
CASH AFTER SINKING FUNDS (1,571,330) 1,100,108
Add: Cash Balance, Beginning 6,960,355 1,572,911
CASH BALANCE, END 5,389,025 2,673,020
You might also like
- Profit & Loss Statement: O' Lites GymDocument8 pagesProfit & Loss Statement: O' Lites GymNoorulain Adnan100% (6)
- Finance Case StudyDocument3 pagesFinance Case StudyAsem Al Saied Suliman100% (1)
- Income Statement: Year 2023 2024 2025 2026 2027Document3 pagesIncome Statement: Year 2023 2024 2025 2026 2027Bryan Dino Lester GarnicaNo ratings yet
- Chapter 7 SolutionsDocument12 pagesChapter 7 SolutionsEdmond ZNo ratings yet
- Accounting Basic Entity Configuration Guide V10.1Document96 pagesAccounting Basic Entity Configuration Guide V10.1vijaygctNo ratings yet
- PROSIELCODocument1 pagePROSIELCOnarras11No ratings yet
- Department of Public Works and Highways Executive Summary 2022Document14 pagesDepartment of Public Works and Highways Executive Summary 2022Stacy VeuNo ratings yet
- Philippine Coast Guard Executive Summary 2021Document11 pagesPhilippine Coast Guard Executive Summary 2021Kathleen Romero BalahayNo ratings yet
- SMC DRAFT 2023 V1 Compare KrnaDocument10 pagesSMC DRAFT 2023 V1 Compare KrnaM. JunaidNo ratings yet
- Ali Asghar Report ..Document7 pagesAli Asghar Report ..Ali AzgarNo ratings yet
- Department of Public Works and Highways Executive Summary 2021Document11 pagesDepartment of Public Works and Highways Executive Summary 2021Vincent Ray LightnessNo ratings yet
- Philippine-Coast-Guard-Executive-Summary-2022Document8 pagesPhilippine-Coast-Guard-Executive-Summary-2022Micaela RafalNo ratings yet
- Project Report - BDDocument6 pagesProject Report - BDHarshit ChiraniaNo ratings yet
- Bop PDFDocument1 pageBop PDFLoknadh ReddyNo ratings yet
- Gurudeep Enterprises Proprietor: Sri. Sandip Dipak RathodDocument1 pageGurudeep Enterprises Proprietor: Sri. Sandip Dipak Rathodshivarajpraveen3No ratings yet
- Wim Plast LTD.: CelloDocument5 pagesWim Plast LTD.: CelloAbhishek RanjanNo ratings yet
- Balance Sheet of WiproDocument3 pagesBalance Sheet of WiproRinni JainNo ratings yet
- Noreco I Staffing Pattern & DSM SimulationDocument28 pagesNoreco I Staffing Pattern & DSM SimulationvisagasrbNo ratings yet
- Project Babi TantiDocument6 pagesProject Babi TantiHarshit ChiraniaNo ratings yet
- Peng Teknologi InformasiDocument6 pagesPeng Teknologi InformasiYudo RamadhanNo ratings yet
- Income StatementDocument3 pagesIncome StatementcenterwabeNo ratings yet
- L G Balakrishnan-Bros-Limited-31 12 2023-FinancialsDocument3 pagesL G Balakrishnan-Bros-Limited-31 12 2023-FinancialsGhanshyam shahiNo ratings yet
- Balance SheetDocument6 pagesBalance SheetMohammad Abid MiahNo ratings yet
- Adelphia Bankruptcy Spreadsheets XLS664-XLS-ENGDocument23 pagesAdelphia Bankruptcy Spreadsheets XLS664-XLS-ENGShubham KumarNo ratings yet
- Project Report PDFDocument13 pagesProject Report PDFMan KumaNo ratings yet
- Financial Accounting 2Document7 pagesFinancial Accounting 2yuzomnene999No ratings yet
- Activity ExcelDocument1 pageActivity ExcelJoshua GuinauliNo ratings yet
- Cardiac Accounts (07.10.2024)Document16 pagesCardiac Accounts (07.10.2024)MD RIZWANNo ratings yet
- Q3 2020 21 Financial Results GRSEDocument6 pagesQ3 2020 21 Financial Results GRSEMamma MiaNo ratings yet
- May 2018Document2 pagesMay 2018the kingfishNo ratings yet
- ProjectDocument6 pagesProjectHarshit ChiraniaNo ratings yet
- Expenditure Program, by Object, Fy 2019 (In Thousand Pesos) Table B.1Document6 pagesExpenditure Program, by Object, Fy 2019 (In Thousand Pesos) Table B.1Sean BuencaminoNo ratings yet
- Takaful Companies - Overall: ItemsDocument6 pagesTakaful Companies - Overall: ItemsZubair ArshadNo ratings yet
- CFI-Economic Value AddedDocument5 pagesCFI-Economic Value Addedyemolal278No ratings yet
- Spinning Project FeasibilityDocument19 pagesSpinning Project FeasibilityMaira ShahidNo ratings yet
- Anavar AprilDocument3 pagesAnavar AprilIsna IslamuddinNo ratings yet
- Valenzuela AOP 2022 Enhanced Form 1Document6 pagesValenzuela AOP 2022 Enhanced Form 1John Philip TiongcoNo ratings yet
- Project Report Ca SignDocument9 pagesProject Report Ca SignRavindra JondhaleNo ratings yet
- Budget 2022-2024Document30 pagesBudget 2022-2024Khaled ShangabNo ratings yet
- Chapter 5Document20 pagesChapter 5tyronkim.serominesNo ratings yet
- Standalone Financial Results For The Quarter / Year Ended On 31st March 2012Document9 pagesStandalone Financial Results For The Quarter / Year Ended On 31st March 2012smartashok88No ratings yet
- Company Financial StatementsDocument3 pagesCompany Financial StatementsNarasimha Jammigumpula0% (1)
- 3 Statement Financial Analysis TemplateDocument14 pages3 Statement Financial Analysis TemplateCười Vê LờNo ratings yet
- Suven Life Sciences Limited: I I I I I I IDocument7 pagesSuven Life Sciences Limited: I I I I I I IVipul shahNo ratings yet
- Black Hole Futsal & Café: Schedule 1-11 Referred To Above Form An Integral Part of The Financial StatementDocument9 pagesBlack Hole Futsal & Café: Schedule 1-11 Referred To Above Form An Integral Part of The Financial Statementkalpana BaralNo ratings yet
- Standalone Financial Results, Limited Review Report For December 31, 2016 (Result)Document3 pagesStandalone Financial Results, Limited Review Report For December 31, 2016 (Result)Shyam SunderNo ratings yet
- Rakibul IslamRahat , (ID-20241020) ,Financial Statment of Mutual Trust Bank Plc.Document6 pagesRakibul IslamRahat , (ID-20241020) ,Financial Statment of Mutual Trust Bank Plc.Rakibul Islam RahatNo ratings yet
- Axis Bank - Consolidated Profit & Loss Account Banks - Private Sector Consolidated Profit & Loss Account of Axis Bank - BSE: 532215, NSE: AXISBANKDocument2 pagesAxis Bank - Consolidated Profit & Loss Account Banks - Private Sector Consolidated Profit & Loss Account of Axis Bank - BSE: 532215, NSE: AXISBANKr79qwkxcfjNo ratings yet
- Unitech Limited: CIN: L74899DL1971PLC009720 Statement of Consolidated Results For The Quarter & Year Ended March 31, 2014Document4 pagesUnitech Limited: CIN: L74899DL1971PLC009720 Statement of Consolidated Results For The Quarter & Year Ended March 31, 2014Bhuvan MalikNo ratings yet
- Fin455 Square Pharma Relative ValuationDocument59 pagesFin455 Square Pharma Relative ValuationTanvir Mahmud 2121587630No ratings yet
- FS SNS Q2 2023 (Inhouse) Hasan Queries AspireDocument64 pagesFS SNS Q2 2023 (Inhouse) Hasan Queries AspireHasan Akmal AlatasNo ratings yet
- Devolution FileDocument3 pagesDevolution FileSaveri SargamNo ratings yet
- Invoice-27 MOA-4 Rekap PDFDocument1 pageInvoice-27 MOA-4 Rekap PDFdeeb1987No ratings yet
- Cma Ms K.K. EngineeringDocument10 pagesCma Ms K.K. EngineeringamanhyficNo ratings yet
- 63 Moon Q3 ResultsDocument16 pages63 Moon Q3 Resultsdownloads.xaNo ratings yet
- Group 68 FinanceDocument14 pagesGroup 68 FinanceAbdurehman Ullah khanNo ratings yet
- Budgets 2008-2010Document2 pagesBudgets 2008-2010itsmeboenvelNo ratings yet
- HDFC Bank - Standalone Profit & Loss Account Banks - Private Sector Standalone Profit & Loss Account of HDFC Bank - BSE: 500180, NSE: HDFCBANKDocument2 pagesHDFC Bank - Standalone Profit & Loss Account Banks - Private Sector Standalone Profit & Loss Account of HDFC Bank - BSE: 500180, NSE: HDFCBANKAnanya SinghNo ratings yet
- Cash Flow Statement Peer CompanyDocument4 pagesCash Flow Statement Peer Companyrahatiu93No ratings yet
- Revenue Report Aug24Document3 pagesRevenue Report Aug24Saahir PatelNo ratings yet
- ExhibitDocument17 pagesExhibithemaloungani7No ratings yet
- 2022 23 Broome Annual BudgetDocument40 pages2022 23 Broome Annual BudgetmanishswagNo ratings yet
- The Increasing Importance of Migrant Remittances from the Russian Federation to Central AsiaFrom EverandThe Increasing Importance of Migrant Remittances from the Russian Federation to Central AsiaNo ratings yet
- List of Academic Fields - WikipediaDocument1 pageList of Academic Fields - WikipediaEdsel Alfred OtaoNo ratings yet
- Understanding Bandwidth ConceptsDocument1 pageUnderstanding Bandwidth ConceptsEdsel Alfred OtaoNo ratings yet
- MaximaDocument1,236 pagesMaximaEdsel Alfred OtaoNo ratings yet
- The Ultimate Car Maintenance ChecklistDocument1 pageThe Ultimate Car Maintenance ChecklistEdsel Alfred OtaoNo ratings yet
- Projects - PresconDocument1 pageProjects - PresconEdsel Alfred OtaoNo ratings yet
- Semi-Annual Report 1st Semester 2018Document58 pagesSemi-Annual Report 1st Semester 2018Edsel Alfred OtaoNo ratings yet
- Richard H. Rand Dept. of Theoretical and Applied Mechanics, Cornell UniversityDocument1 pageRichard H. Rand Dept. of Theoretical and Applied Mechanics, Cornell UniversityEdsel Alfred OtaoNo ratings yet
- Fpregion 5Document2 pagesFpregion 5Edsel Alfred OtaoNo ratings yet
- Elevation 1Document1 pageElevation 1Edsel Alfred OtaoNo ratings yet
- 2019 Second Semester Semi-Annual ReportDocument48 pages2019 Second Semester Semi-Annual ReportEdsel Alfred OtaoNo ratings yet
- Elevation 2Document1 pageElevation 2Edsel Alfred OtaoNo ratings yet
- Final Action Plan + Investment Reports: Technical Committee MeetingDocument48 pagesFinal Action Plan + Investment Reports: Technical Committee MeetingEdsel Alfred OtaoNo ratings yet
- L ('T L R RT / T' N/' (:ri'1 / TL:' (' : ('F:/'RR ( (. L/D /-F'H./ Es Ltt:. (R, T'L (Ortr OnDocument1 pageL ('T L R RT / T' N/' (:ri'1 / TL:' (' : ('F:/'RR ( (. L/D /-F'H./ Es Ltt:. (R, T'L (Ortr OnEdsel Alfred OtaoNo ratings yet
- Net-Zero Challenge: The Supply Chain Opportunity: Insight Report January 2021Document46 pagesNet-Zero Challenge: The Supply Chain Opportunity: Insight Report January 2021Edsel Alfred Otao100% (1)
- Heating Load Analysis Project SampleDocument2 pagesHeating Load Analysis Project SampleEdsel Alfred OtaoNo ratings yet
- Lacson Senate Bill Amending CE Law 544Document17 pagesLacson Senate Bill Amending CE Law 544Edsel Alfred OtaoNo ratings yet
- Cooling Load Analysis Project SampleDocument1 pageCooling Load Analysis Project SampleEdsel Alfred OtaoNo ratings yet
- Republic The Philippines: Visays Dilirnan, C TyDocument3 pagesRepublic The Philippines: Visays Dilirnan, C TyEdsel Alfred OtaoNo ratings yet
- Other Long Term InvestmentsDocument1 pageOther Long Term InvestmentsShaira MaguddayaoNo ratings yet
- Chapter 12 - Other Long-Term InvestmentsDocument3 pagesChapter 12 - Other Long-Term InvestmentsJEFFERSON CUTENo ratings yet
- Ad Valorem Taxes: Notie LansfordDocument8 pagesAd Valorem Taxes: Notie Lansfordwinblacklist1507No ratings yet
- Other Long-Term Investments: Sinking Fund Requirements Maturitie SDocument3 pagesOther Long-Term Investments: Sinking Fund Requirements Maturitie SXiena0% (1)
- ALL JOURNAL ENTRIES - CMA-Executive-RevisionDocument13 pagesALL JOURNAL ENTRIES - CMA-Executive-RevisionRevanthi DNo ratings yet
- H-1809 The Nagpur Improvement Trust Act, 1936Document68 pagesH-1809 The Nagpur Improvement Trust Act, 1936Abhishek VermaNo ratings yet
- Capital FinancingDocument9 pagesCapital FinancingFrances Louise LariosaNo ratings yet
- Working Papers in InvestmentsDocument41 pagesWorking Papers in InvestmentsTrisha VillegasNo ratings yet
- Sinking Fund MethodDocument3 pagesSinking Fund MethodJoanna DuqueNo ratings yet
- Sinking Fund A.K.A. Kuot-Kuot Ni Romie v2.0Document4 pagesSinking Fund A.K.A. Kuot-Kuot Ni Romie v2.0Jovel ContratistaNo ratings yet
- How School Funding WorksDocument20 pagesHow School Funding WorksCarolyn UptonNo ratings yet
- Corporate Accounting Chapter - 8 - Redemption of Debentures: (Notes Compiled by Dr. RUCHIKA KAURA)Document6 pagesCorporate Accounting Chapter - 8 - Redemption of Debentures: (Notes Compiled by Dr. RUCHIKA KAURA)RioNo ratings yet
- Albay Electric Cooperative, Inc. (Aleco) : 2017 Budget Utilization ReportDocument12 pagesAlbay Electric Cooperative, Inc. (Aleco) : 2017 Budget Utilization ReportEdsel Alfred OtaoNo ratings yet
- This Study Resource Was: Other Long-Term InvestmentsDocument3 pagesThis Study Resource Was: Other Long-Term InvestmentsMs VampireNo ratings yet
- Long-Term Debt, Preferred Stock, and Common Stock Long-Term Debt, Preferred Stock, and Common StockDocument44 pagesLong-Term Debt, Preferred Stock, and Common Stock Long-Term Debt, Preferred Stock, and Common StockDiva PutriNo ratings yet
- Other Long-Term Investments: NAME: Piolo Encela Date: 5-11-2020 Professor: Dr. Valcorza Section: BSA 1B ScoreDocument2 pagesOther Long-Term Investments: NAME: Piolo Encela Date: 5-11-2020 Professor: Dr. Valcorza Section: BSA 1B ScoreKrissa Mae LongosNo ratings yet
- Math 108 Chapter 4 Amortization and Sinking FundDocument6 pagesMath 108 Chapter 4 Amortization and Sinking FundMary Jane Aguinaldo100% (2)
- Case 2 Environgard CorporationDocument5 pagesCase 2 Environgard CorporationutsavNo ratings yet
- Working CapitalDocument49 pagesWorking CapitalRicha SharmaNo ratings yet
- How Much Was Pitt Responsible For The National Revival ZZDocument3 pagesHow Much Was Pitt Responsible For The National Revival ZZMarco Pastor MayoNo ratings yet
- 13 05 CHDocument8 pages13 05 CHCirilo Gazzingan IIINo ratings yet
- Sinking Fund and AmortizationDocument8 pagesSinking Fund and AmortizationMay Jovi JalaNo ratings yet
- RA 4850 Laguna Lake Development AuthorityDocument10 pagesRA 4850 Laguna Lake Development AuthorityErrol Nikko BuquingNo ratings yet
- Corporate Finance Cha 15Document25 pagesCorporate Finance Cha 15ROMELIE CHELSEA ESCOBIANo ratings yet
- 01 Investment Property and Funds and Other InvestmentDocument15 pages01 Investment Property and Funds and Other InvestmentJerone ManlapazNo ratings yet
- CF Assignment - 2Document2 pagesCF Assignment - 2vishnu607No ratings yet
- Long-Term Debt, Preferred Stock, and Common StockDocument40 pagesLong-Term Debt, Preferred Stock, and Common Stockirshan amirNo ratings yet


