International Journal of Medical Research
&
Health Sciences
www.ijmrhs.com
Volume 2 Issue 1 Jan-Mar 2013
Coden: IJMRHS Copyright @2013 ISSN: 2319-5886
th
Received: 26 Oct 2012
Revised: 19th Nov 2012
Accepted: 23rd Nov 2012
Original research article
A QUESTIONNAIRE BASED EVALUATION OF TEACHING METHODS AMONGST MBBS
STUDENTS
Muneshwar JN1, *Mirza Shiraz Baig2, Zingade US3, Khan ST4
1
Associate Professor, 2Assistant Professor, 4Professor & Head, Department of Physiology, GMC,
Aurangabad, Maharashtra.
3
Professor & Head, Department of Physiology, BJMC, Pune, Maharashtra.
*Corresponding author e mail: shirazdoctor@yahoo.com
ABSTRACT
Background: The medical education and health care in India are facing serious challenges in content and
competencies. Heightened focus on the quality of teaching in medical college has led to increased use of
student surveys as a means of evaluating teaching. Objectives: A questionnaire based evaluation of 200
students (I MBBS & II MBBS) about teaching methods was conducted at a Govt Medical College &
Hospital, Aurangabad (MS) with intake capacity of 150 students &established since 50 last years. Methods:
200 medical students of I MBBS & II MBBS voluntarily participated in the study. Based on teaching
methods, an objective questionnaire paper was given to the participants to be solved in 1 hour. Results: As a
teaching mode 59% of the students favored group discussion versus didactic lectures (14%). Almost 48%
felt that those didactic lectures fail to create interest & motivation. Around 66% were aware of learning
objectives. Conclusion: Strategies and futuristic plans need to be implemented so that medical education in
India is innovative & creates motivation.
Keywords: Teaching methods, Undergraduate students, Medical education
INTRODUCTION
The Government of India recognizes Health for all
as a national goal and expects medical training to
produce competent “Physicians of First Contact”
towards meeting this goal. However, the medical
education and health care in India are facing
serious challenges in content and competencies1
With the growing awareness of the importance of
teaching and learning in medical education and the
need to move towards evidence-based teaching, it
is important to re-examine the educational teaching
methodology2.
To take care of the huge Indian population India
needs quality doctors and not just quantity.
Heightened focus on the quality of teaching in
medical college has led to increased use of student
surveys as a means of evaluating teaching3.
Good evaluation practices in medical training, at
all levels, enhance both quality and accountability
19
Muneshwar J N et al.,
Int J Med Res Health Sci.2013;2(1):19-22
of medical education4.In recent a time there is a
growing apathy of students towards attending
lectures and clinics in medical colleges. Present
study tried to evaluate the teaching methods &
changing trends amongst first year and second year
MBBS Students at Govt. Medical College,
Aurangabad (MS).
Aims and objective
Primary To evaluate the teaching methods
practiced in medical education in Ist MBBS & II nd
MBBS medical students
Secondary The strengths and shortcomings in
teaching methods, areas of improvement in
medical teaching: student’s scenario
Study Design: A prospective observational study
MATERIAL AND METHODS
The study was approved by the Institutional
Ethical Committee of Govt. Medical College,
Aurangabad.
Enrolled students were explained all the details of
the study and objectives. The identity of the
students was not allowed. 200 medical students of
I MBBS & II MBBS voluntarily participated in the
study. Based on teaching methods, an objective
questionnaire paper was given to the participants to
be answered in 1 hour.
The questionnaire consisted of MCQs regarding:
1)
Teaching methods
2)
The audiovisual aids used in teaching.
3)
4)
Evaluation Methods
The environment related to studying
RESULTS
A) Teaching Methods: 66% were aware of the
learning objectives, which is a welcome sign. 48%
felt that didactic lectures fail to create interest &
motivation in the subject. 59% of the students
favored group discussion as a teaching mode over
didactic lectures (14%). 87% pointed out that at the
end of the lecture, the student becomes storehouse
of book facts rather than being oriented. 83% were
of the opinion that the current duration of the
MBBS curriculum versus vast syllabus is a major
hurdle in learning process.
B) Audio Visual Aids: 90%Participants were in
favor of using Audio visual aids for
demonstrations with complimentary use of
traditional chalk and blackboard methods.
C) Evaluation Methods: 53%of the students feel
that the current evaluation standards are not
satisfactory
considering
the
competitive
examinations for future. They prefer introduction
of more MCQs.
D) Environment related to studies: 90%Students
complained of average sound system quality in
lecture halls, overcrowding in the demonstration
sessions.
90%
80%
Observat ion %
70%
60%
50%
40%
30%
20%
10%
0%
Learning Object ives
achieved
Didat ic Lect ures
acceptance
Group Discussions
required
Change in Durat ion of
M BBS Curriculum Required
Teaching M ethods
Fig: 1 Teaching Methods
20
Muneshwar J N et al.,
Int J Med Res Health Sci.2013;2(1):19-22
100%
90%
Observat ion %
80%
70%
60%
50%
40%
30%
20%
10%
0%
Audiovisual Aids Acceptance
Evaluat ion M ethods Satisfact ory
Teaching Environment change
required
Parameters
Fig. 2: Other Parameters Studied
DISCUSSION AND CONCLUSION
The study is not judgemental. We are just trying to
put forth the facts In front. It is not a complete
picture. The information gained from evaluation
can lead to changes in any aspect of teaching and
evaluation methods. Curricular reforms to
systematically address these issues and develop
strategies to strengthen the medical education and
health care system are needed at an institutional
level & to be implemented at health universities
who are involved in the curricular programmes.
This will definitely help the Indian Medical
Graduates match or better the international
standards.4-6
Amongst the important suggestions received from
the medical students were to decrease the
generation gap between the student and the
teachers by imparting Group activities in the form
of seminars and symposiums. The teaching
standard should be of competitive entrance
examination level right from the basic sciences
itself.
A comprehensive initiative for complete
assessment of teaching methods is urgently
required at a state level involving Medical
education technology units of all concerned
universities for medical education. This will enable
strategies and futuristic plans for proper and
uniform implementations so that medical education
Muneshwar J N et al.,
in India becomes innovative, competitive and is
able to prepare undergraduates to perform in the
changing scenario of medical science.
REFERENCES
1. Vision2015-Medical
council
of
India.
Available
at
www.mciindia.org/tools/
announcement/MCI_booklet.pdf. Accessed on
14 Dec 2011.
2. Sybille K L. Evaluation of Teaching and
Learning Strategies. Med Educ Online [serial
online] 2001;6:4.
3. Harden R. AMEE Guide 21: curriculum
mapping: a tool for transparent and authentic
teaching and learning. Evaluating the outcomes
of undergraduate medical education. Medical
Education. 2003; 37: 580 – 81
4. Marton F, Saljo R. Qualitative differences in
learning I-outcome and process. Brit J of Educ
Psych. 1996;46:4-11
5. Second year student’s feedback on teaching
methodologyy and evaluation methods in
pharmacology. Nilesh Chavda, preeti yadav,
mayor Chaudhari, kantharia. National Jour nal
of Physiology, Phar macy and Phar macology
2011;1:23-31.
21
Int J Med Res Health Sci.2013;2(1):19-22
6. Learning Habits Evaluation of First M.B.B.S
Students of Bhavnagar Medical College.
Chinmay Shah, Shailesh Patel, Jasmin Diwan,
Hemant Mehta. International Journal of
Medical Science and Public Health. 201;’
1(2):81-86
22
Muneshwar J N et al.,
Int J Med Res Health Sci.2013;2(1):19-22
International Journal of Medical Research
&
Health Sciences
www.ijmrhs.com
Volume 2 Issue 1 Jan-Mar 2013 Coden: IJMRHS Copyright @2013 ISSN:2319-5886
Received: 4thNov 2012
Revised: 3 rd Dec 2012
Accepted: 7 th Dec 2012
Original research article
EVALUATION OF EFFICACY AND TOLERABILITY OF ACETAMINOPHEN (PARACETAMOL) AND
MEFENAMIC ACID AS ANTIPYRETIC IN PEDIATRIC PATIENTS WITH FEBRILE ILLNESS: A
COMPARATIVE STUDY.
*Kunkulol Rahul R1, Sonawane Aishwarya2, Ashok Kumar Chavva3
1
Associate Professor, Department of Pharmacology, Secretary, Research Cell, PIMS-DU, Loni.
UG, Rural Medical College, Loni.3Professor, Department of Pediatrics, Rural Medical College, Loni
2
*Corresponding author e mail: rahul4420@yahoo.com
ABSTRACT
Objectives: With the increase in reports of the failure of Paracetamol as antipyretic in pediatric patients and
the increase in the use of Mefenamic acid, the study was undertaken to recommend best among the both
antipyretics by comparing the efficacy and tolerability of both these drugs.
Methods-It was a prospective, active treatment controlled study with follow up to 72 hours done over a
period of 2 months after the Institutional Ethical committee approval. Total 124 pediatric patients with fever
admitted to Pravara Rural Hospital, Loni having a body temperature >38.5 and fulfilling the inclusion and
exclusion criteria were included. Patients included were categorized into two groups –group A and group B
and administered Paracetamol and Mefenamic acid in the doses 15 mg/kg and 4 mg/kg body weight
respectively. The parameters essential for comparing the efficacy and tolerability were observed and
recorded. The collected data were subjected to ‘paired t test’ of significance and was analyzed statistically.
Results-Both drugs significantly decreased body temperature in pediatric patients with fever. The
antipyretic efficacy of Mefenamic acid was highly significant than Paracetamol (<0.05). No significant
differences in adverse effects were noted in both the groups. Conclusion-Mefenamic acid was found to be
more effective and equally tolerable than paracetamol as an antipyretic in pediatric patients with febrile
illness and can be the best alternative to paracetamol.
Keywords: Acetaminophen, Mefenamic acid, MTTES.
INTRODUCTION
Fever is one of the most important and common
presenting symptom in pediatric clinics, outpatient
departments and emergency. 1 Fever may be
defined as a complex physiologic response to a
disease, mediated by pyrogenic cytokines and
Kunkulol Rahul et al.,
characterized by a rise in core temperature,
generation of acute phase reactants and activation
of immune systems2. Regulation of body
temperature requires a delicate balance between
production and loss of heat, the hypothalamus
Int J M ed Res Healt h Sci.2013;2(1):23-29
23
regulates the set-point at which the body
temperature is maintained. In fever this
hypothalamus thermostat set point is elevated and
body temperature increases over normal values.
The normal range of body temperature is 36.5 º 37.5 º C.3
In most clinical situations, fever results from the
presence of the substances called pyrogens.
Various infections, toxins and other mediators
induce production of pyrogens by host
inflammatory cells such as macrophages,
endothelial cells and lymphocytes. Best pyrogens
are endotoxins (Lipopolysaccharides, LPS)
produced by gram negative bacilli. Gram positive
bacteria also produce pyrogens as their cell wall
has peptidoglycan and Lipoteichoic acid. The
endogenous pyrogens produced locally or
systemically gain entrance in the circulation and
produce fever.1,4. The major fever causing
cytokines are various Interleukins (IL) IL-Iβ, IL-lα,
1L-6, TNF-α (Tumor necrosis factor) and INF-α
(interferon). These pyrogenic cytokines directly
stimulate the hypothalamus to produce PGE2
(prostaglandin I2) which then resets the
temperature regulatory set point. IL-1 is an
important pyrogen that on reaching the
hypothalamus induces fever in 8-10 minutes
time1.When the pyrogenic cytokines disappear
from
the
circulation
or
inhibition
of
cyclooxygenase by the
metabolites, the
hypothalamus is again reset downward so now the
heat dissipation mechanisms come into play
causing vasodilation and sweating.
It has been shown beyond doubt that increase in
the temperature of the body puts the child under
threat of convulsions, dehydration, metabolic
acidosis and fever induced stroke. So Antipyresis
is one of the most usual therapeutic interventions
undertaken. 1
The most commonly used antipyretics are
Nonsteroidal Anti Inflammatory Drugs (NSAIDS),
which also have a considerable analgesic effect
which promotes a general feeling of well-being.
Antipyretic treatment is now routinely prescribed
to febrile children, though variedly by most
pediatricians.
Antipyresis occurs with different classes of
substance including Acetyl Salicylic Acid (ASA),
Acetaminophen and the other nonsteroidal antiinflammatory agents represented by Indomethacin,
Mefenamic acid, Ibuprofen and the latest
Nimesulide. Some antipyretics are antiinflammatory. NSAIDs inhibit cyclooxygenase
(COX) which catalyzes the conversion of
arachidonic acid to prostaglandin E2. This
reduction of prostaglandin E2 in the brain is
believed to lower the hypothalamic set point.1, 4
Aspirin, once a preferred drug is no longer used in
reducing fever as it has potential to cause Reye's
syndrome. Acetaminophen, Mefenamic acid and
Nimesulide are currently three preferred drugs for
treating fevers in children.
Acetaminophen (paracetamol) antipyretic is in use
for a considerable time. As with ASA, the
antipyretic effect of Paracetamol is believed to be
caused by its ability to decrease prostaglandin
synthesis in the brain. Since Paracetamol does not
inhibit the synthesis of prostaglandins in the
periphery, it does not possess any antiinflammatory action. Besides its beneficial effects
PCM also has potential side effects and may cause
severe hypersensitivity reactions1,4. Nimesulide is a
non-steroidal anti-inflammatory drug with
analgesic and antipyretic properties. Its efficacy
has been compared with naproxen, ASA,
paracetamol and Mefenamic acid but it is banned
due to fulminant hepatitis. Mefenamic acid is a
potent inhibitor of cyclooxygenase. It has a central
as well as peripheral analgesic action. The drug is
commonly used in patients with injuries,
osteoarthritis,
rheumatoid
arthritis
and
dysmenorrhea. The pediatric suspension of
Mefenamic acid is recommended 50mg/5ml or
25mg/kg body weight in divided doses.3-6
It is essential to establish a cause for a fever and
then provide effective modern treatment. Judicious
use of the antipyretics needs to be considered
giving due respect to the body's response to the
24
Kunkulol Rahul et al.,
Int J M ed Res Healt h Sci.2013;2(1):23-29
infection in the form of fever. The decision to
choose an antipyretic should be dictated by
efficacy, safety, duration of action, effectiveness
and cost. 1 PCM has always been a dependable
antipyretic and has an additional advantage of
being a cheaper drug and relatively safer
antipyretic. There have been reports of failure of
antipyretic drugs including paracetamol in
controlling fever and trends of increase use of
Mefenamic acid as antipyretic. Moreover there are
no studies comparing efficacy and tolerability of
Acetaminophen and Mefenamic acid. Hence it
was thought prudent to evaluate both these drugs
for better antipyretic efficacy in pediatric patients
with febrile illness.
Aims and objectives
1. To compare the efficacy of Acetaminophen
(Paracetamol) And Mefenamic Acid in
pediatric patients with fever.
2. To compare the tolerability and adverse effect
of
Acetaminophen
(Paracetamol)
And
Mefenamic Acid in pediatric patients with
fever
3. To recommend best antipyretic in pediatric
patients.
MATERIALS AND METHODS
This was a prospective observational clinical study
done in collaboration with the Department of
Pediatrics, Pravara Rural Hospital, Loni. The
Institutional ethical committee approval was
obtained before the initiation of the study.
Patients diagnosed by Department of Pediatrics
with febrile illness were enrolled in the study
according to the following inclusion and exclusion
criteria. Written informed consent was taken from
each patient.
Inclusion criteria
1. Patients ready to give informed consent.
2. Hospitalized children having temperature >
99.6 º F
3. Patients 1-12 years.
4. Patients of either sex.
5. Patients of all types of febrile illness.
Kunkulol Rahul et al.,
Exclusion criteria
1. Uncooperative patients.
2. Patients not following the protocol.
3. Patients above the age of 12 years.
4. Patients who were hypersensitive to drugs.
5. Patients having any inflammatory illness
6. Severely ill patients suffering from circulatory
collapse, blood dyscrasias, cardiac or hepatic
disease, G-6-PD deficiency or meningitis.
7. Children having collagen vascular diseases or
malignancy as a primary or the underlying cause
of fever and those receiving antimicrobials
and/or corticosteroids within 24 hours preceding
the study.
Study conduct
This was a prospective, observational, comparative
study with follow- up till 72 hours. A total of 124
children having temperature > 99.6 º F admitted to
the Pediatrics ward, Pravara Rural Hospital, Loni
were included in the study.
Enrolled patients were categorized into 2 groups
depending on antipyretic treatment given by the
pediatricians:
Group A: Paracetamol treated at a dose of 15
mg/kg given as suspension 1, 10
Group B: Mefenamic acid 4 mg/kg given as a
suspension. 8
Following parameters were recorded in each group
for:
1. Efficacy evaluation7
Axillary temperature (measured with a mercury
thermometer)
Before drug administration
Every 1 (H1), 4 (H4) and 6 (H6) h after the
first dose.
Maximum temperature
Withdrawal of the patient from the study
Body temperature increases above 104°F or
decreased below 96.5 °C
Occurrence any severe physical event
Withdrawal of the consent of the
parents/guardians.
2. Tolerability evaluation
25
Int J M ed Res Healt h Sci.2013;2(1):23-29
Modified Treatment Tolerability Evaluation Score
(MTTES) 7,11:
Vomiting, dislikeness for meals, daytime sleep and
additional medication were assessed and scores
were recorded from 0-3 (absent –severe):
Score 0: Absent - Symptom is not present
Score1: Mild - Symptom is present but is not
annoying or troublesome
Score 2: Moderate - Symptom is frequently
troublesome but would not interfere with normal
daily activity or sleep
Score 3: Severe - Symptom is sufficiently
troublesome to interfere with normal daily activity
or sleep
Symptoms for MTTES: Vomiting, Dislikeness
for meals, Daytime sleeping, Additional
medication
The primary efficacy and tolerability end points
were recorded as changes from the baseline values:
Sample size: 62 patients were included in each
group according to inclusion and exclusion criteria.
(Total sample size: 124 pediatric patients with
fever)
Study period: 2 months starting from the date of
approval of the study by the Institutional Ethical
Committee
Statistical analysis: The data will be collected,
pooled, subjected to appropriate statistical analysis
and conclusions were drawn
RESULTS AND OBSERVATIONS
Fig:1. The change in mean values of all parameters from baseline to 6 hours during treatment of patients
included in group A (Paracetamol)
By applying Student’s Paired ‘t’ test there is a
1 hour, 4 hours and 6 hours, 1 hour to 4 hours and
highly significant decrease of body temperature in
6 hours, (i.e. p<0.01) and rest all other parameters
treatment group A (Paracetamol) from baseline to
remained constant at 4 and 6 hours
Fig:2. Change in mean values of all parameters from baseline to 6 hours during treatment of group B
(Mefenamic acid)
Kunkulol Rahul et al.,
Int J M ed Res Healt h Sci.2013;2(1):23-29
26
By applying Student’s Paired ‘t’ test there is a
highly significant decrease of body temperature in
treatment group B (Mefenamic acid) from baseline
to 1 hour, 4 hours and 6 hours, 1 hour to 4 hours
and 6 hours, (i.e. p<0.01) and rest all other
parameters remained constant at 4 and 6 hours
Fig: 3. Comparison of average body temperature in group A and group B
On comparison of average fall in
body
temperature in group A and group B after applying
“Z” test of significance there was a highly
significant difference in fall in temperature in
Group B from baseline to 1 hour than Group A.
Both the groups showed a highly significant fall in
temperature from baseline to 6 hours.
Table:1. Distribution of average percentage fall (decrease) from baseline to 6 hours for all parameters in
Group A (Paracetamol) and Group B (Mefenamic acid) (n=62)
Parameters
Percentage (%) of fall (decrease) from baseline to 6 hours
Body temperature (ºC)
Pulse rate(per min)
Systolic Blood Pressure (mm of Hg)
Diastolic Blood Pressure (mm of
Hg)
Respiratory rate (per min)
Group A (Paracetamol)
2.47%
13.48%
3.74%
1.32%
Group B (Mefenamic acid)
3.23%
15.11%
3.94%
3.86%
15.17%
16.94%
It is seen from the above table that the average fall
efficient / consistent than drug paracetamol in
(decrease) all parameters are significantly more in
pediatric patients with fever. That is Mefenamic
group B as compared to group A, thus it is
acid shows better and faster recovery of fever in
concluded that drug Mefenamic acid is more
pediatric patients as compared to Paracetamol.
Table:2. Total number of patients suffered with following adverse effect
Group
Vomiting
Dislikeness meal
Daytime sleeping Additional medication
Paracetamol(n=50)
3
5
5
2
Mefenamic acid(n=50)
2
7
4
2
Significance
P>0.05*
P>0.05*
P>0.05*
P>0.05*
* No significant difference between mean values of MTTES scores between Paracetamol and Mefenamic acid group.
Kunkulol Rahul et al.,
Int J M ed Res Healt h Sci.2013;2(1):23-29
27
DISCUSSION
The management of children with fever is based
primarily on the elucidation and treatment of the
underlying cause. The role of antipyretic therapy in
such children is aimed at reducing the ever present
risk of a febrile convulsion. A variety of
pharmacological agents are available for
Antipyresis. The so called superiority of one drug
over the other is marginal and has no therapeutic
significance.3, 12In our study both Paracetamol and
Mefenamic acid proved to be effective antipyretic
drugs. Antipyresis was achieved within 6 hours of
administration of the dose. In Paracetamol group
the baseline body temperature decreased since
101.81 º to 99.29 ºFat 6hours while in Mefenamic
acid group from 102.12 º to 98.82 ºFat 6hours. Both
the drugs are NSAIDs and act by inhibiting COX
enzyme responsible for generating Prostaglandins
(PGE2). Paracetamol has only central action with
weak anti-inflammatory effect and so has been
reported to be the best antipyretic drug. Mefenamic
acid has central and peripheral action with antiinflammatory effect. The fall in temperature at 1 hr
was more in Mefenamic acid group (102.12 oF
to99.5 oF)compared with paracetamol group
(101.81oF to 100.32oF).These results show that
Mefenamic acid has better antipyresis at 1 hour
than Mefenamic acid. A rough correlation has been
established between the anti synthetase activities of
many nonsteroidal anti-inflammatory drugs13
including Mefenamic acid in central nervous
system. Our results are in accord with S. Keininen
etal which also states Mefenamic acid to be more
potent and powerful antipyretic drug.8. The
children showed no adverse symptoms or signs in
connection with the antipyretic therapy. There was
no significant difference on Heart rate, BP and
respiratory rate despite a slight fall in all above
was noted.
Mefenamic Acid shows highly significant
decreases in the body temperature baseline to 6th
hour as compared to Paracetamol in paediatric
patients with fever (i.e. P<0.01.) This may be due
to decline in the efficacy of Paracetamol which has
been described as the best antipyretic. It is
essential to establish a cause for a fever and then
provide effective modern treatment.
A persistent fever is a stimulus to both doctor and
parents to maintain their vigilance. The use of the
drugs should not become the refuge of the
diagnostically destitute. Judicious use of the
antipyretics needs to be considered giving due
respect to the body's response to the infection in
the form of fever9. PCM has always been a
dependable antipyretic and has an additional
advantage of being a cheaper medicine and
relatively safer antipyretic. Other drugs like
Mefenamic acid have marginally better antipyresis.
1
Study demands more detailed evaluation of the
decline in paracetamol efficacy.
CONCLUSION
It is clear from this study that Mefenamic Acid is
the best antipyretic as in-terms of their efficacy and
tolerability in pediatric patients with fever and can
be very helpful in treating febrile illness in
pediatric age group more effectively. Mefenamic
acid could be a suitable alternative as a "secondline" antipyretic agent, even in selected children.
However, more clinical experience and
information about side-effects are needed before
they can be recommended for wider routine use.
Our study results showed Mefenamic acid to be
more efficacious than Paracetamol as antipyretic in
the Paediatric age group but more extensive studies
and clinical experience is required for its
recommendation for wider use as antipyretic. 2.
These extensive studies should address safety as
well as efficacy issues and should be compared
using all possible methods. 3. More extensive
studies may yield a better antipyretic alternative to
Paracetamol and will also discourage injudicious
use of antipyretic drugs like Nimesulide which is
banned but still used by some pediatricians. 4.
Genetic studies to evaluate the decline in the
28
Kunkulol Rahul et al.,
Int J M ed Res Healt h Sci.2013;2(1):23-29
efficacy of paracetamol as antipyretic should be
taken up.
ACKNOWLEDGEMENT
We acknowledge all the faculty members of the
Department of Paediatrics for their help and
cooperation for this study
REFERENCES
1. Jagdish Chandra and Shishir Kumar
Bhatnagarr. Antipyretics in Children. Indian J
Pediatr. 2002; 69 (1) : 69-74
2. Avtar Let al. Antipyretic Effects of
Nimesulide, Paracetamol and IbuprofenParacetamol. Indian Journal of Paediatrics.
2000; 67 (12): 865
3. Alexander KC et al. Fever in childhood.
Canadian Family Physician.1992; 38: 1832-36
4. K. Rajeshwari. Antipyretic Therapy. Indian
Pediatrics. 1997; 34 : 409-411
5. B S David. Fever panic. Sri Lanka Journal of
Child Health, 2000; 29: 97
6. S Balasubramanian, A Sumanth. Mefenamic
acid – Role as Antipyretic. Indian paediatrics.
2010; 47: 453
7. Autret E et al. Evaluation of Ibuprofen versus
aspirin and paracetamol on efficacy and
comfort in children with fever. Eur J Clin
Pharmacol. 1997 ; 51: 367-371
8. S. Keininen et al. Oral Antipyretic Therapy:
Evaluation of the N-Aryl-Anthranilic Acid
Derivatives Mefenamic Acid, Tolfenamic Acid
and Flufenamic Acid. Europ. J. Clin,
Pharmacol. 1978; 13: 331-344
9. RP Khubchandani, KN Ghatikar, SS Keny,
NG Usgaonkar. Choice of antipyretic in
children. J. Assoc Physicians India.1995; 43
(9): 614-6
10. Keith R. Powell. Fever (ch.170). Nelson
Textbook of Paediatrics: 16thedition.p738.
11. Bikas Medhi et al. Efficacy of fexofenadine in
the Indian population suffering from allergic
rhinitis and urticarial. JK Science. 2006; 8: 83 85.
12. John hunter. Study of antipyretic therapy in
current use. Archives of Disease in
Childhood.1973; 48: 313. -314
13. Praveen Kumar Goyal et al. Double blind
randomized comparative
evaluation of
Nimesulide and Paracetamol as antipyretics.
Indian paediatrics. 1998 ; 35: 24-26
29
Kunkulol Rahul et al.,
Int J M ed Res Healt h Sci.2013;2(1):23-29
International Journal of Medical Research
&
Health Sciences
www.ijmrhs.com Volume 2 Issue 1 Jan-Mar 2013 Coden: IJMRHS
Received: 5th Nov 2012
Revised:30th Nov 2012
Copyright @2013 ISSN:2319-5886
Accepted: 7 th Dec 2012
Original research article
DETECTION OF MALARIAL PARASITE BY BLOOD SMEAR EXAMINATION AND ANTIGEN
DETECTION: A COMPARATIVE STUDY
Erumalla Naveen1, Dimple Arora2, Vinod Agarwal3, Neelam sharma4, Anuradha B5, Vijay Durga S6
1
Lecturer, 3 Professor. Triveni Institute of Dental Sciences, Hospital & Research Centre, Bilaspur, Chhattisgarh.
2
Asst .Prof. Teerthankar Mahavir Medical College. Moradabad, UP.
4
Professor, 5 Associate Professor 6 Assistant Professor, department of microbiology, Mamata Medical College,
Khammam, A.P
* corresponding author email: erumalla@gmail.com
ABSTRACT
At present about 100 countries in the world are considered malarious, is thought to kill between 1.1 and 2.7
million people worldwide each year, of which about 1 million are children under the age of 5 years in these
areas. Under ideal circumstances, the clinical suspicion of malaria would be confirmed by a laboratory test
that is simple to perform, rapid, sensitive, specific and expensive. At the present time, no such test exists.
The most common test for malaria diagnosis remains the microscopic examination of giemsa or the fields –
stained blood smears. The test is based on the detection of Plasmodium falciparum specific histidine rich
protein ii (hrp) and a pan malarial species specific enzyme aldolose, produced by the respective parasites
and released into the blood and the test is based on immune chromatography, the test is highly sensitive.
Method: In this study included 100 patients, 60% of patients had history suggestive of malaria, another 40%
gave the history of irregular fever; For each patient peripheral blood sample was collected, thin and thick
smear blood films were made immediately after blood collection, stained with Leishman stain and examined
for malaria parasite by light microscopy. Results: The blood films results indicated that 40 (20%) patients
were infected with malaria and the rest 171 (85.5%) were malaria negative. Among positive patients
Plasmodium vivax was detected in 24 cases (60%) and Plasmodium falciparum in 10 cases (31%) and 6
cases mixed infection (PV + PF) (15%) correspondingly, the Para HIT Test results indicated that 29 (14.5%)
of the patient sample were positive for malaria parasites and 171 (85.5) were malaria negative out 29
patients cases. Infection with Plasmodium vivax accounted for 17 (58.6%) while infection with Plasmodium
falciparum accounted for 9 (25%) and 3 (1.3%) with mixed infection of Plasmodium vivax and Plasmodium
falciparum.
Keywords: Malaria, Blood smear, Para Hit test.
INTRODUCTION
Malaria is a parasitic infection of global
importance and it remains to be one of the most
significant cause of morbidity and mortality of
humans, worldwide. The disease is a major health
30
Naveen et al.,
Int J M ed Res Healt h Sci. 2013;2(1):30-34
problem in the tropics and subtropics regions.
Annually, approximately 500 million people in the
world suffer from malaria and about 1 million
deaths occur due to this infection. Current efforts
to control malaria focus on reducing attributable
morbidity and mortality by prompt diagnosis of
suspected malarial infection with rapid and
accurate diagnosis for effective therapeutic
intervention.
The protozoan parasite belongs to the genus
Plasmodium. Four species of malaria parasite that
are known to infect humans are Plasmodium
falciparum, Plasmodium vivax, and Plasmodium
ovale and Plasmodium malariae. Plasmodium
falciparum accounts for the majority of infections
that term out to be lethal. While the three other
species cause a less severe form of malaria. The
infection is characterized by intermittent fever with
chills and anemia1-3.
At present about 100 countries in the world are
considered malaria, about half of which are in subSaharan Africa. Although this number is
considerably less than it was in the mid 1950s,
more than 2.4 billion of the world’s population is
still at risk.
Malaria is thought to kill between 1.1 and 2.7
million people worldwide each year, of which
about 1 million are children under the age of 5
years in this areas2-5.
In many developing- world settings, a presumptive
diagnosis of malaria is based upon the presence of
fever alone. While statistically justifiable in sole
regions, such an approach inevitably leads to the
overuse of antimalarial drugs. Under ideal
circumstances, the clinical suspicion of Malaria
would be confirmed by a laboratory test that is
simple to perform, rapid, sensitive, specific and
expensive. At the present time, no such test exists.
The most common test for malaria diagnosis
remain the microscopic examination of Giemsa or
Fields – Stained blood smears. However, the
examination of blood films requires technical
expertise and the availability of a good – quality
microscope. The microscope is also time-
consuming and has limited sensitivity when
parasitemia is low3-5.
Besides these majorities of Malaria cases occur in
rural areas where there is a little or no access to
reference laboratories and in many areas
microscopy is not available. Keeping all these in a
study was done to compare microscopic
examination of blood films with newly develop
Immuno Chromatography dipstic Test.
The test is based on the detection of Plasmodium
Falciparum specific Histidine Rich protein II (HRP
II) and a Pan Malarial Species specific enzyme
Aldolose, produced by the respective parasites and
released into the blood and the test is based on
Immuno Chromatography. The test is highly
sensitive and specific for the diagnosis of
Plasmodium Falciparum, Plasmodium Vivax,
Plasmodium Ovale and Plasmodium Malarial
Infection.
MATERIALS AND METHODS
After approval
of the Institutional Ethics
Committee and inform consent form the patient in
this study included 100 patients attending Mamata
General Hospital 60% of patients had history
suggestive of malaria i.e., rigor, chill, rise of high
temperature with profuse sweating. Another 40%
gave the history of irregular fever; Patients that
have been treated for malaria in the previous four
weeks were excluded from this study. For each
patient peripheral blood sample was collected into
a sterile tube containing potassium EDTA. Thin
and thick smear blood films were made
immediately after blood collection, stained with
Leishman stain and examined for malaria parasite
by light microscopy. According to standard
practice a thin blood smear was examined for 15
minutes and for a thick blood film 200 fields were
visualized. All the blood sample was tested with
Para HIT total dipstick test according to
manufacturers instruction and results were
compared to those obtained from examination of
thin and thick blood smears.
The test is based on the detection ofPlasmodiumm
falciparum specieshistidinee rick protein II (HRP
31
Naveen et al.,
Int J M ed Res Healt h Sci. 2013;2(1):30-34
II) and a pan malarial species specific enzyme
Aldolase, produced by the respective parasites and
released into the blood.
RESULTS
Positive: Appearance of three magenta red colored
bands, one each in the anti falciparum antibody
region, anti malarial antibody region and control
region indicates that the sample is reactive for
Plasmodium falciparum and mixed infection with
another malarial species. (Plasmodium vivax is
most commonly encountered in India).
Negative: Appearance of only one magenta red
colored band in the control region indicates that the
sample is non-reactive for Plasmodium species.
Error: No band observed in control or test region
indicates improper test procedure or deterioration
of reagents. Repeat the test using a fresh test strip.
The magenta red coloured test bands indicate
reactive result representing the binding of antigen
antibody complex to a monoclonal antibody that
has been pre-immobilized on the test strip. In nonreactive sample no magenta red coloured band is
seen in test region. A reactive procedural control
band is also built into validate the results as well as
proper test performance.
Blood Smear
Para HIT
22
P. vivax
11
3
24
13
3
P. falciparum
Both Pf+pv
164
160
Negative
Fig.1: Examined Blood smear report & Para hit report
Table:1. Comparision of blood smear examination and antigen detection
Parameters
Positive
Blood Smear
%
Positive
Para HIT
%
PF
10
(25%)
9
(31%)
PV
24
(60%)
17
(58.6%)
Mixed
6
(15%)
3
(10.3%)
Total
40
(20%)
29
(14.5%)
A total of 200 blood samples was tested from the
month of March 2007 to December 2007 for
malaria parasites by the Para HIT method and the
results were compared to those obtained from
examination of thin and thick smear blood films.
The blood films results indicated that 40 (20%)
patients were infected with malaria and the rest
171 (85.5%) were malaria negative. Among
positive patients Plasmodium vivax was detected
in 24 cases (60%) and Plasmodium falciparum in
10 cases (31%) and 6 cases mixed infection (PV +
PF) (15%) correspondingly, the Para HIT Test
32
Naveen et al.,
Int J M ed Res Healt h Sci. 2013;2(1):30-34
results indicated that 29 (14.5%) of the patient
sample were positive for malaria parasites and
171 (85.5) were malaria negative out 29 patients
cases. Infection with Plasmodium vivax
accounted for 17 (58.6%) while infection with
Plasmodium falciparum accounted for 9 (25%)
and 3 (1.3%) with mixed infection of Plasmodium
vivax and Plasmodium falciparum.
The blood film examination identified 7
Plasmodium vivax positive samples that were not
detected by the Para HIT Test and 1 Plasmodium
falciparum case identified by blood film
examination and not detected by the para HIT test.
However there was 100% agreement between
blood film results and Para HIT results for the
other 29 cases.
DISCUSSION
The resurgence of malaria has renewed interest in
developing not only preventive measures, but also
rapid diagnostic techniques. A multitude of
factors has contributed to the reemergence of
malaria, including
(i) Insecticide resistance in the Anopheles
Mosquito.
(ii) Social instability resulting in movements of
unexposed non immune individuals in areas
where malaria is endemic, and
(iii)The failure to develop an effective malaria
vaccine.
Compounding the problems of malaria’s
geographical expansion and of increasing
morbidity and mortality are the emergence and
rapid spread of antimalarial drug resistance.
Which necessitate the use of more expensive and
sometimes toxic antimalarial drugs and longer
treatment courses? In addition, the cyclic
recurrence of malaria epidemics has a tremendous
impact on the health infrastructure in developing
countries and adversely affects local economics,
since infected individuals are often too debilitated
to work.
One of the most pronounced problems in
controlling the morbidity and mortality caused by
malaria is limited access to effective diagnosis
and treatment in areas where malaria is endemic.
Clinical diagnosis of infection with the malaria
parasite requires microscopic observation of
parasites on a Giemsa – stained blood smear.
Microscopic examination of blood smears
requires highly skilled people to perform or
interpret results.
Several methods have been developed to
supplement and replace the conventional
microscopic method. The most promising new
malaria diagnostics are the serological Antigen
detection tests. Para HIT is one amongst them.
We employed this test and compared it with a
conventional smear examination for diagnosis of
Plasmodium falciparum and Plasmodium vivax
infection6-8.
The antigen detection test identified (14%) as
malaria positive while the blood film identified
(20) to be malaria positive. Some malaria
infections detected by blood film were not
detected by the Para HIT test. This may be
explained by the fact that increased awareness of
malaria among the general public has led to a
rampant misuse of antimalarial drugs in
inadequate doses empirically for any fever. Since
Para HIT detects PLDH which is produced only
by living parasites, the blood samples judged
negative by Para HIT may have been dead
parasites and not yet cleared from the host. Two
cases of Plasmodium vivax detected by blood film
were not detected by Para HIT. This may be due
to insufficient enzyme production which occurs
during early malarial infection or the patient blood
samples contained parasites at concentrations
below the Para HIT tests detection level eight
blood samples in which Para HIT detected
Plasmodium falciparum band were found to be
negative in the blood smear examination. This
may be explained by the fact that Plasmodium
falciparum can sometimes sequester and may not
be present in circulating blood. 9,10
This test has the added advantage that it can detect
all fouPlasmodiumum species and can be used to
follow the efficiency of drug therapy since it
detects on enzyme produced only by living
33
Naveen et al.,
Int J M ed Res Healt h Sci. 2013;2(1):30-34
parasites. Although it has got a number of
advantages one needs to keep in mind the cost of
the test which may not be affordable by many.
The high cost of the test may prevent its regular
and routine we in many of the laboratories.
However, it was a valuable adjunct at the time of
emergency for rapid diagnosis, although
microscopy remains the mainstay for the
diagnosis of malaria for routine use in countries
like India.
REFERENCES
1. Momar Ndao, Etienne B, Evelyne K, Theresa
WG, Dick MacLean , Brian J W. Comparison
of Blood Smear, Antigen Detection, and
Nested-PCR Methods for Screening Refugees
from Regions Where Malaria Is Endemic after
a Malaria Outbreak in Quebec, Canada. J Clin
Microbiol. 2004; 42 (6): 2694–2700.
2. Manjunath PS, Preeti BM, Basavaraj VP.
Comparative Study of Peripheral Blood
Smear, QBC and Antigen Detection in
Malaria Diagnosis. Journal of Clinical and
Diagnostic Research. 2011;5 (5): 967-9.
3. Cooke AH, Chiodini PL, Doherty T, Moody
AH, Ries J, Pinder M. Comparison of a
parasite lactate dehydrogenase-based immune
chromatographic antigen detection assay
(OptiMAL) with microscopy for the detection
of malaria parasites in human blood samples.
Am J Trop Med Hyg. 1999; 60(2):173-6.
4. DK Mendiratta , Bhutada K, Narang R,
Narang P. Evaluation of different methods
for diagnosis of P. Falciparum malaria. Indian
Journal of Medical Microbiology, (2006) 24
(1):49-51
5. Parija
SC, Dhodapkar
R, Subashini
Elangovan, DR Chaya. A comparative study
of blood smear, QBC and antigen detection
for diagnosis of malaria. 2009; 52(2):200-2
6. Bhat Sandhya K, Sastry S, Nagaraj ER,
Sharadadevi Mannur, Sastry AS. Laboratory
diagnosis of malaria by conventional
peripheral blood smears examined with
Quantitative Buffy Coat (QBC) and Rapid
Diagnostic Tests (RDT) - A comparative
study. International Journal of Collaborative
Research on Internal Medicine & Public
Health. 2012; 4(10): 1746-55
7. Hovette P, Aubron C, Perrier-Gros-Claude
JD, Schieman R, N'Dir MC, Camara P. Value
of Quantitative Buffy Coat (QBC) in
borreliasis-malaria co-infection] Med Trop
(Mars). 2001; 61(2):196-7.
8. Carol JP, John FL, Winslow IK, Jose AQ,
Rina Kaminsky, Marianna KB, Arba LA.
Evaluation of the OptiMAL Test for Rapid
Diagnosis of Plasmodium vivax and
Plasmodium falciparum Malaria. Journal of
Clinical Microbiology. 1998; 36 (1) 203–6
9. Beatriz EF, Iveth J González, Fanny de
Carvajal, Gloria I Palma, Nancy G Saravia
Mem Inst Oswaldo Cruz, Rio de Janeiro,
Performance of OptiMAL in the Diagnosis
of Plasmodium
vivax and Plasmodium
falciparum Infections in a Malaria Referral
Center in Colombia.2012; 97 (5) 731-35
10. Kakkilaya
BS. Rapid Diagnosis of
Malaria. Lab Medicine. 2003;8(34):602-08
34
Naveen et al.,
Int J M ed Res Healt h Sci. 2013;2(1):30-34
International Journal of Medical Research
&
Health Sciences
www.ijmrhs.com Volume 2 Issue 1 Jan-Mar 2013 Coden: IJMRHS Copyright @2013 ISSN:2319-5886
Received: 15 th Nov 2012
Revised: 13th Dec 2012
Accepted: 19th Dec 2012
Original research article
A COMPARATIVE STUDY AMONG THE THREE WHEELER AUTOMOBILE DRIVERS ON
PULMONARY FUNCTION TESTS IN ADULT MALES OF GULBARGA CITY
*Afshan Afroz1, Salgar Veeresh B2, Sugoor Manjushree3, Swati I Amrutha
1
Department of Physiology, KIMS, Amlapuram, 2Dept of Gen. Medicine, KBNIMS, Gulbarga, 3Dept of
Biochemistry, KBNIMS, Gulbarga, 4Department of Com. Medicine, KBNIMS, Gulbarga.
*Corresponding author email: drafrozafshan@gmail.com
ABSTRACT
Background: Development of our country has led to rapid urbanization and there is increasing use of
automobiles that is aggravating environmental pollution. Occupational exposure to automobile exhaust
and industrial smokes has been shown to affect functioning of different systems of the body. The present
study was taken up to assess the Pulmonary Function Tests (PFT) in auto rickshaw drivers of Gulbarga
city. Methods: Fifty non –smoker male auto drivers in the age group of 20–50 years for more than 5
years of auto driving experience formed the study group. Age and sex matched individuals not exposed to
auto rickshaw driving [administrative staff] formed the control group. Pulmonary function parameters
FVC, FEV1, FEV1%, PEFR, PIFR, FEF25-75, FEF50 and MVV were assessed using a computerized Spiro
meter during their working hours and were statistically analyzed. Results: There was a highly significant
decrease in FVC and FEV1 in the study group compared to control group. The decrease in FEV1%, PIFR,
FEF25-75 and FEF50 were statistically significant but the decrease in PEFR and MVV were statistically nonsignificant. Conclusion: Our findings point towards the adverse effects of vehicle exhaust on lung
functions, mainly on lower airways with restrictive pattern of disease.
Keywords: Automobiles, Auto drivers, Pulmonary function tests.
INTRODUCTION
The development of our country has brought
many
changes
that
include
increased
industrialization,
improved
transportation
facilities, jobs in various fields. Modern lifestyles
have certain adverse effects on our surroundings.
Rapid urbanization led to increased use of
automobiles that is aggravating environmental
pollution. Experimental studies indicate that
airborne contaminants lead to injury to the
airways and lung parenchyma in subjects who are
exposed to it (1,2). Occupational exposure to
automobile exhaust and industrial smokes has
been shown to affect functioning of different
systems of the body. Numerous epidemiological
studies have documented decrements in
pulmonary function and various other health
35
Afshan Afroz et al.,
Int J M ed Res Health Sci. 2013;2(1):35-39
problems associated with long term air pollution
exposure(3-7) .Health effects of occupational
exposure to petroleum vapors and air pollution
from vehicular sources is relatively unexplored
among auto rickshaw drivers. There is limited
published data regarding the pulmonary function
test abnormalities in auto-rickshaw drivers. Hence
we undertook this study.
To meet the present day requirement, there is an
increase automobile use and because of the
predominant role of gasoline [petrol] as a motor
vehicle fuel, the effects of gasoline engine
emissions are potentially even greater problems.
In the persons exposed to these pollutants,
pulmonary function tests are used as screening
tests to determine their effects8 .Therefore, the
present study is taken up to evaluate the changes
in Pulmonary Function Tests (PFTs) like Forced
Vital Capacity (FVC), Forced Expiratory Volume
in the first second (FEV1), FEV1/FVC ratio, Peak
Expiratory Flow Rate (PEFR), Peak Inspiratory
Flow Rate (PIFR), Forced Expiratory Flow in 2575% of vital capacity( FEF25-75), Forced
Expiratory Flow at 50% of vital capacity (FEF50 )
and Maximum Voluntary Ventilation (MVV) of
auto rickshaw drivers in Gulbarga city.
MATERIALS AND METHODS
The present study was conducted in Salgar
hospital in Gulbarga city. Gulbarga is located in
the north Karnataka region of South India. Ethical
clearance was taken from the Institutional Ethical
Committee and each subject gave the consent.
The study group consisted of 50 males in the age
group of 20–50 year, who was driving auto
rickshaw for 8 hours per day for more than 5
years in Gulbarga city. The control group
consisted of 50 males of the same age group from
administrative post, who were not exposed to auto
rickshaw driving. The subjects in the study group
and the control group had certain inclusion and
exclusion criteria.
Inclusion criteria
Male subjects of age between 20-50 years and
subjects with no history of allergic disorders,
respiratory disorders like asthma, or any systemic
disease, no history of smoking, chewing tobacco
and intake of alcohol.
Exclusion criteria
Subjects with age less than 20 years and more
than 50 years of age, alcoholics, persons with
systemic diseases, smokers who had chest wall
deformities, neuromuscular disease, severe
obesity, previous thoracic surgery and females
were excluded from the study.
Age, height, and weight were recorded. All the
Pulmonary functions were tested during day time
using computerized Spirometer [MEDSPIROR].
The subjects were familiarized with the
instrument. All the tests were carried out at the
same time of the day, between 10-11 AM. All the
subjects were in sitting position and wearing nose
clips9. The subjects were asked to breathe
forcefully following deep inspiration into the
mouthpiece attached to the pneumatachometer. 3
readings of maximal Inspiratory and expiratory
efforts were recorded and the best reading was
taken for statistical analysis. Statistical methods
used in our study was a student’s unpaired t test
using SPSS-16. The P< 0.05 was considered
statistically significant and P< 0.001 was
considered highly statistically significant.
RESULTS
Table:1. Comparison of mean values of the age, height and weight of the subjects and the controls
Parameters
Study group
Control group
36.4±7.40
34.8±3.76
Age [years]
170.40 ± 3.39
174.60 ± 4.15
Height [cm]
72.60 ± 7.56
74.40 ± 8.24
Weight [kg]
The subjects and controls did not differ significantly on above parameters.
36
Afshan Afroz et al.,
Int J M ed Res Healt h Sci. 2013;2(1):35-39
Table: 2. Comparison of lung volumes and capacities between study and control groups
Parameter
Study group (n=50)
Control group (n=50)
p-value
2.77±0.41
3.33±0.50
FVC (L)
2.67±0.46
3.11±0.33
FEV1 (L)
88.25±13.34
90.31±10.12
FEV1%
110.80±18.63
130.16±26.89
MVV
(L/min)
*P value<0.05 is statistically Significant, **P value<0.001 is highly statistically Significant
0.001**
0.001**
0.050*
0.059
In table-2 there was highly statistically significant decrease in FVC, and FEV1 in the study group when
compared to the control group. There was a statistically significant decrease in FEV1. In addition, there
was a decrease in MVV but it was not statistically significant.
Table: 3. Comparison of flow rates among study and control groups
Parameter
PEFR (L/min)
PIFR (L/min)
FEF25-75 (L/min)
FEF50 (L/min)
Study group (n=50)
Mean ±SD
5.47±1.40
2.21±0.67
3.60±1.33
4.16±1.22
Control group (n=50)
Mean ±SD
7.05±1.59
3.61±1.10
4.85±1.11
5.17±1.32
P value
0.15
0.04*
0.04*
0.05*
*P value<0.05 is statistically Significant, **P value<0.001 is highly statistically Significant
Table 3 indicates the flow rates among both the groups. The decrease in PEFR was statistically not
significant whereas the decrease in PIFR, FEF25-75 and FEF50 was statistically significant with p ≤0.05.
DISCUSSION
Occupational health has been gaining importance
for the fact that long term exposure to vehicle
exhaust, petrol and dust can lead to a permanent
morbidity. The acute health risks involved are
minimal, provided that the precautionary
methods are used in accordance with appropriate
health and safety practices.
Highly statistically significant decrease in FVC
and FEV1 was observed in auto drivers when
compared to their controls, and their ratio
(FEV1%) was significant between the two
groups. This finding indicates the restrictive
pattern of pulmonary involvement in the study
group. Auto rickshaw drivers are at risk of dust
inhalation, petrol vapor inhalation and also
inhalation of automobile exhaust for a longer
period of time that is at least 8 hours per day for
more than one year and they have more chances
of chronic involvement of lungs as indicated by
the results in the present study.
The benzene content of petrol has typically been
in the range 1–5% may be an exacerbating factor
for the lung function abnormalities observed as
the study groups were nonsmokers. Smoking as
an independent variable was found to affect
FEV1 significantly and smoking has shown to
accelerate the decline in lung function in a time
dependent manner10. As the auto drivers are most
of the time on busy roads and exposed to
automobile exhaust and other air pollutants.
Automobile exhaust is a complex mixture of
different gases like Sulphur dioxide (SO2),
Carbon dioxide, Carbon monoxide (CO),
Nitrogen dioxide (NO2) and particulate matter.
Some studies have demonstrated that exposure to
particulate matter combined with exposure to an
37
Afshan Afroz et al.,
Int J M ed Res Healt h Sci. 2013;2(1):35-39
irritant gas such as NO2 results in greater damage
to the lung than when exposed to either
substance individually11.In combination with
particulate pollutants, SO2 and NO2 have a
greater chance to reach the deeper parts of the
lungs. The gaseous pollutants may also alter the
properties and concentration of surfactant and
contribute to the early closure of small airways.
Much of the terminal bronchioles may be
compromised before other pulmonary function
tests such as FEV1 are affected12.
Few histopathological studies have provided
evidence that the small airways are the site of
damage in people living in areas of high air
pollution13. The particles generated from diesel
exhaust are extremely small and are present in
the nuclei or accumulation modes with a
diameter of 0.02 ηm and 0.2 ηm respectively.
These small sized particles, by virtue of their
greater surface area to mass ratio, can carry a
much larger fraction of toxic compounds, such as
hydrocarbons and metals on their surface.
Importantly they can remain airborne for long
periods of time and get deposited in greater
numbers and deeper into the lungs than larger
sized particles. Hence chronic exposure to them
can lead to chronic inflammation of respiratory
tract and lung parenchyma. These would
contribute to the substantial decrease in lung
functions in the form of a restrictive pattern as
indicated in the present study.
Rajkumar studied the effect of air pollution on
the respiratory system of the auto rickshaw
drivers in Delhi. The study found that (19%)
drivers showed normal Pulmonary Function Test
(PFT). (80%) showed mild and moderate to
severe obstruction, of which (48%) were nonsmokers and (52%) were smokers and the result
concludes that auto rickshaw drivers have a high
respiratory morbidity due to exposure to
pollution.14 In a study, reduced mechanical
properties of breathing were attributed to
exposure to benzene in the vapors of petrol15.
Bijendra Kumar et al examined the pulmonary
function test in three wheeler diesel taxi drivers
in Bikaner city. They found restrictive
impairment in 87% of the study group, of which
50% were smokers and 37% were non-smokers,
mixed pattern (both restrictive and early
obstructive impairment) was found in only 13%
of the study group, of which 7% were smokers
and 5% non-smoker. So they concluded that
when all the five parameters (FVC, FEV1,
FEV1/FVC, FEF 25–75% and PEFR) were taken
together they were indicative of mixed pattern
(obstructive and restrictive) lung impairments 16.
Chattopadhyay et al conducted a study on garage
workers, drivers and conductors of Kolkata city
to assess the pulmonary function status of these
workers and found that FEV1, FEV1% and flow
rates, FEF 02-121, FEF25%-75% values showed
a gradual decrement as age and duration of
exposure increased17.
CONCLUSION
From the present study it was concluded that
respiratory functions of the auto rickshaw drivers
who are continuously exposed to emissions from
vehicles, petrol vapor and dust were significantly
reduced as compared to respiratory functions of
age, weight and height matched control groups.
To prevent the respiratory dysfunction among auto
drivers, medical observation and periodic checkups
for pulmonary function tests should be performed.
Control strategies should be adopted to reduce the
vapor concentration in the air, like vapor
adsorbents and to reduce the benzene concentration
in the ambient air. Personal protective equipment
must be worn by auto rickshaw drivers. Imparting
health education to auto rickshaw drivers will
prevent respiratory morbidity. Further long term
perspective studies on auto rickshaw drivers will
help in getting a comprehensive picture of long
term effects.
ACKNOWLEDGEMENT
This research paper is made possible by the
support from the participants of our study. We
dedicate our acknowledgment of gratitude
towards Mr.Shaik.Meera and Dr. Rashmi.C.G as
38
Afshan Afroz et al.,
Int J M ed Res Healt h Sci. 2013;2(1):35-39
they kindly read our paper and offered valuable
detailed advices on grammar, organization, and
theme of the paper. Finally, we sincerely thank
almighty, family and friends, who provided
financial support and timely advice.
REFERENCES
1. Lewis TR, Moorman WJ, Yang YY, Stara JF.
Long term exposure to auto exhaust and other
pollutant mixture. Arch Env Health 1974;
21:102–06
2. Chhabra SK. Air pollution and health. Indian
J Chest Dis Allied Sci 2002; 44: 9–11.
3. Mayank Singhal et al “pulmonary functions
in petrol pump workers: A preliminary
study” IJPP; 2007; 51 (3)244-248.
4. Gamble J, Jones W, Minshall S.
Epidemiological- Environmental study of
Diesel Bus Garage workers: Acute effects of
NO2 and respirable particulate on the
respiratory system. Environ Research 1987;
42: 201–214.
5. Nakai S, Maeda K, Crest JST. Respiratory
health associated with exposure to
automobile exhaust. III. Results of a cross
sectional study in 1987, and repeated
pulmonary function tests from 1987 to 1990.
Arch Environ Health 1999; 54: 26–32.
6. Chabra SK, Chabra P, Rajpal S, Gupta RK.
Ambient air pollution and chronic respiratory
morbidity in Delhi. Arch Environ Health
2001; 56: 58–63.
7. Ware JH, Spengler JD, Neas LM, Samet JM,
Wagner GR, Coultas D et al. Respiratory and
irritant health effects of ambient volatile
organic compounds. The Kanawa county
health study. Am J Epidemiol 1993; 137:
1287–1301.
8. Kamat SR et al. Prospective 3 year study of
health morbidity in relation to air pollution in
Bombay India; Methodology and early
results up to 2 years. Lung India, 2, 1984, 120.
Afshan Afroz et al.,
9. Standardisation of spirometry 1994 Update.
American Thoracic Society. Am J Respir
Crit Car Med 1995; 152 (3) :1107–36.
10. Chawla A, Lavania AK. Air pollution and
fuel vapour induced changes in lung
functions: Are fuel handlers safe? IJPP 2008;
52 (3) :255–61.
11. Boren HG. Pathophysiology of air pollutants.
Environ Res 1967; 1:178.
12. Cotes JE. Lung function assessment and
application in medicine. 5th ed. Oxford
Blackwell Scientific Publications, 1993.
p122.
13. Souza MB, Saldiva PHN, Pope CA,
Capelozzi VL. Respiratory changes due to
long term exposures to urban levels of air
pollution. Chest 1998; 113:1312–18.
14. Rajkumar. Effect of air pollution on
respiratory system of auto rickshaw drivers in
Delhi. Indian Journal of Occupational and
Environmental Medicine. 1999 Oct-Dec.; 3
(4) :171-73.
15. Kesavachandran C, Mathur N, Anand M,
Dhawan A. Lung function abnormalities
among petrol pump workers of Lucknow,
North India. Current Science 2006; 90:1177–
78.
16. Binawara BK, Gahlot S, Kamlesh Chandra
Mathur, Ashok kakwar, Reshu Gupta,
Rajnee. Pulmonary function tests in three
wheeler diesel taxi drivers in Bikaner city.
Pak J Physiol 2010; 6 (1):28-31.
17. Chattopadhyay BP, Alam J, Roychowdhury
A. Pulmonary function abnormalities
associated with exposure to automobile
exhaust in a diesel bus garage and roads.
Lung India, 2003, 181 (5), 291-302.
18. Madhuri BA,ChandrashekharM, Ambareesha
Kondam. A study on pulmonary function test
in petrol pump workers in Kanchipuram
Population. IJBMR. 2012;3(2):1712-14
Int J M ed Res Healt h Sci. 2013;2(1):35-39
39
International Journal of Medical Research
&
Health Sciences
www.ijmrhs.com
Volume 2 Issue 1 Jan-Mar 2013
Coden: IJMRHS Copyright @2013 ISSN:2319-5886
Received: 1st Dec 2012
Revised: 15th Dec 2012
Accepted: 20th Dec 2012
Original research article
AN ETHNOBOTANICAL SURVEY OF MEDICINAL PLANTS USED BY TRADITIONAL
HEALERS OF THADVAI, WARANGAL DISTRICT, ANDHRA PRADESH, INDIA.
Soma Manjula , *Estari Mamidala
Infectious Diseases & Metabolic Disorders Research Lab, Department of Zoology, Kakatiya University,
Warangal, Andhra Pradesh, India
*Correspondence author email : estari08@gmail.com
ABSTRACT
Since ancient times, plants have been used as medicine, foods, Agrochemicals and pharmaceuticals by large
number of tribes, rural and urban people. India has more than 300 tribal communities. The tribal region of
Andhra Pradesh has not received proper attention of ethnomedicinal researchers. Therefore, a survey of
ethnomedicinal plants used by Koya tribes of Medaram and Narlapura villages which are on the south of the
Godavari River, Thadvai Mandal, Warangal District; Andhra Pradesh, India was undertaken. The
information on plants was collected by interviewing the local tribal traditional practitioners. The
present study revealed that the plants which are used in traditional systems are mostly collected from
the wild resources. A total of 36 plant species (belonging to 24 families) of ethno botanical interest upon
inquiries from these tribal informants’ between the age of 35-78 were reported. They have been using these
parts in the form of paste, powder, decoction, juice, infusion and also in crude form, with other additives
like honey, curd, and urine and cow milk to get relief from different ailments like diabetes, inflammations,
wounds, skin diseases, headache, indigestion, urinary infections, fever, snake bites, cough, and dental
problems. This study therefore concludes, it is necessary that suitability requirements are needed in order to
protect the traditional knowledge in a particular area with reference to medicinal plant utilization. The plants
need to be evaluated through phytochemical investigation to discover potentiality as drugs.
Keywords: Ethnomedicine, Koyas, Warangal
INTRODUCTION
Traditional medical practices are an important part
of the primary health care system is the developing
World.1 The ethno botanical survey can bring out
many different clues for the Development of drugs
to treat human diseases. Now-a-days, a trend in the
study of medicinal plants and their use in
traditional medicine has been drawing the attention
of different medical practitioners throughout the
world. People have become health cautious; the
phototherapy is more safe and effective in curing
40
Manjula et al.,
Int J M ed Res Healt h Sci.2013;2(1):40-46
ailments without any side effects. 2 Ethnic groups
of various regions of the world are the real
custodians of nature’s wealth and experts in herbal
medicine.3 The traditional indigenous knowledge
transferred orally for centuries is fast disappearing
because of the technological developments and
changing culture of ethnic groups.2 It is for this
reason the study of ethnomedicine and its
restoration have been taking place.
In many countries of Africa, Asia and Latin
America people depend on traditional knowledge
and medicinal plants to meet some of their primary
health care needs. For instance in Africa up to 80%
of the population use traditional medicine for
primary health care.4 Likewise, many Ethiopian
communities are dependent on local plant
resources for medicine. Moreover, the people in
ethnic tribes are averse to change the mode of their
life and traditions. But this traditional medical
knowledge is slowly diminishing, so it is to be
procured and preserved in various forms for future
generations. Thus, this study aimed to ascertain the
detailed information on the use of plants and their
therapeutic medical practices popular among Koya
tribes of Thadvai Mandal, Warangal district,
Andhra Pradesh.
MATERIALS AND METHODS
Study Area
Warangal is a city and a municipal corporation in
Warangal district in the Indian state of Andhra
Pradesh. Warangal is located 148 kilometers
northeast of the state capital of Hyderabad and is
the administrative headquarter Hyderabad,
Warangal District. Warangal is located at 18.0°N
79.58°E. It has an average elevation of 302 meters
(990 feet). As of 2011 India census5, Warangal had
a population of 759,594. Males constitute 51% of
the population and females 49%. Warangal has an
average literacy rate of 84.16%, higher than the
national average of 74.04%: male literacy is
91.54%, and female literacy is 76.79%.
Fig:1. Study area location
Ethno botanical Survey
The ethnomedicinal information was collected
from knowledgeable local aged people, herdsmen
and local healers of Medaram and Narlapur
villages of Warangal district, Andhra Pradesh aged
between 35-78 years. The information on
ethnomedicine was collected during August 2011
Manjula et al.,
to September 2012 through interviews and
discussions. The collected information includes
useful plant species with local names, parts of the
plant used for curing different diseases. The plant
specimens collected with the help of the
inhabitants of surveyed villages. The scientific
Int J M ed Res Healt h Sci.2013;2(1):40-46
41
names of plant species their families were
identified with the help of a senior taxonomist of
Department of Botany, Kakatiya University,
Warangal. The data collected from different
sources of ethnic community consists of 36 plant
species whose different parts are used for curing
different diseases.
RESULTS AND DISCUSSION
The present study includes 36 numbers of plant
species of Angiosperms belonging to 24 families
are reported. The alphabetical order of scientific
name of the plants, their families local names,
diseases, parts used, mode of administration with
duration and doses are furnished with table-1. The
information provided in the table is collected from
local healers through interviews and discussions.
They have good knowledge about the use of plants
for curing various ailments and also believe in
supernatural powers which are also a part of their
healing methods. The diagnosis of different
pathologies is the first step in phyto cure treatment
which can be known by one's nose, ear, hands, and
eyes and is interesting.
Table. 1: List of medicinal plant used by Koyas of Thadvai Mandal, Warangal District, Andhra
Pradesh, India.
S.No Botanical & family name Common
Part used & Mode to use Medicinal uses
Name
Andrographis Parculata
Nelavemu
Leaf crush or Powder with Control Diabetes
1
(Acanthaceae)
honey mixture
Acassia auriculata
Thangedu
All parts in same quantity Diabetics and Urinary
2
(Caesapinaceae)
and add the water or puss
honey.
Tinospora
Cordifalia
Thippa
Teega.
Creepers and Leafs
Diabetics
3
(Menispermaceae).
Dry powder or 1 teaspoon
Juice
Emblica aphicinalis,
Usiri
Powder of dry fruit is Diabetics
4
(Euphorbiaceac)
mixed
with
turmeric
powder
along
with
thangedu leafs
Mymosa
Peudica,
Athipathi.
Leaf powder with water
Blood
purification,
5
(Mimosoidae)
nose bleeding, and
jaundice. Respiratory
diseases, heart disease.
Removing water from
the body
Eugeniajambolana
Neredu
Seed, Dried and powered
Diabetes
6
(myrtaceae or
mixed with and taken
myrluscuceius)
before meals
Aclupta alba (asteraceae, Guntagalagara Leaves, Dried under shade Grey hair
7
.
and finally powered this is
boiled with oil and applies
to white hair for about 40
days
Partheniunhisteroporouse Nagkesaralu. Flower, Powered and
Hyper urination
8
(asteraceae)
mixed with buttermilk.
Aerva lenata
Pindi kura.
Whole plant Boiled with Kidney
pains
or
9
(Amaranthaceae)
water.
kidney stones
42
Manjula et al.,
Int J M ed Res Healt h Sci.2013;2(1):40-46
10
Tectonegrandis
(Verbenaceae)
Teaku
Flower, Flower is grinded
with water and made into
paste now this paste is
layered below the stomach
11
Dolichas biflorous
(Fabaceae)
Blackuluvalu
Seed, Soak in water and Piles can be controlled
grind into a paste and place
on the anus
12
Bombox ceiba
(Bombacaceae)
Phyllonthus niruri
(Euphorbiaceae)
Parteinsonia ariculata
(Caesalpinacea)
Casiafistula,
(Caesalpinaceae),
Hardwictia binata,
(Caeselpinacaae)
Odinaoodier
(Anacardiaceae)
Litseasebifera
(Lauraceae)
Holoptaliaintegricelia
(Urgicaceae)
Burugu
chekka
Nela usiri
13
14
15
16
17
18
19
20
21
22
23
24
25
26
27
Bark, Grind the bark and
mixed with water
Creepers are grinded and
mixed with water
Giluku Cekka. Roots, Grinded form
Raala kaya.
Fruit
Direct intake
Narepa
Bark, Directly layer on the
leg or hand fracture
Dhumpudu
Bark, Directly applied on
wounds
Narre mamedi Bark, Juice of bark Is
mixed with water
Namelinara
Bark, Fresh juice of the
bark is mixed with curd
and taken
Leucasaspera
Thumikuru,
Root, Mix the grind roots
and peppers and then mix
(Lamiaceae)
with boiling water and take
through orally
Menordica
Kakara chettu, Leaf and unripe.
(cucurbitaceae)
The leaf extract is poured
into nostril
Sphaeranthus indicus Linn Bodasaram
Leaf. The leaves are
grinded with pepper and a
(Asteraceae)
dose of spoon extract is
orally
Soymida febrifuga A. Juss. Somi
Bark. The bark soaked
( Meliaceae)
water
Solanum xanthocarpus
Nelamulaka
Root. The aqueous extract
Schard. & Wendl
of the root with a dose of 1
( Solanaceae)
spoon per day is orally
Barinka, Pakki Latex,
Streblus asper Lour
The latex in
( Moraceae)
combination with turmeric
applied on head
Bryophyllum
Ranapala
Leaves. Grind the leaf and
(Crusulaceae)
applied to wounds
Cyperus rotandus
Garika
Leafs Applied to the
(Cyperaceae)
wounds
Urine flow will be
cleared
Body heat regulations
Jaundice
Regulation of Body
temperature
Fids legs scrams
Pains
can
be
controlled
The wound will be
healed quickly.
Diabetes
Abdominal pain
asthmatic problem
Migraine
Sexual stimulation.
Body
pains
and
Diabetic
Diarrhea.
fever and cough, cold
Cold relief
Wounds healing
Wounds healing
43
Manjula et al.,
Int J M ed Res Healt h Sci.2013;2(1):40-46
28
29
30
31
32
33
34
35
36
Datura metal
(Solanaceae)
Madhuca indica
(Convolvunaceae)
Riccinus communis
(Euphorbiaceae)
Strichnus nuxvimoca
(Loganiaceae)
Lowsina (Lytrhoceae)
Centella aciatica
(Mackinlayaceae)
Plumbago zeylancia
(Plambaginaceae)
Nona squmosa
(Annonaceae)
Ocimumtenuifloram
(Lamiaceae)
Nalla
Ummetta
Ippa
Leaf and Bark
Skin allergy
Flower and seeds
Blood purification
Amudam
leafs
Control body pains
Vishamushti
Bark and fruit juice.
Leprosy
Gorinta
Saraswthi
Leaves
Jaundice
Leaves. leaf is grinded & Improve
mixed with honey
Memory power
Root, bark and leaves
Relief body pain
Chitramala
Seetapalam
Leaves. Grained the leaf
and applied to the tumor
Leaves. Juice of leaves
Tulasi
The tribal healer’s preparations are either based on
single plant part or combination of several plant
species parts. The mode of ethnomedicine usage
for different diseases is in various forms, such as
aqueous extract, paste and oil. In addition, milk,
ginger, pepper, oil, turmeric and jiggery etc. are
used as ingredients in the administration of
ethnomedicine. The ethnic tribe (Koya) of these
villages is healthy and not suffering from common
problems like depression, blood pressure and
diabetes which are common in urban people. List
Root,
14%
Tumours
can
controlled
Cold and cough
be
of medicinal plant used by Koyas of Thadvai
Mandal, Warangal District, Andhra Pradesh, India.
Conversely, the same ethnic tribe occupying
different vegetation habitats is to be studied ethno
botanically.6
Among 36 plants belongs to 24 Families, 31% of
leaves, 21% Bark, 14% roots, 12 % Flowers, 12%
Seeds and 5% Fruits are used for various diseases.
The most widely sought after plant parts in the
preparation of remedies in the study area are the
leaves (31%) and stem bark (21%) (Figure 2).
Creaper,
5%
Leaf, 31%
Seed,
12%
Bark,
21%
Flower,
12%
Fruit,
5%
Fig: 2. Parts using from the Different Plants
44
Manjula et al.,
Int J M ed Res Healt h Sci.2013;2(1):40-46
These plant species are used for the treatment and
prevention of many ailments and diseases grouped
under 10 ailment categories (Figure 3). The main
ailments in the study area were cold, cough, wound
healing, urinary disorders, body pains, stomach
pain, jaundice, diarrhea, kidney diseases, neural and
other diseases. The largest number of medicinal
plant species are available for the treatment of skin
diseases, body pains and stomachache. Half of the
remedies for the above ailments are taken orally,
followed by external application. Generally, fresh
part of the plant is used for the preparation of
medicine. To improve the acceptability of certain
oral remedies, additives are frequently used. Most
of the reported preparations in the area are drawn
from a single plant; combinations are used in twelve
cases. In other parts of the country, the use of
mixtures of plant species in treating a particular
ailment is fairly common.7,8
Fig: 3. The different elements of study area grouped under different ailment categories
The present study revealed that the local traditional
healers of Khammam district, Andhra Pradesh are
rich in ethnomedicinal knowledge and the majority
of people rely on plant based remedies for common
health problems like headache, body ache,
constipation, indigestion, cold, fever, diarrhea,
dysentery, wounds, skin diseases, urinary troubles,
etc. The survey also revealed that all the traditional
healers have strong faith on ethno-medicines
although they were less conscious about the
documentation and preservation of ethno medicinal
folklore and medicinal plants. The group
discussion and personal interviews show that
youngsters of the Koya tribal community are less
aware about the use of ethnomedicines; our
findings are similar to reports from India [9]. On the
other hand, traditional healers who are the main
repository of ethno medicinal knowledge claim
extreme secrecy over their ethnomedicinal
knowledge. The traditional healers have strong
believe that if they disclose the secrecy about the
medicinal properties of particular plant all the
medicinal potentialities of the plant will be lost and
the remedy will not work properly.
The study concluded that the local and tribal
people of the Warangal district have very good
knowledge on the use of medicinal plants. But
such knowledge of medicinal plants is restricted to
a few persons in rural area. Therefore it is
necessary that suitability requirements are needed
in order to protect the traditional knowledge in a
particular area with reference to medicinal plant
utilization and it was found that traditional ethno-
45
Manjula et al.,
Int J M ed Res Healt h Sci.2013;2(1):40-46
medicine still persists among the tribal’s in
Thadvai Mandal, Warangal district.
ACKNOWLEDGEMENTS
The authors acknowledge the kindness and
cooperation of the informants and local
administrators in the study area, and the support of
the Department of Botany, Kakatiya University,
and Warangal for identification of the plant
species. My thanks also to tribal people in study
area.
8. Jain. SK. Dictionary of Indian Folk medicine
and Ethnobotany. Deep Publications, Paschim
Vihar, New Delhi. 1991.
9. Uniyal SK, Sharma S, Jamwal P. Folk
Medicinal Practices in Kangra District of
Himachal Pradesh, Western Himalaya. Human
Ecol. 2011;39:479-488.
REFERENCES
1. Sheldon JW., Balick MJ and Laird SA.
Medicinal Plants: Can utilization and
Conservation co-exist. New York Botanical
Garden Press Department, New York, 1997;
104.
2. Ganesan S, Suresh N and Kesavan L.
Ethnomedicinal Survey of Lower Palani Hills
of Tamilnadu, I.J. Trad. Knowledge, 2004;3
(3): 299-304.
3. Burmol KS and Naidu TS. National seminar on
“Tribal
medicinal
System
and
its
Contemporary Relevance. Forest flora of
Hyderabad state. 2007.
4. Samy RP, Ignacimuthu S, Raja DP.
Preliminary screening of ethnomedicinal plants
from India. J Ethnopharmacol. 1999;66:235240.
5. Census of India. Household Schedule - Side
Government of India. 2011.
6. Ravisankar T, Henry AN. Ethnobotany of
Adilabad
district
Andhra
Pradesh,
India.Ethnob.1992; 4:45-52.
7. Ayyanar, M; Ignacimuthu, S. Traditional
Knowledge of Kani tribals in Kouthalai of
Tirunelveli
hills, Tamil Nadu, India. J.
Ethnophar. 2005;102:246–255.
46
Manjula et al.,
Int J M ed Res Healt h Sci.2013;2(1):40-46
International Journal of Medical Research
&
Health Sciences
www.ijmrhs.com
Volume 2 Issue 1 Jan-Mar 2013
Coden: IJMRHS Copyright @2013 ISSN: 2319-5886
Received: 1st Dec 2012
Revised: 20th Dec 2012
Accepted: 23rd Dec 2012
Original research article
BENEFICIAL EFFECT OF LOW DOSE AMLODIPINE VS NIFEDIPINE ON SERUM
CHOLESTEROL PROFILE OF RABBITS RECEIVING STANDARD DIET.
*Bavane DS, Rajesh CS, Gurudatta Moharir, Bharatha Ambadasu
Department of Pharmacology, Shri. B. M. Patil Medical College & Research Centre, BLDE University
Bijapur- Karnataka
*Corresponding author e-mail: ajaybawane02@gmail.com
ABSTRACT
Objective: To investigate the effect of low dose amlodipine v/s nifedipine on serum cholesterol profile of
rabbits receiving standard diet. Methods: Fourty Newzealand rabbits were selected for the study. Their
cholesterol profile was estimated at the beginning of the study. Rabbits were grouped into 4 groups
receiving standard diet (control group), standard diet + vehicle propylene glycol, standard diet + nifedipine
dissolved in propylene glycol and standard diet + amlodipine dissolved in propylene glycol. Along with
standard diet they were treated with respective drugs for ten weeks. At the end of ten weeks serum
cholesterol profile was estimated. Results: The cholesterol profile was estimated at the beginning and at the
end of ten weeks. Total cholesterol in the amlodipine group decreased from 97±4.06 mg/dl to 90±4.2 mg/dl
and HDL-Cholesterol increased from 32.01±4.40 mg/dl to 37±4.60 mg/dl after 10 week treatment but these
changes were not significant. LDL cholesterol decreased significantly in rabbits with low dose of
amlodipine from 55.42±3.32 mg/dl to 32.40±3.22 mg/dl and. In the nifedipine group there was a slight
increase in total cholesterol from 102.49±5.16 mg/dl to 106±5.39 mg/dl, HDL cholesterol from 34.10±2.80
to 35.16±2.82 mg/dl and LDL cholesterol also increased from 56.20±2.20 mg/dl to 59.00±2.20 mg/dl after
10 week treatment. Conclusion: The study shows amlodipine produces favorable alterations in serum
cholesterol profile.
Key words: Cholesterol profile, Standard diet, Amlodipine, Nifedipine
INTRODUCTION
Hyperlipidaemia and hypertension are often two
co-existing risk factors for coronary artery disease.
Among different cholesterol high serum levels of
total cholesterol and low density lipoprotein
cholesterol favours coronary artery disease. A
report by the National cholesterol education
program11 has focused attention on the necessity
for managing lipid disorders. Serum cholesterol
plays a central role in the atherosclerotic process,
in particular, abnormal levels of total cholesterol
47
Bavane DS et al.,
Int J M ed Res Health Sci.2013;2(1):47-51
and low – density lipoprotein cholesterol. High
density lipoprotein particles function in the
opposite way from low density lipoprotein, they
act as a scavenger of free cholesterol and enhance
the rate of clearance of cholesterol from the
arteries.3 It has been reported in a large number of
animal and human experimental studies that
various classes of antihypertensive agents have
either adverse or significant, effect on plasma lipid
& lipoprotein levels.1,4,5 Beta-blockers without
partial intrinsic sympathomimetic activity increase
serum triglycerides and tend to lower high-density
lipoprotein cholesterol.9 Recently there has been an
epidemical increase in hypertensive cases resulting
in coronary artery disease and abnormal lipid
profile. Therefore we planned in this study to see
whether amlodipine versus nifedipine to test if this
drug having antihypertensive effect in human, has
any effect on serum cholesterol profile of rabbits
fed on standard diet.
MATERIALS AND METHOD
Fourty healthy male Newzealand rabbits weighing
between 2-3 Kg was selected and placed under
ideal conditions. Animals were maintained on the
routine standard feed and acclimatized for seven
days prior to start of the experiment. Nifedipine
(Pfizer Ltd): A solution of 5 mg/40ml in propylene
glycol prepared and administered orally in a dose
of 2ml/kg i.e. 0.25 mg/kg orally. Amlodipine
(Pfizer Ltd): A solution of 2.5mg/40 ml in
propylene glycol prepared and administered orally
in a dose of 2ml/kg i.e. 0.125 mg/kg orally.
Estimations of serum total cholesterol and serum
high and low density lipoprotein cholesterol were
done at the beginning of the study and after 10
weeks of administration of the study drugs.
Study design
The rabbits were divided into four groups
containing 10 rabbits each. The groups were
treated as follows:
Group I Standard diet (control group)
Group II Standard diet+ vehicle propylene glycol
2ml/kg/day
Group III Standard diet +Nifedipine
(0.25mg/kg/day)
Group IV Standard diet +Amlodipine
0.125mg/kg/day orally
A routine diet containing bread, milk and vegetable
on an average of 100gm/rabbit was given to the
rabbits during the study period with water given
ad-libitum. The animals were treated in this
manner for 10 weeks. For analysis of cholesterol
profile i.e. total cholesterol, HDL-cholesterol and
LDL-cholesterol 1ml blood samples were collected
from the marginal ear vein of rabbit after an
overnight fast at the beginning before starting the
drug administration and then after ten weeks of the
drug administration. Readings were taken on a
photo colorimeter. The data were analyzed using
students paired ‘t’ test for the same group and
students unpaired t test for between the groups.
Table: 1. Cholesterol profile in the rabbits baseline values (Pretreatment)
Sr.
No
Group
1.
2.
3.
4.
Group I
Group II
Group III
Group IV
Total Cholesterol (mg/dl) HDL-cholesterol (mg/dl) LDL-cholesterol (mg/dl)
95.00± 1.28
97.00± 1.28
102.49± 5.16
97.00± 4.06
32.16± 2.08
34.01± 3.20
34.10± 2.80
32.01± 4.40
56.55±3.72
54.20± 5.20
56.20± 2.20
55.42± 3.32*
48
Bavane DS et al.,
Int J M ed Res Healt h Sci.2013;2(1):47-51
Table: 2. Cholesterol profile in rabbits after 10 weeks of drug administration
Sr. Group
Total Cholesterol (mg/dl) HDL-cholesterol (mg/dl) LDL-cholesterol (mg/dl)
No
1. Group I
2. Group II
3. Group III
99.00± 1.28
100.00± 1.28
106.00± 5.19
31.02± 2.08
34.00± 3.20
35.16± 2.82
53.12± 3.72
55.00± 5.20
59.00± 2.20
4. Group IV
90.00± 4.06
37.00± 460.
32.40± 3.32*
The data were analyzed by paired ‘t’ test (p<0.001)*LDL-C is decreased significantly in group 4 treated with
amlodipine as compared to group 3 treated with nifedipine , control group1; 2 & pretreatment groups1, 2, 3 & 4.
RESULTS
The group 1 and 2 did not exhibit any significant
alteration in serum cholesterol profile. There was a
slight decrease in serum total cholesterol in the
group-4 treated with amlodipine than non treated
group 1, 2 & 4. But the mean serum total and
LDL-C levels of the group 4 treated with
amlodiine, rabbits were significantly reduced when
compared to group 3 at tenth weeks.Thus
amlodipine significantly prevented the rise of
LDL-C(p<o.oo1). There was a considerable rise in
HDL-C in group 4 rabbits receiving amlodipine.
The mean serum levels of HDL-C of group 3 & 4
rabbits
receiving
nifedipine & amlodipine
respectively increased marginally after 10 weeks
than basal groups.
DISCUSSION
Administration of amlodipine in group 4 resulted
in significant lowering of LDL-C after 10 weeks
when compared to group 3 rabbits receiving
nifedipine. Similar effects of nicardipine in
lowering LDL-C and elevating HDL-C has been
reported by Ohata et al12.
It is now well
recognized that coronary artery disease bears a
relationship through inter linkage between
hypertension and dyslipidemia. The treatment of
hypertension is found with potential difficulties,
including the altered efficiency of medications, the
increased risk of side effects and possibility for
derangement of serum lipid levels.
Serum
cholesterol plays a central role in the
atherosclerotic process, in particular, abnormal
Bavane DS et al.,
levels of total cholesterol, low density lipoprotein
cholesterol and high density lipoprotein cholesterol
have been found to be predictors of coronary heart
disease risk in hypertension. As the major transport
vehicles for cholesterol, low-density lipoprotein
particles essentially deposit cholesterol in the
lining of the arterial wall; low-density lipoprotein
cholesterol is often referred to as bad cholesterol.
High-density lipoprotein particles function in the
opposite way from low-density lipoprotein. They
act as a scavenger of free cholesterol and enhance
the rate of clearance of cholesterol from the
arteries. Serum high-density lipoprotein cholesterol
levels and subsequent development of coronary
artery disease in hypertension were also found to
be related, but in hypertension through the effects
of diet on plasma lipids.13 The inverse proportion
of the Framingham study.2 Dietary factors and
clinical events of coronary artery disease are linked
together with high For these reasons, high density
lipoprotein cholesterol is often referred to as good
cholesterol. Henry P.D in 19818 showed that
calcium channel blockers like nifedipine and
nicardipine reduce atherosclerotic lesions in
cholesterol fed rabbits without any significant
effect on serum lipids.It has been reported that
calcium channel blockers including nifedipine do
not adversely affect lipid profile7,14 Showed the
beneficial effect of low dose felodipine on serum
cholesterol of rabbits fed on atherogenic diet. The
cholesterol reducing effect of felodipine, when
administered early has not been explained
Int J M ed Res Healt h Sci.2013;2(1):47-51
satisfactorily. Increased uptake and degradation of
low density lipoprotein by skin fibroblasts, aortic
endothelial cells, smooth muscle cell, induction of
denovo synthesis of apoproteins and inhibition of
cholesterol synthesis and reduction of cholesterol
ester accumulation in smooth muscle cells are
thought to be the possible mechanisms. Many
studies have demonstrated that arterial compliance
is improved by antihypertensive drugs that induce
vasodilation in the large peripheral arteries, e.g.
calcium antagonists, angiotension converting
enzyme inhibitors and certain beta adrenoreceptor
blockers.
Amlodipine increased arterial
compliance and dilated the brachial artery at
prevailing and isobaric pressure. The active
increase in arterial compliance with amlodipine
was 26% of pretreatment values, while passive
pressure dependent was only 14%.10 It has been
shown experimentally that a reduced response of
the arterial smooth muscle to endothelial
vasodilators and an increased sensitivity to
vasoconstrictor agents may be involved in the
abnormal
arterial
reactivity
seem
in
hypercholesterolemia. The presence of calcium and
its role in plaque formation is not yet fully
elucidated.6 Over the past decade, investigators
have demonstrated that CCB like agents may
retard plaque formation. Recent studies in patients
with coronary artery disease have demonstrated
that nifedipine may impede or prevent the
development of atherosclerosis plaques in humans
as well.15
CONCLUSION
The present study shows that amlodipine plays a
favourable role in the alteration of serum
cholesterol profile. Further studies confirming
these findings may open up new avenues for this
novel group of drugs and pave way for their use in
many appropriate situations for prevention of
hypercholesterolemia.
REFERENCES
1. Johnson BF and Margaret A, Danylchuk. The
relevance of plasma lipid changes with
cardilovascular drug therapy. Medical Clinics
of North Americ.1989;73 (2):68
2. Castelli W.P. Anderson K: A population at risk
prevalence of high cholesterol levels in the
Framingham study Am. J. Medi 1980;80: 2332.
3. Dzaw VJ. Mechanism of interaction of
hypertension
hypercholesterolemia
in
atherogenesis. The effect of antihypertensive
agents Am. Heart jour. 1988; 17:25-29
4. Claude K, Lardinosis MD, Sherry LN. The
effects antihypertensive agents on serum
lipid
profile
Arch
Internal
Medi.1988;148:1280-88
5. Ferrari P, Romsson J, Weidnann P:
Antihypertesive agents, serum lipoproteins
glucose metabolism Am. J.Cardio. 1991, April
22; 67 (10); 26-35.
6. Gotto Jr HM. Calcium channel blockers and
prevention of atherosclerosis. Am. J.
Hypertension.1990; 3: 3465-68.
7. Henry D. Antiatherosclerotic property of
calcium channel blockers possible mechanism
of action. Cardiovascular Drugs Ther.1990;
4:1015-20
8. Henry PD., Bentley KL.: Suppression of
antherogensis in cholesterol fed rabbits treated
with nifedipine. J. Clin. Invest. 1981; 68:13069.
9. Jaju JB., Moholkar AL., Rahul AR. Lipid
profile in hypertension with special reference
to propranolol and atenolol. Indian medical
gazette-may 1998;32: (5): 132-34
10. Mehta JL. et al: Double blind evaluation of the
dose response relationship of amlodipine in
essential hypertension. Am. Heart J., 1993,125
(6): 1704-10
50
Bavane DS et al.,
Int J M ed Res Healt h Sci.2013;2(1):47-51
11. National cholesterol education program panel
on detection, evaluation and treatment of high
blood cholesterol in adults. Arc. Intern .Med.,
1988;148:36-69.
12. Ohata N, Nagano K. Low-Density lipoprotein
lowering and high-density lipoprotein elevating
effects of nicardipine in rats. Bichem.
Pharmacol., 1984;33:2199-205.
13. Shephered J, Cobbe SM, Ford et al: Prevention
of coronary heart disease with pravastatin in
men with hypercholesterolemia. N.Engl. Med.
1995; 33:1301-7
14. Swain TR, Das, Kanungo S, Patanaik J:
Beneficial effects of low dose felodipine on
serum cholesterol of rabbits fed on atherogenic
diet. Indian Journal of Pharmacology, 1996;
27:133-35
15. Vos JW. Retardation and arrest of progression
or regression of coronary artery disease, A
review
program,
Cardiovasac
Dis.
1991;35:435-54.
51
Bavane DS et al.,
Int J M ed Res Healt h Sci.2013;2(1):47-51
International Journal of Medical Research
&
Health Sciences
www.ijmrhs.com Volume 2 Issue 1 Jan-Mar 2013 Coden: IJMRHS Copyright @2013 ISSN:2319-5886
Received: 4th Nov 2012
Revised: 03rd Dec 2012
Accepted: 23rd Dec 2012
Original research article
A STUDY OF PULMONARY FUNCTION TEST IN WORKERS OF SUGAR FACTORY,
PRAVARANAGAR, MAHARASHTRA
Nitin S Nikhade 1, Panchsheel Sharma2
1
2
Assistant Professor, PDVVPF’s College of Physiotherapy, Ahmednagar
Assistant Professor, Dept. of PSM, Pravara Institute of Medical Sciences, Loni
ABSTRACT
Context: Repeated exposure to dusty environment in an industry causes airway diseases which may affect
pulmonary function over a period of time. Aims: 1) To study the pulmonary function test parameters in
workers of sub-departments in sugar factory 2) To find out the prevalence of Obstructive, Restrictive and
Mixed type of pulmonary impairment and their correlation with duration of exposure to occupational
environment. Study Design: An observational study was conducted on 294 permanent sugar factory
workers at Urban Health Centre, Pravaranagar. Materials and Method: The pulmonary function viz.
(FVC, FEV1, FEV1/FVC %, FEF25-75%) was recorded by a portable computerized RMS-Spirometer.
Spirometric studies were performed in various sub-departments in sugar factory including 60 matching
controls. To evaluate the effect of occupational exposure, the workers were divided into three categories i.e.
those exposed for 11-20 yrs, 21-30 yrs and ≥ 31yrs to the dust. Results: The overall prevalence of
pulmonary impairment was found to be 31.97%. The highest prevalence was found in Bagasse workers
(40.48%) followed by Manufacturing dept. (38.24%). Amongst the type of pulmonary impairment bronchial
obstruction was predominant (18.03%). FEV1/FVC was found significant in Bagasse workers and
Manufacturing dept. workers. Amongst the occupational exposure sub-groups, ≥ 31yrs exposed workers
were maximally affected by obstructive type (21.43%), Restrictive type (14.29%) & Mixed type (3.17%) of
pulmonary impairment. Conclusions: The study demonstrated a significant association between pulmonary
function abnormalities and certain sub-occupations in the sugar factory. The majority of the workers with
pulmonary impairment had ≥ 31yrs of occupational exposure.
Keywords: Pulmonary function test, Bagassosis, Pulmonary impairment, Spirometry
INTRODUCTION
Maharashtra is one of the largest sugar producers
state in India. Sugarcane processing involves many
workers in different sub-departments of sugar
factory1. “Bagassosis” is a respiratory disease
caused by inhalation of bagasse dust, which is
commonly described under the heading of
hypersensitivity pneumonitis2 and is also known as
a variant of farmers' lung 3,4. The organic dust
contains high concentrations of bioaerosols, such
as bacteria, actinomycetes, and fungi of plant and
animal origin. The concentration and pathogenicity
of these bioaerosols depend on source materials,
52
Nikhade et al.,
Int J Med Res Health Sci. 2012;2(1):52-58
method of their storage, technology of processing
materials and their disposal 5. One such organic
dust is Bagasse. Bagasse is a byproduct of sugar
cane crushing, size range from 0.5–3 microns are
called as respirable dust, to which sugar factory
workers are exposed by virtue of their occupation6,
7
. Vishwanathan et al8 and Nair and Das9 from
India in 1970 reported reduced FVC, TLC, PEFR,
and MVV in bagassosis patients. Since 1970 very
few pulmonary function studies were reported in
this field until recently in 2008 a study by Patil S
N10 from western Maharashtra reported decrease
in FVC, FEV1, PEFR and MVV in occupationally
exposed groups to bagasse as compared to non
exposed group. However, this study was conducted
during the operational period of a sugar factory.
Pandit T and Singh A et al8 identified 93 fungal
types from sugar factory which are responsible for
respiratory
symptoms
and
pulmonary
abnormalities in workers. They observed 40% of
the symptomatic workers reported improvement in
their symptoms when away from work. Hence, the
present study is conducted on workers during the
non-operational period of a sugar factory.
MATERIALS & MEHTODS
This observational study was carried out in
Padmshri Dr. Vitthalrao Vikhe Patil Sahkari
Sakhar Karkhana, Pravaranagar, internationally
renowned as the first in Asia, started on cooperative basis with the involvement of the local
farmers, during the period from August 2011 to
October 2011. The permission to carry out the
study was sought from the management of Sugar
factory, Pravaranagar and ethical clearance was
obtained from the institutional ethical committee of
Pravara Institute of Medical Sciences (Deemed
University) before the commencement of the
study. Informed consent was taken from each
subject in the study.
Selection of subjects
The study sample comprised of male permanent
workers employed in the sugar factory,
Pravaranagar. There were 349 permanent
employees, out of which 331 could be interviewed
and examined but only 294 were included in this
study. The smokers (37 in number) were not
included in this study to avoid bias while finding
pulmonary impairment purely based on
occupational exposure to dust. 18 permanent
workers could not be examined due to various
reasons but they did not differ much in age or
duration of service.
A control group of 60 non-smoking subjects
(office workers those who are unexposed to sugar
factory occupational environment) were selected,
having similar age group and socioeconomic status
of the sugar factory area.
Inclusion criteria: 1) Age of workers between 2060 years 2) Only male workers
Exclusion criteria : 1) Those have cardiovascular
illness in present or past 2) Those having
kyphoscoliosis deformity 3) Those predispose to
allergic asthma 4) Workers addicted to smoking.
As the subjects are industrial labour, there was a
habit of slight intake of alcohol and tobacco
chewing which does not affect or alter the
pulmonary function tests. This habit was present in
some workers of sub-departments as well as in
controls which nullifies the effect in this study.
Recording occupational and personal histories of
exposed workers
A complete history of the workers was recorded
with respect to duration of occupational exposure
and nature of occupation, respiratory symptoms,
smoking habits and socio-economic status on a
pre-structured proforma12.
Pulmonary Function Testing
The anthropometric measurement (standing height,
weight etc.) was recorded. The whole maneuver
was explained to the subject and they were
encouraged to practice this maneuver before doing
the pulmonary function test. The spirometric
functions were recorded in the sitting position
using an electronic computerized portable RMSSpirometer13 according to the guidelines
recommended by the American Thoracic Society
14
. Each individual performed spirometry thrice to
53
Nikhade et al.,
Int J Med Res Health Sci. 2012;2(1):52-58
produce the best result. All the pulmonary function
tests were carried out at a fixed time of the day i.e.
9:30 am to 12:30 pm. The RMS- Spirometer used
was precalibrated each day prior to use. The room
temperature was recorded between 34-36 0C during
the period of study.
Spirometric studies were performed in workers
engaged
in
Engineering
dept.
(N=96),
Manufacturing dept. (N=102), Bagasse workers
(N=42) and Godown workers (N=54).
The following respiratory parameters were studied:
1. Forced vital capacity (FVC)
2. Forced expiratory volume in 1 Sec (FEV1.0)
3. FEV1/FVC % ratio
4. Peak expiratory flow rate (PEFR)
5. FEF 25-75%
The criteria for pulmonary impairment were
defined on the basis of the American Thoracic
Society (ATS) guidelines 14. FEV1/FVC percent
values >85% predicted were considered normal
and values less than <85% indicated bronchial
obstruction. The pulmonary impairments were
classified as per Miller’s prediction quadrant 15.
RESULTS
Table: 1. Anthropometric measurements of workers in different departments of sugar factory
SUB-GROUPS (N)
AGE (Yrs)
HEIGHT (Cm)
WEIGHT (Kg)
Engineering dept. (N=96)
Manufacturing dept. (N=102)
Bagasse Workers (N=42)
Godown Workers (N=54)
Controls (N=60)
N = Total number of subjects.
48.98 ± 5.83
50.22 ± 5.22
50.15 ± 5.61
50.27 ± 5.96
50.04 ± 6.52
165.77 ± 6.50
62.32 ± 10.29
165.72 ± 6.77
63.91 ± 10.65
167.27 ± 6.82
65.60 ± 9.14
165.90 ± 6.73
63.16 ± 10.37
167.94 ± 6.40
65.82 ± 8.83
Values are means ± S.D.
By applying ‘Z’ test for difference between two mean values in Control & Study groups respectively; there
is no significant difference in age, height and weight of workers i.e. P>0.05
Table: 2. Mean values & standard deviation of pulmonary function test parameters in workers of
different departments in Sugar factory.
Sub-Groups
FVC
(N)
(L)
2.85±0.52٭
Engineering dept (N=96)
Manufacturing dept N=102) 2.98±0.58
3.01±0.45
Bagasse Workers (N=42)
2.94±0.47
Godown Workers (N=54)
3.04±0.48
Controls (N=60)
N = Total number of subjects in each dept.
FEV1
(L)
2.42±0.48٭
2.45±0.53٭
2.38±0.39٭
2.49±0.49
2.62±0.46
FEV1/FVC
PEFR
(%)
(L)
85.62±11.14
5.42±1.51٭
83.67±12.32 ٭5.41±1.71٭
82.56±13.71 ٭5.26±1.52٭
85.51±11.41
5.58±1.67
87.49±9.69
6.08±1.57
Values are means ± S.D.
FEF25-75%
(L)
2.99±0.98
2.98±0.97
2.92±0.85
3.06±1.04
3.09±0.94
By applying ‘Z’ test for difference between mean values of pulmonary function test parameters,
* ‘significant’ difference between two mean values in control & study group respectively. i.e. p<0.05
PFT values in sub-occupational group:
There is statistically significant difference found
with respect to mean values of FVC in workers of
engineering dept. as compared to controls. There
was significant reduction in FEV1 in Bagasse
workers, Manufacturing dept. and Engineering
dept. workers as compared to controls, indicated
the prevalence of obstructive type of pulmonary
impairment. (Table-2) The above findings of a
54
Nikhade et al.,
Int J Med Res Health Sci. 2012;2(1):52-58
reduced in Bagasse workers, Manufacturing dept.,
and engineering dept. workers, thereby showed the
maximum effect on peripheral airway obstruction.
reduction of FEV1 are further supported by a
reduction in their ratios FEV1/FVC which is found
to be significantly reduced in Bagasse workers and
Manufacturing dept. workers. The PEFR were
Table: 3. Pulmonary impairment in relation to occupational exposure in workers of different
departments in sugar factory.
Obstructive Restrictive Mixed
Total
Sub-groups (N)
n
%
N
%
n
%
N
%
14
14.58 11
11.46 2
2.08
27
Engineering Dept. (N=96)
22.55 13
12.75 3
2.94
39
Manufacturing Dept. (N=102) 23
11
26.19 4
9.52 2
4.76
17
Bagasse Workers (N=42)
5
9.26 6
11.11 0
0
11
Godown Workers (N=54)
53
18.03 34
11.56 7
2.38
94
Total Workers (294)
3
5
5
8.33 0
0
8
Controls (N=60)
N = Total number of subjects, n = Number of subjects with pulmonary impairment
% = Percent of subjects with pulmonary impairment
Pulmonary impairment in sub-occupational
groups:
The overall prevalence of pulmonary impairment
was (31.97%) compared to (13.33%) in controls.
The highest prevalence of pulmonary impairment
was found in Bagasse workers (40.48%) followed
by Manufacturing dept. (38.24%), Engineering
dept. (28.12%) and Godown workers (20.37%).
(Table-3) Among various sub-groups bronchial
obstruction (18.03%) was the predominant
pulmonary impairment than the restrictive
(11.56%) and the mixed type (2.38%). The
28.12
38.24
40.48
20.37
31.97
13.33
obstructive type of pulmonary impairment was
found highest in Bagasse workers (26.19%)
followed by Manufacturing dept. (22.55%) and
Engineering dept. (14.58%) as compared to
controls (5%).
In a restrictive type of pulmonary impairment the
prevalence is highest in Manufacturing dept.
(12.75%) followed by Engineering dept. (11.46%)
and Godown workers (11.11%) as compared to
controls (8.33%). Mixed type of pulmonary
impairment showed the least number of cases 7
(2.38%).
Table 4: Pulmonary impairment in relation to duration of occupational exposure
Duration of Exposure
Obstructive
Restrictive
Mixed
Total
n
n
n
n
%
%
%
8
13.79 5
8.62
0
0
13
11-20 Years (N=58)
18
16.36 11
10.00 3
2.73
32
21-30 Years (N=110)
27
21.43 18
14.29 4
3.17
49
≥ 30 Years (N=126)
Total Workers (294)
53
18.03 34
11.56 7
2.38
94
N = Total number of subjects, n = Number of subjects with pulmonary impairment
% = Percent of subjects with pulmonary impairment
%
22.41
29.09
38.89
31.97
55
Nikhade et al.,
Int J Med Res Health Sci. 2012;2(1):52-58
Pulmonary impairment according to duration
of occupational exposure:
The highest prevalence of pulmonary impairment
was found in ≥31 yrs exposed workers (38.89%)
Followed by 21-30 yrs exposed workers (29.09%)
and least in 11-20 yrs exposed workers (22.41%).
(Table-4) The obstructive type of pulmonary
impairment showed the maximum number of cases
53 (18.03%) followed by restrictive type 34
(11.56%) and mixed type 7 (2.38%).
Percentage of Subject s
25
20
15
Obst ruct ive
10
Rest rictive
5
M ixed
0
11-20 Years 21-30 Years
≥ 30 Years
Durat ion of Exposure
Fig:1. Pulmonary impairment in relation to duration of occupational exposure
DISCUSSION
Sugar processing industry involves different suboccupations, which are performed in distinct
processing units necessary in the manufacturing of
sugar. In view of the industrial health scenario in
the sugar factory, lung spirometric studies were
conducted on workers in various departments
namely engineering dept., Manufacturing dept.,
Bagasse workers and Godown workers.
In the present study, Significant reduction of
FEV1.0 in Bagasse workers, Manufacturing dept.
and Engineering dept. workers as compared with
controls, indicated obstructive type of pulmonary
abnormalities (Table-2). Reduced FEV1 has earlier
been reported by Bohadana et al16 showed that
workers exposed to sugar dust in the sugar cube
manufacture workstation had significantly lower
forced expiratory volume in 1s (FEV1) than the
non-exposed ones. Goyal R.C. et al17 also observed
the decrease in FEV1 in workers actively involved
in various plant operations of sugar factory. A
possible mechanism could be mobilization of
neutrophils into the airways and the subsequent
release of tissue irritating substances, either
Nikhade et al.,
directly from neutrophils via platelets or by
secretion of prostaglandins from macrophages18.
There is decreased diffusion capacity of the
alveolar capillary membrane due to the destruction
of alveoli caused by inflammatory responses
leading to decreased O2 saturation in the blood 19,20.
Hypoxia due to decreased O2 saturation leads to
release of leukotriens and chemokines from
eosinophils resulting in broncho-constriction 21.
Hypoxia along with associated hyperapnea gives
rise to decrease in PACO2, resulting in further
constriction of bronchial muscles22. The
lymphocytic infiltration caused by inflammatory
response may result in thickening of the walls of
the bronchioles resulting in obstruction of the
lumen by granulation tissue23.
In this study, the reduction of FEV1 is further
supported by a reduction in their ratios FEV1/FVC,
which is found to be significantly reduced in
Manufacturing dept. and Bagasse workers where
the exposure to organic dust is maximized. The
Peak Expiratory Flow Rate (PEFR) was reduced in
all the exposed workers in sub-occupational groups
Int J Med Res Health Sci. 2012;2(1):52-58
56
(Table-2) being higher in Bagasse workers
followed by Manufacturing dept., and Engineering
dept. workers, thereby showed the maximum effect
on peripheral airway obstruction. A highly
significant decrease in PEFR was also reported
from western Maharashtra by Patil S.N.10. PEFR is
an index of expiratory airway resistance and is
more effort dependent 24. The reduction in PEFR
may involve the same mechanism already
explained for obstructive lesion. In addition, the
inflammatory reaction releases proteins from
eosinophils which might be responsible for the
hyper responsiveness of airways 25.
All sub-groups of sugar factory workers suffered
with various profiles of obstructive (18.03%),
restrictive (11.56%) and mixed type (2.38%) of
pulmonary impairments totaling 31.97% Vs
13.33% in controls (Table-3). However, bronchial
obstruction was the predominant pulmonary
abnormality in sub-occupational groups, especially
Bagasse workers (26.19%) and Manufacturing
dept. workers (22.55%). A Spirometric study by
Gehad Abo et al 26 in workers chronically exposed
to bagasse during the manufacture of particleboards showed prevalence of Obstructive
ventilatory defects in about 28.5% of the studied
workers followed by Restrictive defects affecting
about 19.6% of the workers, while combined
defect affected about 6% of the studied group. The
results in the present study may be due to the
differential nature of occupational exposure e.g.
Bagasse workers and Manufacturing dept. workers
are coming in direct contact with the Bagasse and
fine sugar dust than the Engineering dept. and
godown workers.
There is an increasing number of cases in each
obstructive, restrictive and mixed type of
pulmonary impairment from 11-20 yrs exposed
worker category to ≥31 yrs exposed category,
which means there is a direct correlation between
the duration of exposure to dust and the pulmonary
abnormalities in sugar factory workers. There are
no systematic studies related to industrial dust
exposure and pulmonary hazards in key processing
units of sugar factory thereby, making it difficult
for comparison with the present data.
In conclusion, the study demonstrated a significant
association
between
pulmonary
function
abnormalities and certain occupations in the sugar
factory, thereby suggesting that occupational
exposure to Bagasse and certain chemicals used in
sugarcane processing lead to pulmonary
impairment particularly of the obstructive type
followed by restrictive and mixed type. The
majority of the workers with pulmonary
impairment had ≥ 31yrs of occupational exposure.
A direct correlation was observed between
duration of occupational exposure to the organic
dust (Bagasse) and increase in pulmonary
impairment in sugar factory workers.
ACKNOWLEDGEMENTS
We are grateful to Dr. Bhaskar Kharde
(Chairman) & Mr. Prakash Patil (Manager)
Pravaranagar sugar factory for their interest and
support for this work. We are also thankful to
medical and paramedical staff at urban health
centre, Pravaranagar for their constant support
and help
REFERENCES
1. Devendrakumar Amre & Durgawale PM. Sugar
Industry in Maharashtra. Ind J of Occup. &
Environ. Med. 1999;56(8):548-52
2. Hur T. and Cheng C. Hypersensitivity
pneumonitis: Bagassosis.1994;10 (10): 556-64.
3. Marinenko NV, Metliaev GN. Bagassosis: An
occupational disease of the lungs. 1979; (5):
39-41.
4. Anthony Seaton .Crofton and Douglas's
Respiratory Diseases. 2000, Vol. II, 5 th edition;
1002.
5. Ata GA, Ezzat HM. Shalaby AO. & Kholey BE.
Environmental mycological and respiratory
health assessment of workers chronically
exposed to bagasse in Egyptian particle board
industry”. Intern. Jr. of Environ. Health
Research.1998; 8(4):315-34
57
Nikhade et al.,
Int J Med Res Health Sci. 2012;2(1):52-58
6. Nicholson D.P. Bagasse worker's lung. Am Rev
Respir Diseas. 1968; 97(4): 546-60.
7. Sodeman & Pullen: Bagasse disease of the
lungs. Archives of Inter Med, 1944;73(5):365.
8. Viswanathan R, De Monte AJH, Shivpuri, DN&
Venkitasubramoni TA. Bagassossis- A study of
pulmonary function. Ind J. of Med. Res. 1963;
51: 563 – 693.
9. Nair KV and Das KV. Bagassosis. A case
report, Jr. Ass. Physc. India. 1970;18(6): 57375.
10. Patil SN, Somade PM, Joshi AG. Pulmonary
function tests in sugar factory workers of
Western Maharashtra (India)” J Basic Clin
Physiol Pharmacol. 2008; 19(2):159-66.
11. Miller GJ. and Hearn CED. Pulmonary function
at rest and during exercise following bagassosis.
British Journal of Industrial Medicine. 1971; 28:
152-158.
12. Kishor Jugal. Designing questionnaire for
occupational and environmental studies. Ind J
of Occup & Environ Med. 2000;4:183-90
13. RMS Medspiror, Recorders & Medicare
Systems,
Chandigarh,
India,
www.rmsindia.com
14. ATS (1995) Standardization of Spirometry:
1994 update. American Jour. of respiratory
and critical care med.152: 1107-136
15. Miller WF and Jhonson RL. Miller’s
prediction quadrant. Anesthesiology 1956;17:
480-93
16. Bohadana AB and Massin N. Airflow
obstruction in sugar refinery workers.
International Arch. of Occup. And Environ.
Health. 1996;68(4): 131-34
17. Goyal RC., Adiya AN., Jejurikar ND. and
Chavan UA. Study of health profile of
industrial workers at Pravaranagar comlex.
Ind. Jr. of Occup. Health. 1994; 36 (1): 11-13
18. Gokani VN, Rao NM, Ghosh SK. Panchal
GM, Bhatt HV, Parikh JR & Kashyap SK.
Bronchoconstriction in cotton dust exposed
workers – Role of bacterial endotoxins. Ind.
Jr. of Industrial Med. 1993; 39: 79-84
19. Buechner HA, Bhitz O and Thompson.
Bagassosis: A review with further historical
data, studies of pulmonary function and
results of adrenal steroid therapy. American
Journal of Medicine. 1958; 25:234.
20. Miller GJ. and Hearn CED. Pulmonary
function at rest and during exercise following
bagassosis. British Journal of Industrial
Medicine, 1971;28: 152-58.
21. Govan A. D. T.: Respiratory System, In:
Alasdair D. T. Govan, Peter S. Macfarlane,
Robin Callander, eds. Pathology illustrated, 4
edition, Singapore: ELBS with Churchill
Livingstone, Singapore Publishers Pvt Ltd
1994:342.
22. Ganong FW. Respiratory adjustments in
health and disease, In:Willium F Ganong,
Review of Medical Physiology. 22 editions,
Singapore: McGraw –Hill; 2005:688.
23. Vishwanath P. Kurup: Farmers lung and
related hypersensitivity pneuomonitis. Indian
Jour. Chest diseases Alli-Scie. 1984;26
(4):242-255.
24. Virendra Singh JN. Pande GC. Khilnani.
Tests for ventilatory function, In: PS.
Shankar, Pulmonary function tests in health
and disease, 1 edition. Indian College of
Physicians. 1998;39: 46-59.
25. Pandit T. and Singh AB. Prevalence of
airborne fungi in sugar factory environment.
Ind. Jr. of Aerobiology. 1992;5: 145-52
26. Gehad AA El Ata Environmental,
mycological
and
respiratory
health
assessment of workers chronically exposed to
bagasse in Egyptian particle-board industry.
International Jr. of Environ. Health Research.
1998, 8(4): 315-334
58
Nikhade et al.,
Int J Med Res Health Sci. 2012;2(1):52-58
International Journal of Medical Research
&
Health Sciences
www.ijmrhs.com Volume 2 Issue 1 Jan-Mar 2013 Coden: IJMRHS Copyright @2013 ISSN: 2319-5886
Received:2 nd Dec 2012
Revised:20th Dec 2012
Accepted: 22nd Dec 2012
Original research article
CLINICAL STUDY OF CAUSATIVE MICROBIAL AGENTS OF SUPPURATIVE KERATITIS
CASES IN RURAL AREA
*Suryawanshi Gaurav S, Khindria Ashish
Dept of Ophthalmology, Rural Medical College, Loni, Maharashtra
*Corresponding author email: thessentialg@gmail.com
ABSTRACT
The epidemiological pattern and causative agents for suppurative corneal ulcer vary significantly from
region to region so it is important to determine the regional etiology for diagnosis and management. A
prospective study was conducted to find out the specific microbial agents responsible for suppurative
keratitis. 62 patients of keratitis were included in the study. Male patients (58.06%) above 40 years
(69.35%), farmers (61.29%) by occupation were commonly involved. The commonest ulcer was fungal
(35.48%) &the causative microorganism found on culture was Aspergillus (48.48%). In bacterial ulcer,
Staphylococcus aureus (38.70%) &Pseudomonas (19.35%) were isolated as the responsible microbial
agents.
Keywords: Corneal ulcer, Fungal keratitis
INTRODUCTION
The cornea is the first and most powerful refracting
surface of the optical system of the eye. The
normal healthy cornea is avascular and devoid of
lymphatic channels. 1Corneal cells derive its
nourishment by diffusion from the aqueous,the
capillaries at the limbus and oxygen dissolved in
the tear film. The cornea is the most densely
innervated tissue in the body. The sensory supply
is via the fifth division of the trigeminal nerve.
Corneal ulcer is defined as a loss of corneal
epithelium with underlying stromal infiltration and
suppuration associated with signs of inflammation
with or without hypopyon. 2 Microbial keratitis in
a previously normal eye is suspected by the onset
of pain and the presence of ulceration,
mucopurulent.Exudates adherent to the ulcer
surface, focal stromal suppuration,diffuse cellular
infiltration in the adjacent stroma and iritis.3 The
epidemiological pattern and causative agent for
suppurative corneal ulcer varies significantly from
country to country and even from region to region
within the same country.It is important to
determine the “regional” etiology within the given
region for a comprehensive strategy for the
diagnosis and proper treatment of the corneal ulcer.
59
Gaurav SS et al.,
Int J M ed Res Health Sci. 2013;2(1):59-62
Several studies have addressed these questions in
the Indian subcontinent. 4,5
MATERIALS AND METHODS
A prospective study was carried out for the period
of two years at Department of Ophthalmology,
Pravara Rural Hospital. The study was approved
by the ethical committee of the Institute. Patients
presenting to the eye OPD with complaints of
ocular trauma by vegetative matter, pain, redness,
were evaluated for keratitis. 62 patients found to
have suppurative keratitis were included in this
study. Patients were included on the basis of
detailed ocular (torch light and slit lamp) and
systemic examination. Informed consent was
taken.
Examination of the smear
Scraping of ulcer margin was done by 15 no. blade
under topical anesthesia. The smear was fixed with
Gram stain and KOH wet preparation. The
scraping was done before starting any treatment.
Smears were made from the scraping of ulcer
margin using Bard-Parker blade no.15 and sent for
KOH wet preparation and Gram stain. For culture,
scrapped material was inoculated into blood agar
and Sabouraud dextrose agar (SDA).
The corneal scraping sample was transported to a
microbiological laboratory in sterile nutritious
broth and inoculated in blood agar, incubated at
37ºC for 24 hrs. Colonies obtained were described
by their colony characteristics and growth
sensitivity was done.
For fungal cultures, the materials were inoculated
onto Sabouraud’s dextrose agar (SDA) and
incubated at room temperature, examined daily,
and discarded after 2 weeks if there was no growth.
RESULTS
The age distribution of corneal ulcers varied from
8 years to 85 years in the study.Fungal keratitis
was the most commonly seen in 22 patients out of
62 accounting for 35.48%,followed by bacterial
keratitis in 32.25% case and mixed keratitis in
17.74%.Commonest fungal organism isolated in
our study was Aspergillus accounting for 48.48%,
followed by Fusariumat 30.30% and Candida in
21.21% of the patients. As for bacterial keratitis,
the microorganisms isolated shown that
Staphylococcus aureus was found to be the
commonest among Gram positive organisms
accounting for 38.70%, followed by Streptococcus
pneumonia (25.80%), Staphylococcus epidermidis
(6.45%) and Diphtheroids (3.22%). Among Gram
negative organisms Pseudomonas species were
found to be the commonest accounting for 19.35%,
followed by Enterobactor and Moraxellaspecies
both accounting for 3.22%.
Table 1: Diagnosis of corneal ulcer based on smear examination
Ulcer type
Fungal
Bacterial
Mixed
Sterile
Total
Male
16
7
8
5
36
Female
6
13
3
4
26
Total
22
20
11
9
62
Percentage
35.48%
32.25%
17.74%
14.53%
100%
Total
16
10
7
33
Percentage
48.48%
30.31%
21.21%
100%
Table 2: Fungal organisms isolated on culture
Organism isolated
Aspergillus species
Fusarium species
Candida species
Total
Male
12
7
5
24
Female
4
3
2
9
60
Gaurav SS et al.,
Int J M ed Res Healt h Sci. 2013;2(1):59-62
Table:3. Bacterial organisms isolated on culture (gram positive)
Organism
Staphylococcus aureus
Staphylococcus epidermidis
Streptococcus pneumoniae
Diphtheroid
Male
7
1
5
-
Female
5
1
3
1
Total
12
2
8
1
Percentage
38.70%
6.45%
25.80%
3.22%
Table:4. Bacterial organism isolated on culture (gram negative)
Organism
Pseudomonas
Enterobactor species
Moraxella species
Total
Male
2
0
0
15
Female
4
1
1
16
Fig:1. Central corneal ulcer with hypopyon
Total
6
1
1
31
Percentage
19.35%
3.22%
3.22%
100%
Fig:2. Corneal ulcer with flurescein stain
DISCUSSION
Special importance is given to corneal ulcer due to
the fact that they leave behind a permanent opacity
which interferes with visual acuity and if not
attended to, may cause complications that may lead
to the loss of an eye. 2
Basak et al found pure fungal growth at 42.5% ,
pure bacterial growth in 15.3%, mixed growth in
9.5% cases.6Bharathi et al in their study of 3183
patients found fungal growth at 34.4%, bacterial
growth at 32.77%, mixed growth in 2.39%.5
Chowdhary et al and Singh et al study of 485 cases
found fungal keratitis in 39%.7
Hertel et al in in their study of 50 cases, find that
Pneumococci was present in 66% cases.8 McNabb
et al on 25 cases found Pneumococci 64%,
Staphylococci 20%, Streptococci 4%, Diplococcus
4%.9 Final outcome of the cases after full course of
treatment shows that in 62.90 % of the cases with
keratitis developed either nebular to macular grade
of corneal opacity,followed by dense leucomatous
opacity in 33.87% of the cases and corneal
perforation was seen in only 3.22% of the
patients.This data was supported by Saha et al in
which 40.55% of the cases of keratitis healed with
corneal scar formation after a full course of
treatment.10
Scarring or perforation due to corneal ulcer is the
major cause of corneal blindness throughout the
61
Gaurav SS et al.,
Int J M ed Res Health Sci. 2013;2(1):59-62
world. Among the surveys in India, corneal
blindness is the third commonest cause of
blindness. 4,5 A delicate balance exists between the
cornea and its surrounding environment that helps
the cornea maintain its integrity in spite of
continuous exposure to foreign bodies and
pathogens. Corneal ulceration may result when the
balance is disrupted and the defense mechanisms
are compromised. The associated ocular morbidity
is the result of several factors and patient
management is directly affected by the lack of
diagnostic facilities and initiation of appropriate
antimicrobial therapy. Specific treatment requires
quick and accurate identity of the causative
microorganism.
5.
6.
7.
8.
9.
CONCLUSION
In view of several such dilemmas while dealing
with microbial keratitis, carrying out simple
microbiological investigations can make a
substantial difference to the accuracy of
management of corneal suppuration. Simple Gram
stain, KOH mount, culture and antimicrobial
sensitivity can make a big difference to the
ultimate outcome of treatment.
10.
fungal keratitis: A three-year study. Indian J
Ophthalmol. 2003;51; 315-21.
Basak SK, Basak S, Mohanta A, Bhowmick A.
Epidemiological and microbiological diagnosis
of suppurative keratitis in Gangetic West
Bengal, eastern India. Indian Journal
Ophthalmology 2005; 53:17-22
Chowdhury A, Singh K. Spectrum of fungal
keratitis in North India. Cornea 2005;24:8-15.
Hertel V. Graefes Arch. About suppurative
keratitis in humans. Ophthalmol.1901; 53 (2):
316-59.
McNabb: Trans. Diagnosis of suppurative
keratitis Ophthalmol. Soc. U.K. 1927; 47:57.
SumanSaha,
Debdulal
Banerjee,
ArchanaKhetan,
JayangshuSengupta.
“Epidemiological profile of fungal keratitis in
an urban population of West Bengal, India”,
Oman Journal of Ophthalmology: 2009, 2 (3):
114-18
Kanski J. Clinical Ophthalmology, A systemic
approach” by Butterworth Heinemann Elsevier,
: sixth edition, page : 205.
REFERENCES
1. Robert AM, William MH, Jr Adler. Physiology
of the eye, clinical application. Published by
C.V Mosby Company, St. Louis, Missouri.
Eighth edition, chapter 3, Pgno. 36
2. Shihota Ramanjit, Tandon Radhika. Parson’s
disease of the eye. Published by Elsevier, 19th
edition, chapter 15, Pgno 200.
3. Srinivasan M., Gonzales CA., George
C.,Cevallos V., MascarenhasJM,Ashok B, et al.
Epidemiology and an etiological diagnosis of
corneal ulceration in Madurai, south India. Br J
Ophthalmol. 1997;8: 965-71.
4. Bharathi MJ, Ramakrishnan R, Vasu S,
Meenakshi R, Palaniappan R. Epidemiological
Characteristics and laboratory diagnosis of
62
Gaurav SS et al.,
Int J M ed Res Healt h Sci. 2013;2(1):59-62
International Journal of Medical Research
&
Health Sciences
www.ijmrhs.com Volume 2 Issue 1 Jan-Mar 2013 Coden: IJMRHS Copyright @2013 ISSN: 2319-5886
Received: 15 th Nov 2012
Revised: 13th Dec 2012
Accepted: 16th Dec 2012
Original research article
COST ANALYSIS STUDY OF ORAL ANTIDIABETIC DRUGS AVAILABLE IN INDIAN
MARKET
*Nisharani B Jadhav1, Manisha S Bhosale2, Charles V Adhav2
1
Department of pharmacology, B. L. D. E. U.’s S B M Patil Medical College, Bijapur, Karnataka, India.
Department of Pharmacology, Topiwala National Medical College and B. Y. L. Nair Charitable Hospital,
Mumbai-Central, Mumbai, Maharashtra, India. 400008
2
*corresponding author email: drnishajadhav@gmail.com
ABSTRACT
Introduction: There exists a wide range of variation in the prices of drugs marketed in India and other
countries of the world. Very few studies have been conducted to reveal such price variations in the open
market. Aim & Objectives: To evaluate the cost of oral anti-diabetics of different generic classes and
different brand names of one compound, To evaluate the difference in cost of different brands for the
same active drug by calculating percentage variation of cost. Methods: Cost of a particular drug being
manufactured by different companies, in the same strength, number and dosage form was compared. The
difference in the maximum and minimum price of the same drug manufactured by different
pharmaceutical companies and the percentage variation in price was calculated. Results: In Single drug
therapy, among sulfonylurea group of drugs, Glimepiride (1 mg) shows maximum price variation of
655.38%, while Glipizide (10mg) shows variation of 38.88%. In Biguanides & Thizolidinediones groups
of drugs, Metformin (500 mg) & Pioglitazone (15 mg) show maximum price variation of 308.33% &
542% respectively. In α-glucosidases inhibitor group of drugs, Miglitol shows maximum price variation
of 135.50 %. In combination therapies, Glipizide & Metformin combination shows the maximum
variation up to 399.04 %. Conclusion: The average percentage price variation of different brands of the
same drug manufactured in India is very wide and the appraisal and management of marketing drugs
should be directed toward maximizing the benefits of therapy and minimizing negative personal and
economic consequences.
Keywords: Cost analysis, anti-diabetic drugs, brands, price evaluation
INTRODUCTION
In the developing countries the cost of drugs is a
major concern to both physician and patient; yet
there are few data on prescribing patterns and
expenditure1. Cost of drugs is an important factor
influencing compliance with treatment2. In the
context of pharmaceutical and other health
63
Nisharani et al.,
Int J Med Res Health Sci. 2013;2(1): 63-69
products, differential pricing (also called tiered
pricing) is the adaptation of product prices to the
purchasing power of consumers in different
geographical or socioeconomic segments.
Differential pricing could potentially be a very
effective strategy to improve access to essential
medicines in low and middle-income countries
where most patients pay for medicines out-ofpocket and therefore cannot afford the prices
compared to high income markets. 3
Diabetes is the most common non communicable
disease worldwide. The International Diabetes
Federation (IDF) estimates the total number of
diabetic subjects to be around 40.9 million in
India and this is further set to rise to 69.9 million
by the year 2025.4,5 Diabetes is a chronic disorder.
It requires lifelong treatment. So the cost of
antidiabetic drug is the major deciding factor for
the patients’ compliance. Selection of oral
antihyperglycaemic agents as first-line drug or
combined therapy should be based on both the
pharmacological properties of the compounds
(efficacy and safety profile) and the clinical
characteristics of the patient (stage of disease,
body weight, etc.) 6. There exists a wide range of
variation in the prices of drugs marketed in India
and other countries of the world.
In the Indian market various antidiabetic drugs of
various brands are available. This creates a lot
problem with physician to decide the drug of
choice for individual patients. Also in the
literature very less studies are available which
compare the cost of drugs of different brands.
Regarding oral hypoglycemic agents, with the
best of our knowledge no study is available which
compares the cost of drugs of different brands.
So, we decided to carry out the study which
compares prices of different oral anti-diabetic
drugs.
Aim: To evaluate the cost of oral anti-diabetics of
different brand names of one compound and the
difference in cost of different brands of the same
active drug by calculating percentage variation of
cost.
Nisharani et al.,
Objectives This Pharmacoeconomic study is
designed with the main objectives of,
1. To find different anti-diabetics available either
singly or in combination and the No. of the
brands available for each.
2. To evaluate the cost of oral anti-diabetics of
different generic classes and different brand
names of one compound.
3. To evaluate the difference in cost of different
brands of the same active drug by calculating
percentage variation of cost.
MATERIALS AND METHODS
CIMS (current index of medical stores) & IDR
(Indian drug review) [2011 issues] were reviewed
for the prices of drugs used in the management of
diabetes mellitus.
1. The retail cost of a particular drug being
manufactured by different companies, in the
same strength, number and dosage form was
compared.
2. The difference in the maximum and minimum
price of the same drug manufactured by
different pharmaceutical companies was
calculated.
3. The percentage variation in price was
calculated.
4. The drugs being manufactured by only one
company or being manufactured by different
companies however, in different strengths
were excluded.
The percentage variation in price was calculated
using the following formula 2
=
−
100
The drugs were classified into five categories
depending on the percentage (%) range of price
variation. These were as follows
1) 0-25% 2) 25.1-50%, 3) 50.1-75%, 4) 75.1100% and 5) more than 100% Findings of our
observational study were expressed as
absolute numbers as well as percentage.
64
Int J Med Res Health Sci. 2013;2(1): 63-69
RESULTS
The prices on a total of 20 drugs (11 single and 9
combination preparations), available in 54
different formulations were analyzed. These 54
formulations are manufactured by different
pharmaceutical companies.
Single drug therapy: In single drug therapy,
Table 1 shows the price variation between a
sulfonylurea group of drugs. In this group,
Glimepiride (1 mg) shows maximum price
variation of 655.38%, while Glipizide (10mg)
shows variation of 38.88%.
Table 2 shows price variation in Biguanides
(Metformin) & Thizolidinediones (Pioglitazones)
groups of drugs. In these groups, Metformin (500
mg) & Pioglitazone (15 mg) show maximum price
variation of 308.33% & 542% respectively. Table
3 shows the price variation between αglucosidases inhibitor group of drugs. In this
group, Miglitol shows maximum price variation
of 135.50 %. Table 4 shows the price variation
between Meglitinides group of drugs. In this
group, Rapaglinide (0.5 mg) shows maximum
price variation of 90.95 %
Combination therapy:In Combination therapy,
total 7 combination therapies were analysed. In
this, Glipizide & Metformin combination shows
the maximum variation up to 399.04 %. Table V
shows price variation in combination drug therapy
Table:1. The price varies between a sulfonylurea group of drugs.
Drug
Formulations
Doses
(mg)
Manufacturing
companies
Min.
Price (Rs)
Max. Price
(Rs)
% price
variation
Glibenclamide
2
Gliclazide
4
Glimepiride
4
Glipizide
3
2.5
5
30
40
60
80
1
2
3
4
2.5
5
10
8
9
12
17
10
39
53
53
12
20
6
14
5
2.6
3.6
19
14
35
19.5
8.36
12.54
45
18.8
2.93
4.74
18
6.05
9.15
64.9
27.5
99.6
70.5
63.15
117.4
125
103.4
9.35
13.03
25
132.69
154.16
241.57
96.43
184.57
261.54
655.38
836.2
177.7
450
219.11
174.89
38.88
Table no. II: Price variation in Biguanides & Thizolidinediones groups of drugs.
Drug
Formulations
Doses
(mg)
Manufacturing
companies
Min. Price
(Rs)
Max. Price
(Rs)
% price
variation
Metformin
4
Pioglitazone
2
250
500
850
1000
15
30
7
48
18
34
40
40
4.6
6
10
14
10
18
9
24.50
36
41.4
64.20
98.20
95.65
308.33
260
195.71
542
445.55
65
Nisharani et al.,
Int J Med Res Health Sci. 2013;2(1): 63-69
Table:3. Price variation among α-glucosidases inhibitor group of drugs.
Drug
Formulations
Acarbose
2
Miglitol
2
Voglibose
2
Doses
(mg)
Manufacturing
companies
Min. Price
(Rs)
Max. Price
(Rs)
% price
variation
25
50
25
50
0.2
0.3
11
9
8
14
12
9
32
62
50
50.3
36
54
55
89
65.82
118.47
64
84
71.87
43.55
31.64
135.50
78.05
56.74
Table:4. Price varies between Meglitinides group of drugs
Drug
Nateglinide
Repaglinide
Formulations
Doses
(mg)
Manufacturing
companies
Min. Price
(Rs)
Max. Price
(Rs)
% price
variation
2
60
120
0.5
1
2
4
4
6
4
4
30
50
19.90
39
75
45
70
38
62
98
50
40
90.95
58.97
30.66
Max. price
(Rs)
19
26
29.9
78.25
68.50
29
60
59
69
120.4
41.75
60
73
14
26.25
59.3
70
80
70.6
86
80
128
% price
variation
133.33
62.50
149.16
332.32
74.52
2.47
71.43
84.37
283.33
362.07
9.86
15.83
12.3
108.33
399.04
246.78
67.06
15.94
271.57
165.43
81.81
137.03
3
Table: 5. Price varies among combination therapy
Drugs
Formulation
Glibenclamide
+ Metformin
3
Glicazide
+ Metformin
5
Glimepiride +
Metformin
5
Glipizide +
Metformin
Pioglitazone +
Glimepiride
2
Pioglitazone +
Metformin
Pioglitazone +
Metformin +
Glimepiride
2
3
2
Doses
(mg)
2.5 + 400
2.5 + 500
5 + 500
80 + 500
60 + 500
40 + 400
40 + 500
30 + 500
1+ 500
2 + 500
1 + 1000
2 + 1000
2 + 850
5 + 500
2.5 + 400
15 + 1
15 + 2
30 + 2
15 + 500
30 + 500
15 + 500 +1
15 + 500 +2
Manufacturin
g companies
8
2
19
43
5
3
3
3
50
53
2
4
2
11
3
12
15
2
34
21
12
15
Min. price
(Rs)
8.15
16
12
18.10
39.25
28.3
35
32
18
26
38
51.8
65
6.72
5.36
17.1
41.9
69
19
32.40
44
54
66
Nisharani et al.,
Int J Med Res Health Sci. 2013;2(1): 63-69
Relationship between percent price variation & no. of Manufacturing Companies:
When we draw a graph showing relationship between manufacturing companies and % price variation, it
was noted that there is a linear relationship in between these two variables. As the no. of manufacturing
companies increases, the percent price variation also increases. (As shown in figure no. 1)
No.of manufact uring companies
80
70
60
50
40
30
20
10
0
0 - 20
20-40
% price variation
40-60
60-80
Figure 1: Graph showing relationship between percent variation & No. of manufacturing
companies.
DISCUSSION
The Indian market has over 100,000 formulations
and there is no system of registration of
medicines2. The drugs are mainly sold under
brand names7.
A study in the United States found drug prices to
be high and that price discrimination occurred
across the industry7. But very less studies are
available in our scenarios which compare the cost
of drugs of different brands. Therefore we decided
to carry out the study which compares the cost of
different brands of drug of most common
disorder.
The drug prices available in CIIMS & IDR were
compared, as they are readily available source of
drug information and are updated regularly. Drugs
used in the management of diabetes mellitus were
selected as it is one of the major causes of
morbidity and mortality & the treatment requires
continuous prescription drug use.
It is observed from our results that there is a wide
(up to 836.20%) variation in prices of drugs
manufactured by different pharmaceutical
companies. The reasons for this price variation
could be as follows8-14:
1. The existing market structure of the
pharmaceutical industry
2. Asymmetry of information or imperfect
information
3. Industry costs
4. Government regulations and pricing policies
From our study it is also clear that, price variation
was directly related to the number of companies
manufacturing a particular drug. So it can be
concluded that the price variation increases
because of the increase in competition among the
manufacturing companies.
Pharmacists do not dispense the same brand as
prescribed by the doctor and try to substitute it
67
Nisharani et al.,
Int J Med Res Health Sci. 2013;2(1): 63-69
with other alternatives, quoting the reason of non
availability. This is often done with vested interest
for economic gains as some brands have a higher
profit margin.
It is felt that physicians could provide better
services and reduce costs of drugs if information
about drug prices was readily available. Studies
have shown that providing a manual of
comparative drug prices annotated with
prescribing advice to physicians reduced their
patients’ drug expense15.
Due to the long term treatment duration, diabetes
patients usually have higher than average monthly
out-of-pocket expenses and high out-of-pocket
expenses can be a barrier to adherence to
prescription drug regimens. Many chronically ill
adults cut back on medications due to high
prescription cost. Inadequate prescription
coverage and out of pocket expenses is one of the
strongest predictors of their medication adherence
problems.
Market structure and subsequent market
segmentation provide a basis for prescription
agent pricing policies leading to wide variation in
prices of drugs. In the absence of information on
comparative drug prices and quality, it is difficult
for doctors to prescribe the most economical
prescription.
There is a need for concerted action from
regulatory authorities, doctors, pharmacists and
general public at large to address this issue of oral
antidiabetic drugs price variation. At the hospital
level authorities and concerned committees have
to frame policies on these aspects. The situation
can be improved by incorporating an analysis of
prescription costs in the medical curriculum and
by providing updated and complete information
regarding bioequivalence, quality and cost of the
pharmaceutical preparation to the doctors.
Wherever possible a cheaper brand should be
prescribed because the superiority of any
particular brand over the others has never been
proved scientifically. Currently, very few
medicines are under drug prices control
Nisharani et al.,
order16. Hence it is desired that the Government
should bring all lifesaving and essential medicines
under price control.
CONCLUSION
The average percentage price variation of
different brands of the same drug manufactured in
India is very wide. So it is recommended that the
appraisal and management of marketing drugs
should be directed toward maximizing the
benefits of therapy and minimizing negative
personal and economic consequences.
REFERENCES
1. Kuruvilla A, George K, Rajaratnam A, John
2.
3.
4.
5.
6.
7.
8.
KR. Prescription patterns and cost analysis of
drugs in a base hospital in south India. Natl
Med J India. 1994 Jul-Aug; 7 (4): 167-68
Ravi Shankar P, Subish P, Bhandari RB,
Mishra P, Saha AC. Ambiguous pricing of
topical dermatological products: A survey of
brands from two South Asian countries.
Journal
of
Pakistan
Assoctn.
of
Dermatologists 2006; 16: 134-40
World Health Organization. Introduction to
drug utilization research. Oslo: 2003
Mohan V, Sandeep S, DeepaR, Shah B,
Varghese . Epidemiology of type 2 diabetes:
Indian scenario. Indian J Med Res. 2007;125:
217-30
Sicree R, Shaw J, Zimmet P. Diabetes and
impaired glucose tolerance. In: Gan D, editor.
Diabetes Atlas. International Diabetes
Federation. 3rd ed. Belgium: International
Diabetes Federation; 2006: 15-103
Scheen J, Lefebvre P.J. Oral Antidiabetic
Agents: A Guide to Selection : Drugs.1998;
55 ( 2): 225-36
Monaghan MJ, Monaghan MS. Do market
components account for higher US
prescription prices? Ann Pharmacother. 1996;
30: 1489-94
Sarkar P K. A rational drug policy. Indian J
Med Ethics 2004; 12; 30-35
Int J Med Res Health Sci. 2013;2(1): 63-69
68
9. Roy V, Rewari S. Ambiguous drug pricing: a
physician’s dilemma. Indian J Pharmacol
1998; 30: 404-07.
10. Wertheimer AI, Grumer SK. Overview of
international pharmacy pricing. Pharmacoeco
1992; 2: 449-55.
11. Berki SE, Richards JW, Weeks HA. The
mysteries of prescription pricing in retail
pharmacies. Med Care 1977; 15: 241-50.
12. Rataboli P, A Dang. Antimicrobial price
variation: Conundrum of medical profession.
JPGM. 2007;53 (1): 72-74
13. Das SC, Mandal M, Mandal SC. A critical
study on availability and price variation
between differ rent brands: Impact on access
to
medicines.
Indian
Journal
of
pharmaceutical sciences; 2007; 69 (1): 160-63
14. Sushma Dawadi, Rao BS, Khan GM. Pattern
of Antimicrobial Prescription and its Cost
Analysis in respiratory tract infection.
Kathmandu University Journal of Science,
Engineering and Technology. 2005:;1(1):1-9
15. Frazier LM, Brown JJ, Divine GW. Can
physician education lower the cost of
prescription drugs? A prospective Controlled
trial. Ann Intern Med. 1991; 115: 116-21.
16. Misra B, Jain SK, Mehta Y. A study on
availability and prices of medicines in India.
National Pharmaceutical Pricing Authority,
2002.
Available
from:
http://nppaindia.nic.in/index1.html.
69
Nisharani et al.,
Int J Med Res Health Sci. 2013;2(1): 63-69
International Journal of Medical Research
&
Health Sciences
www.ijmrhs.com Volume 2 Issue 1Jan-Mar 2013 Coden: IJMRHS Copyright @2013 ISSN: 2319-5886
Received: 5th Dec 2012
Revised: 25th Dec 2012
Accepted: 29th Dec 2012
Original research article
A STUDY OF ANTI-HYPERLIPIDEMIA, HYPOLIPEDIMIC AND ANTI-ATHEROGENIC
ACTIVITY OF FRUIT OF EMBLICA OFFICINALIS (AMLA) IN HIGH FAT FED ALBINO
RATS
*Jeevangi Santoshkumar1, Manjunath S2, Sakhare Pranavkumar M3
1
Associate Professor, 3Post Graduate Student Department of Pharmacology, M.R Medical College,
Gulbarga, Karnataka, India.
2
Professor, Department of Pharmacology, S. Nijalingappa Medical College, Bagalkot, Karnataka, India.
*Corresponding author email: drsantoshkumar.2007@rediffmail.com
ABSTRACT
Background: Emblica Officinalis (Amla), belonging to the genus, Phyllanthus emblica is widely used for
medicinal purpose. Its fruits have been used traditionally as a hypolipidemic. Objectives: The present
study was aimed to evaluate hypolipedimic and anti-atherogenic activity of fruit of Emblica officinalis in
high fat fed albino rats. Materials and Methods: For study of anti-hyperlipidemic, hypolipidemic, and
anti-atherogenic activity. 5 groups of 6 animals in each received normal saline, E. Officinalis powder, high
fat diet, High fat diet plus E. Officinalis powder both and Atorvastatin respectively for 8 weeks.
Hyperlipidemia was induced by feeding animals with high fat diet per orally, consisting of coconut oil and
vanaspati ghee, daily ad libitum. At the end of the study, blood samples of the animals were sent for the
estimation of the lipid profile and effects of test drug studied by comparing levels of Total Cholesterol,
Triglycerides, HDL, LDL, and Atherogenic index. The statistical significance between groups was
analysed by using one way ANOVA, followed by Dunnet’s multiple comparison test. Results: Fruit of
Amla showed significant anti-hyperlipidemic, hypolipidemic, and anti-atherogenic effect. All these effects
may contribute to its anti-atherogenic activity. Conclusion: Present study revealed the antihyperlipidemic, hypolipidemic, and anti-atherogenic effect of Amla fruit powder and can be safely used in
the treatment of mild to moderate cases of hyperlipidemia considering its easy availability, cost
effectiveness, and other beneficial effects.
Key Words: Emblica Officinalis, Hypolipidemic, Anti-Atherogenic, Atorvastatin, Atherogenic Index.
INTRODUCTION
Hyperlipidemia is one of the major culprits for
various cardiovascular and central nervous system
disorders. Both genetic disorders and diet
enriched with saturated fats and cholesterol,
70
Sant oshkumar et al.,
Int J M ed Res Health Sci. 2013;2(1):70-77
contribute to the elevated lipid levels in our
population as well as in many other developed
countries around the world 1.
Atherosclerosis is an age related disease. It is
widely prevalent in industrialized countries,
affecting primarily the intima of large and
medium sized arteries and is characterized by
fibrous-fatty plaques or atheroma 2. The cause of
atherosclerosis is not known, although several risk
factors have been involved in the pathogenesis of
atherosclerosis. Current experimental and
epidemiological evidence suggests a strong
relationship between atherosclerosis and elevated
levels of plasma lipids. Recent work
also
incriminated folic acid deficiency leading to
elevated plasma levels of homocysteine and
chronic infection with chlamydia pneumonia in
the pathogenesis 3. Atherosclerosis, which was
earlier thought to be always associated with hyper
cholesterolemia, has now been proved as an
inflammatory disease 4.
Over the last few years the changes in the
lifestyle, particularly the westernization of the diet
and a relatively sedentary lifestyle have led to an
increased frequency of lifestyle related disorders
such as hyperlipidemia, diabetes mellitus, and
atherosclerosis 5. The principle metabolic causes
of atherosclerosis include hyperlipidemia,
hypertension, obesity, insulin resistance, and
diabetes mellitus 6. Risk factors for the above are
the following, Smoking, hypertension, serum
cholesterol, genetic factors, physical activity,
hormones, alcohol, thyroid disease, renal disease,
and liver disease 7.
The current National Cholesterol Education
Program (NCEP) for the management of patients
with lipid disorder is of 2 types. One is population
based approach, which is intended to lower blood
cholesterol by dietary recommendations such as
reduced total calories from fats to less than
305kCal and from saturated fats to less than 10%,
consumption of less than 300mg of cholesterol per
day and maintenance of desirable body weight.
The second is a patient based approach described
in the report 2001 report of NCEP.
Adult treatment panel-III (ATP-III) which
continues to focus on lowering LDL-C levels as
the primary goal of the therapy 8. The ATP-III
report recognizes four classes of drugs that may
be used to achieve lipid goals. These include
HMG-CoA reductase inhibitors (Statins), Bile
Acid sequestrants, Niacin, and Fibric acid
derivatives 9.
The history of natural products is as old as
mankind. The importance of traditional systems of
medicine and of certain traditional medical
practices has now been recognized all over the
world. Today, it is required to have an intelligent
and pragmatic approach to evaluate selective
drugs of herbal origin. Therefore, it should really
matter for Pharmacologists to obtain information
from traditional healers, about their remedies and
to extract the active principles for development
into drugs 10.
E. Officinalis or Phyllanthus emblica (Syn: Amla,
Indian Gooseberry) is an evergreen tree which is
highly prized in tropical Asia. The genus is
natural to tropical Southeast Asia, particularly in
Central and South India. It is commonly
cultivated in gardens throughout India and grown
commercially as a medicinal fruit 11. It is among
the most important medicinal plants in the
Ayurveda Materia Medica and widely used in
Indian medicines for the treatment of various
ailments 12.
Apart from traditional uses, there are several
reports in the pharmacological actions of Amla
based on modern scientific investigations,
13
especially
anti-inflammatory
action
,
14
15
antimicrobial action , anti-oxidant action , anticarcinogenic action 16, anti-ulcerogenic action 17,
anti-diabetic action 18, analgesic action 19, and
hepato protective action 20.
The credit for initiating studies related to herbal
extracts in our country goes to Sir Ram Nath
Chopra and his team of dedicated workers, in
Calcutta School of Tropical Medicine 21.
71
Sant oshkumar et al.,
Int J M ed Res Healt h Sci. 2013;2(1):70-77
Keeping in view of the above ideas, the present
study has been undertaken to evaluate the effect
of E.officinalis powder on the serum lipids level,
in albino rats fed with high fat diet comparing
with standard hypolipidemic drug Atorvastatin.
MATERIALS AND METHODS
The experimental protocol was approved by the
Institutional Ethics Committee and Animal Ethics
Committee of M.R Medical College, Gulbarga.
The study was carried out in 30 healthy albino rats
of Wister strain (Rattus norvegicus) weighing
150-200g either sex. Animals were maintained on
a standard animal diet consisting of Bengal gram,
Wheat, Maize, and Carrot in sufficient quantity
for the entire period (8 weeks) of the study and
Water adlibitum.
Drugs used in the study:
1. Emblica officinalis: The powder obtained
from Phytopharma Ayurvedic firm from
Kolhapur, Maharashtra. The dose in humans is
6g/day, which is equivalent to 540mg/kg in
rats 22.
2. Atorvastatin: Atorvastatin powder was
obtained from Biocon Pharmaceuticals,
Bengaluru. Human dosages 80mg, which is
7.2mg/kg in rats 22.
3. High Fat Diet: Mixture of Coconut Oil (from
Marico Industries Ltd., Mumbai) and
Vanaspati Ghee procured from Ruchi
Industries, Mumbai.
4. Vehicle: Gum Acacia: 4%, 2ml/kg procured
from Nice chemicals, Kochi
Preparation of High Fat Diet for inducing
Hyperlipidemia:
Edible Coconut oil and Vanaspati ghee mixed
together in the ratio of 2:3 v/v as per the method
of Shymala MP et al 23, at a dose of 10ml/kg body
weight, was fed to the animals per oral daily in
addition to a normal diet for 8 weeks.
Study Design
For the study, the animals were weighed,
recorded, numbered, and randomly divided into 5
Sant oshkumar et al.,
groups of 6 animals each for a period of 8 weeks
according to CPCSEA (Committee for the
purpose of control and supervision of experiments
on animals) for laboratory animal facilities 24, 25.
Grouping and Treatment Schedules
Group 1: Normal Saline
Group 2: E. officinalis powder 540mg/kg/day
along with normal diet.
Group 3: High Fat Diet (10ml/kg/day)
Group 4: High fat diet (10ml/kg/day) + E.
officinalis powder (540mg/kg/day)
Group 5: High fat diet (10ml/kg/day) +
Atorvastatin (7.2mg/kg/day)
All the animals used for the study were kept under
observation for daily food intake. The drugs were
administered to the animals for 8 weeks by an
intra-gastric feeding tube. At the end of 8th week,
all the group of animals was kept for overnight
fasting, After overnight fasting 2ml of blood was
collected from the orbital sinus with the help of a
capillary tube by pressing the thumb behind the
angle of the jaw resulting in the engorgement of
retro-orbital plexus 26 . The blood was centrifuged;
serum was collected and used for assessing the
various biochemical parameters of the lipid
profile.
Biochemical Estimation
Biochemical parameters were estimated in the
Biochemistry Laboratory of Basaveshwara
Teaching and General Hospital, attached to M. R.
Medical College, Gulbarga.
The following parameters of Lipid Profile were
measured:
1. Total Serum Cholesterol- It was estimated by
using Erba Kit 27 manufactured by Transasia
Bio-Medicals Ltd.
2. Serum Triglyceride- It was estimated by using
a kit manufactured by AGAPPE Diagnostics
28
.
3. High Density Lipoprotein Cholesterol (HDL) It was estimated by using Erba Kit 27
manufactured by Transasia Bio-Medicals Ltd.
72
Int J M ed Res Healt h Sci. 2013;2(1):70-77
4. Low Density Lipoprotein Cholesterol (LDL) It was estimated by using Erba Kit 27
manufactured by Transasia Bio-Medicals Ltd.
Atherogenic Index:
The Atherogenic index was calculated by using
the formula 29.
Atherogenic Index =
Total Cholesterol – HDL
HDL
Statistical Analysis
The statistical significance between groups was
analysed by using one way ANOVA, followed by
Dunnet’s multiple comparison test. The
significance was expressed by ’p’ values, as
mentioned in the table.
RESULTS
The results obtained are summarised in table 1.
The values obtained were expressed in specific
units of those parameters as mentioned in the
table. The results of estimation were reported as
Mean ± SEM (standard error of mean) of 6
animals at a time from each group. It was seen
that, there was a significant increase in all the
lipid parameters (p < 0.01), except HDL,
following administration of high fat diet. It was
also seen that concomitant administration of the
Amla powder at a dose of 540mg/kg body weight
along with high fat diet in the study animals,
showed a significant decrease in all the lipid
parameters (p <0.01) i.e. hypolipidemic and
antihyperlipidemic activity with a significant rise
in the value of serum HDL (p < 0.01). Standard
drug Atorvastatin at a dose of 7.2mg/kg
administered along with a high fat diet, showed a
significant decrease (p < 0.01) in all the lipid
parameters, while there was a significant increase
in serum HDL. The hypolipidemic activity of the
test drug was found to be slightly less efficacious
than that of the standard drug, in comparison to
the control. (Figure 1)
Table: 1. Effects of fruit powder of E. officinalis on serum lipids at the end of 8th week of study.
Group
Total Cholesterol
Triglyceride
(mg/dl)
(mg/dl)
HDL(mg/dl)
LDL(mg/dl)
Atherogenic
Index ratio
Group 1
88.7 ± 5.5
66.76 ± 3.02
26.35 ± 1.68
48.98 ± 2.96
2.42 ± 0.20
Group 2
80.4 ± 5.75*
57.5 ± 1.39*
35.5 ± 1.28*
32.70 ± 1.21*
1.27 ± 0.04 *
Group 3
267.0 ± 7.56 *
218.48± 9.19*
16.0 ± 0.90*
207.25± 7.81*
15.92 ± 1.06*
Group 4
99.1 ± 1.47†
83.6 ± 1.88†
25.7 ± 1.5 †
50.13 ± 3.92†
2.91 ± 0.23 †
Group 5
77.5 ± 4.7†
57.03 ± 3.26†
37.05 ± 1.4†
29.0 ± 4.0 †
1.11 ± 0.16 †
F
330.01
219.80
44.28
312.84
149.97
Df
25, 4
25, 4
25, 4
25, 4
25, 4
P
<0.01
<0.01
<0.01
<0.01
<0.01
*
: p < 0.01, when compared with the normal control group;
†
: p < 0.01, when compared with the hyperlipidemic control group.
(One way ANOVA followed by Dunnet’s multiple comparison test)
Data presented as Mean ± SEM
73
Sant oshkumar et al.,
Int J M ed Res Healt h Sci. 2013;2(1):70-77
300
250 mg/dl
200
150
100
50
0
Group 1
Group 2
Group 3
Group 4
Group 5
th
Figure-1: Graph show ing mean serum lipid parameters in 5 groups at the end of 8 week.
DISCUSSION
Hyperlipidemia was induced by administering a
high fat diet to the albino rats. Shyamala MP et al
23
stated that hyperlipidemia is a result of an
oxidative abuse due to free radicals, formed by the
interaction of high fat diet. They further stated
that, an enhancement in the concentration of
serum
cholesterol
and
triglycerides
of
hyperlipidemia rats maybe result of lipid
peroxidation evoked by high fat diet 30. In the
present study, Atorvastatin was used as a standard
drug 31.
E. Officinalis powder, administered
in
hyperlipidemia rats can elicit a profound influence
on the lipid metabolism. An enhancement in the
concentration of total serum cholesterol, serum
triglycerides, serum LDL, Atherogenic index of
hyperlipidemia rats was observed, which was
probably due to lipid peroxidation evoked by high
fat diet. Lipid peroxidation is a free radical
mediated process which has been implicated in a
variety of disease states.32 HDL concentration and
HDL ratio would be useful in diseases like
diabetes mellitus and coronary heart disease,
because of their inverse relationship.33 High LDL
levels are usually associated with atherosclerosis34
Hyper triglyceridemia is also associated with
metabolic consequences of hyper coagulability,
hyperinsulinemia, insulin resistance, and glucose
resistance, and is one of the risk factors in the
coronary heart disease 35.
Hypolipidemic efficacy of E. officinalis powder is
revealed by attainment of values below normal in
the lipid profile of group 2 rats. The anti hyperlipidemia activity of E. officinalis powder is
established by the attainment of near normal
values in lipid parameters of group 4 rats. The
hypolipidemic effect of E. officinalis may have a
protective mechanism against the development of
atherosclerosis. Anti lipoperoxidative property of
E.officinalis powder, maybe due to its rich
flavonoids and poly phenol contents. It is well
known that flavonoids and poly phenols are
natural anti-oxidants 36, 37.
Recent epidemiological studies have revealed that
the intake of flavonoids is inversely associated
with the risk of coronary heart disease. E.
Officinalis powder, rich in flavonoids and poly
phenols may also be contributing towards its
hypolipidemic effect, due to its ability to combat
oxidative stress by quenching free radicals
74
Sant oshkumar et al.,
Int J M ed Res Health Sci. 2013;2(1):70-77
generated in the body as a result of high fat diet.
E. Officinalis powder may also act by triggering
the secretion of anti-oxidant enzymes: Superoxide
dismutase, Catalase, and Glutathione peroxidase
in an enhanced level, which in turn stopped the
oxidative damage due to hyperlipidemia. Dhuley
JN et al 38 and Shyamala MP et al 23 have
documented a similar observation with
Cinnamonum verum bark and Amoma subulatum
seeds and Syzygium aromaticum respectively in
rats fed with high fat diet.
The present study which was done to evaluate the
effect of E. officinalis on serum lipids and
atherogenesis in albino rats is in agreement with
other studies 39, 40. As compared to the other
studies, in the present study E. officinalis powder
was used, which is easily available and
inexpensive. In previous studies, E. officinalis
aqueous and ethanolic extract has been used. The
present study was carried out for a longer duration
of time, i.e. 8 weeks as compared to the previous
studies which were done for 4 week duration.
As atherosclerosis is closely associated with
hyperlipidemia, it is beneficial to compare it with
a standard drug such as Atorvastatin. Such a
comparative study was not done before. Amla has
shown to possess significant hypolipidemic and
anti-atherogenic activity slightly lesser as
compared to Atorvastatin. But if we compare
Amla with Atorvastatin in terms of adverse effect
profile, Atorvastatin can cause severe adverse
effects like rhabdomyolysis to mention one of
them 41.
CONCLUSION
Amla can be safely used in the treatment of mild
to moderate cases of hyperlipidemia considering
its easy availability, cost effectiveness, and other
beneficial effects.
Not many studies have been undertaken to fully
evaluate the molecular and biochemical basis of
hypolipidemic action of Amla and further clinical
studies are required to find out the hypolipidemic
activity and molecular mechanism.
ACKNOWLEDGEMENT
The Authors wish to extend their gratitude to Dr
Prashant Dass (Post Graduate/Tutor, Department
of Pharmacology, MR Medical College,
Gulbarga) for helping in the preparation of this
manuscript.
REFERENCES
1. Norma ED. Atherosclerosis-An Inflammatory
Process. J Insur Med 2005; 37: 72-75.
2. Nobukoni Y, Higashikawa F, Miyagawa K, et
al. Hyperlipidemia: Complex Pathophysiology
caused by multiple genetic and environmental
forces in considering the approaches to
preventive medicine. Nippon Eiseigaku Zasshi
2005; 60 (4): 426-41.
3. Shoulder CC, Jones EL, Naoumova RP.
Genetics of familial combined hyperlipidemia
risk of coronary heart disease. Hum Mol
Genet Apr 2004; 1,13 Spec No.1: R 149-160,
Equb; 5.
4. Daniel JR, Helen HH. Disorders of
Lipoprotein metabolism: Harrison’s Principles
of Internal Medicine 18th Edition, McGraw
Hill Medical Publisher Division 2012;2: 314561.
5. Grundy SM, Cleeman JI, Merz CNB, et al.
Implications of recent Clinical trials for the
National Cholesterol Education Program:
Adult Treatment Panel III Guidelines.
Circulation. 2004; 110: 227-39.
6. Lloyd Jones DM, Hong Y, Labartha D, et al.
Defining and setting National goals for
cardiovascular health promotion and disease
reduction. The American Heart Association’s
Strategic Impact goal through 2020 and
beyond. Circulation. 2010; 121: 586-613.
7. Rybicki EP, Chikwamba R, Koch M, Rhodes
JI, et al. Plant-made therapeutics: an emerging
75
Sant oshkumar et al.,
Int J M ed Res Healt h Sci. 2013;2(1):70-77
platform in South Africa. Biotechnol Adv.
2012; 30 (2): 449-59.
8. Nair R, Chanda SV. Antibacterial Activities of
Some Medicinal Plants of the Western
Region of India. Turk J Biol. 2007;31: 231-36.
9. Sultan S, Ahmed S, Sharma S, Jahangir T.
E.officinalis reverse thioacetamide induced
oxidative stress and early promotional events
of primary hepatocarcinogenesis. J Pharma
Pharmacol. 2004; 56(12): 1573-79.
10. Muthuraman A, Sood S, Singla SK. The
antiinflammatory potential of phenolic
compounds from Emblica officinalis L. in rat.
Inflammopharmacology. 2011; 19 (6): 327-34.
11. Prachi J and Shilpa S. Antimicrobial
properties and phytochemical analysis of
Emblica officinalis. Asian J.Exp. Biol.
Sci.2010;1(1):91-95.
12. Poltanov EA, Shikov AN, Dorman HJ,
Pozharitskaya ON, Makarov VG, Tikhonov
VP, Hiltunen R. Chemical and antioxidant
evaluation of Indian gooseberry (Emblica
officinalis Gaertn., syn. Phyllanthus emblica
L.) supplements. Phytother Res. 2009; 23 (9):
1309-15.
13. Madhuri S, Pandey G, Verma KS.
Antioxidant, Immunomodulatory and Anti
cnacer activities of Emblica Officinalis: An
overview. IRJP. 2011; 2 (8):38-42.
14. Rajeshkumar NV, Therese M, Kuttan R.
Emblica officinalis Fruits Afford Protection
against Experimental Gastric Ulcers in Rats.
Therm Biol. 2001;39 (5): 375-80.
15. Akhtar MS, Ramzan A, Ali A, Ahmad M.
Effect of Amla fruit (Emblica officinalis
Gaertn.) on blood glucose and lipid profile of
normal subjects and type 2 diabetic patients.
Int J Food Sci Nutr. 2011; 62 (6): 609-16.
16. Sadaf H, Mohd D, Mohd A, Kunal S, Praveen
KV, Asad UK. Efficacy of E. Officinalis on
the Cariogenic Properties of Streptococcus
mutans: A Novel and Alternative Approach to
Suppress Quorum-Sensing Mechanism. PLoS
ONE 7 (7): e40319
17. Anil UT, Sanjay JS, Manisha PS, and Nehal
HG. Hepatoprotective effect of poly herbal
formulation against various hepatotoxic agents
in rats. Pharmacognosy Res. 2012; 4 (1): 50–
56.
18. Vaidya ADB. Reverse pharmacological
correlates of Ayurvedic drug actions. Indian J
Pharmacol. 2006: 38(5); 311-15.
19. Ghosh MN. Toxicity studies. Fundamental of
Experimental Pharmacology 4th Edition,
Hilton and Company, Calcutta, 2008; 178.
20. Shymala MP, Venukumar MR, Lata MS.
Antioxidant potential of the Syzygium
aromaticum (Gaertn) Linn (Clove) in rats fed
with high fat diet. Indian Journal of
Pharmacology 2003;35:99-103.
21. CPCSEA Guidelines for laboratory animal
facility. Indian J Pharmacol, Special Article.
2003;35, (4): 257-274.
22. Pereira S, Tettamanti M. Ahimsa and
alternatives -- the concept of the 4th R. The
CPCSEA in India. Altex 2005, 22 (1): 3-6.
23. Van HH, Baumans V, Brandt CJ, Boere HA,
Hesp AP, van Lith HA, Schurink M, Beynen
AC. Blood sampling from the retro-orbital
plexus, the saphenous vein and the tail vein in
rats: comparative effects on selected
behavioural and blood variables. Lab Anim.
2001; 35 (2): 131-9.
24. Sarika SS and Aarti GJ. Effects of methanolic
extract of Cuminum cyminum on total serum
cholesterol in ovariectomized rats. Indian J
Pharmacol. 2009; 41 (2): 92–93.
25. Urmila CK, Shraddha NS, Sandesh PJ.
Evaluation of hypoglycemic activity of Cassia
nodosa leaves in normal and streptozotocininduced diabetic rats. Int J Green Pharm 2012;
6: 9-13.
26. Milada Dobiášová. Atherogenic Index of
Plasma
[Log
(Triglycerides/HDLCholesterol)]: Theoretical and Practical
76
Sant oshkumar et al.,
Int J M ed Res Healt h Sci. 2013;2(1):70-77
Implications. Clinical Chemistry July
2004;50(7): 1113-17.
27. Park HR, Park M, Choi J, Park KY, Chung
HY, Lee J. A high-fat diet impairs
neurogenesis:
involvement
of
lipid
peroxidation and brain-derived neurotrophic
factor. Neurosci Lett. 2010; 4 (3): 235-39.
28. Harikrishnan S, Rajeev E, Tharakan JA, Titus
T, Ajit Kumar VK, Sivasankaran S,
Krishnamoorthy KM, Nair K. Efficacy and
safety of combination of extended release
niacin and atorvastatin in patients with low
levels of high density lipoprotein cholesterol.
Indian Heart J. 2008;60(3): 215-22.
29. Etsuo N, Yasukazu Y, Yoshiro S , Noriko N.
lipid peroxidation: Mechanisms, inhibition
and biological effects. Biochemical and
Biophysical
Research
Communications.
2005;338: 668-76.
30. Boizel R, Laporte F, Benhamou YP, Foulon T,
Lardy B, Halimi S. Ratio of Triglycerides to
HDL Cholesterol as an Indicator of LDL
Particle Size in Patients With Type 2 Diabetes
and Normal HDL Cholesterol Levels.
Diabetes Care. 2000;23(11): 1679-85.
31. Montalcini T, Gorgone G, Federico D,
Emanuele V, Sesti G, Ceravolo R, Pujia A,
Perticone F. Association of LDL cholesterol
with carotid atherosclerosis in menopausal
women affected by the metabolic syndrome.
Nutrition, Metabolism & Cardiovascular
Diseases. 2005; 15: 368-72.
32. Byron JH, Dennis LS, Vijay N. A truly deadly
quartet:
obesity,
hypertension,
hypertriglyceridemia, and hyperinsulinemia.
Cleveland
Clinic
Journal
of
Medicine.2002;69(12): 989-89.
33. Vinson JA, Liang X, Proch J, Hontz BA,
Dancel J, Sandone N. Polyphenol antioxidants
in citrus juices: in vitro and in vivo studies
relevant to heart disease. Adv Exp Med Biol.
2002;505:113-22.
34. Pietta GP. Flavonoids as Antioxidants. J. Nat.
Prod., 2000, 63 (7): 1035–42.
35. Dhuley JN. Anti oxidant effect of cinnamon
(Cinnamonum verum) bark and greater
cardamom (Amomum subula-tum) seeds in
rats fed with high fat diet. Indian J Exp Boil
1999; 37: 238-42.
36. Mishra M, Pathak UN, Khan AB. E.officinalis
Gaertn and Serum Choesterol level in
experimental rabbits. Br J Exp Pathol. 1981;
62 (5): 526-28.
37. Gulati RK, Aggarwal S, Aggarwal SS.
Hepatoprotective studies on Phyllanthus
emblica Linn and quercetin. Indian Journal of
Experimental Biology. 1995; 33: 261-68.
38. O’Sullivan S. Statins: A review of benefits
and risks. TSMJ. 2007; 8: 52-56.
39. Thomas
P
B.
Drug
therapy
for
hypercholesterolemia and dyslipidemia. In:
Laurence Burton, Bruce Chabner, Bjorn
Knollman. Goodman & Gilman’s The
Pharmacological Basis of Therapeutics. 12 th
Edition. McGraw Hill, New York 2011; 877908.
40. Harshmohan. The Blood Vessels and
Lymphatics: The Textbook of Pathology, 4 th
Edition. Jaypee Brothers Medical Publisher
(P) Ltd, Mumbai 2000; 252-54.
41. Satoskar RS, Bhandarkar SD, Rege NN.
Appetite
stimulants,
Digestants,
Anti
flatulents,
Appetite
suppressants
and
Hypolipidemic agents. Pharmacology and
Pharmacotherapeutics. 22nd Edition. Popular
Prakashan Pvt Ltd, Mumbai 2011; 571-86.
77
Sant oshkumar et al.,
Int J M ed Res Healt h Sci. 2013;2(1):70-77
International Journal of Medical Research
&
Health Sciences
www.ijmrhs.com Volume 2 Issue 1 Jan-Mar 2013 Coden: IJMRHS Copyright @2013 ISSN: 2319-5886
Received: 15 th Nov 2012
Revised: 23th Dec 2012
Accepted: 29th Dec 2012
Original research article
CORONARY DOMINANCE IN SOUTH INDIAN POPULATION
*Vasudeva Reddy J1, Lokanadham S2
1
Department of Anatomy, Sri Venkateswara Medical College, Tirupati, Andhrapradesh.
Department of Anatomy, ViswaBharathi Medical College, Kurnool, Andhrapradesh.
2
*Corresponding author email: loka.anatomy@yahoo.com
ABSTRACT
Coronary artery anomalies are considered clinically insignificant and known to be associated with other
congenital heart defects, myocardial ischemia and reduced life expectancy. Almost all elderly people have
at least some impairment of coronary artery circulation. Therefore normal and pathological physiology of
coronary circulation is one of the most important aspects in the entire field of medicine. In our study we
dissected 80 human heart specimens to observe the coronary arteries from their origin to termination. We
found 69 out of 80 are showing the right predominance (86.25%), 9 specimens with left predominance
(11.26%) and remaining 2 of the balanced (2.5%) type of coronary circulation. The results of the study
were compared with other literatures and variations are noted. In some cases we observed left
predominance in males which indicates the reason for higher incidence of myocardial infarction in males
when compared to females.
Keywords: Coronary artery, Right dominant, Left dominant, Balanced or co- dominant
INTRODUCTION
Human heart supplied by two coronary arteries
namely right &left coronary arteries, arise from
ascending aorta. The left coronary artery divides
into left anterior descending artery and circumflex
artery, supplies blood to the front of the left side of
the heart, lateral side and base of the heart1. The
right coronary artery branches are the posterior
descending artery and acute marginal arteries,
supplies blood to the right ventricle, right atrium,
Sino Atrial node, Atrioventricular node and a
variable portion of the left ventricle2. Hettler stated
the left coronary artery dominance, right coronary
artery dominance and co-dominant are the three
Vasudeva Reddy et al.,
types of coronary circulation3. Anomalous origin
and distribution of the coronary arteries were shown
to be a cause of sudden death in young and adult
patients, often in association with physical exertion.
Coronary artery anomalies when occur pose
difficulty with coronary visualization, identification
and present unique problems for surgical treatment.
Our study determines the pattern of coronary artery
dominance, balanced type of circulation in south
Indian population.
78
Int J Med Res Health Sci.2013;2(1):78-82
MATERIALS AND METHODS
arteries from their origin to termination. With
regards to coronary predominance out of 80
specimens 69 (male-48, female-21) of right
predominance (Figure-I), 9 specimens(male-8,
female-1) of left predominance(Figure-II) and 2
specimens (male-1, female-1) of balanced or codominance (Figure-III) type of coronary
circulation was observed. The percentage of
incidence 86.25% in right predominance, 11.25%
left predominance and balanced 2.55% were
tabulated (Table-I). We also photographed the
arteriogram of the right predominance and
balanced or co – dominance type coronary
circulation is labelled and we also observed the
course of the posterior interventricular artery
from its sulcus to the apex of the heart and noted.
A total (n=80) heart specimens were collected
with a portion of ascending aorta from relatively
fresh bodies that came for post-mortem at the
Forensic Department, SV Medical College,
Tirupati. Each specimen thoroughly washed to
free it from the blood clots and dissected
anatomically and ethical committee of our
institute permitted to do the work. The arterial
pattern of heart from the origin of the coronary
arteries to their termination observed and
variations are recorded. And also the
arteriograms of types of coronary circulation
with labelled photographs are collected from the
cardiology department.
RESULTS
In the present study 80 human heart specimens
were dissected and observed for the coronary
Table: 1. Distribution of specimens with type of Coronary circulation
Dominance
Right dominance
Male
48
Female
21
Total
69
Percentage (%)
86.25
Left dominance
Balanced
8
1
1
1
9
2
11.25
2.5
The termination of right coronary artery reaches
and half of the posterior inter ventricular septum
the crux and beyond crux in 73.3%, and right to
in 9% of hearts were tabulated. The data were
the crux 20% and at the right border in 6.6% of
analyzed through descriptive statistics to calculate
the specimens was observed, whereas left
percentages. Qualitative statistics were used to
coronary artery terminates at 1/3 of posterior inter
analyze arteriogram. (Table-II)
ventricular septum 61% of hearts, at the apex 30%
Table- II: Termination of Coronary arteries (PIVS: Posterior Inter Ventricular Septum)
Termination
Crux & Beyond Crux of Heart
Specimens with Right
Coronary dominance
Specimens with Left
Coronary dominance
73.3%
-
Right to Crux
20%
-
Right border
Lower1/3 of PIVS
6.6%
-
61%
Apex
-
30%
Half of PIVS
-
9%
Vasudeva Reddy et al.,
Int J Med Res Health Sci.2013;2(1):78-82
79
DISCUSSION
The present study shows 86.25% of right coronary
predominance, 11.25% left predominance and 2.5%
of balanced type of coronary circulation were
observed. Most of the literatures stated the right
predominance is seen in 70%of hearts left
dominance in 20% of hearts and 10%of balanced
type of coronary circulation.1,12 Balanced type of
circulation is more common in females.4 According
to James 1961, the left coronary artery
predominance is seen in males.5 The incidence of
right predominance in 90%of hearts, left
predominance in10% and balanced type in few
hearts.6 In a study revealed on the basis of 6000
selective arteriogram, the right coronary
predominance was present in 60% of persons. 7
Most common form of coronary circulation was
found to be the right dominant.8,12 The arterial
pattern was found to be right dominance based on
crux cordis and the subsinuosal interventricular
branch.9 In Kenya sum of the population right
coronary artery was found to be dominant in 82%
of the hearts.10 The right coronary artery dominance
was most prevalent, followed by the balanced type
and the left coronary artery dominance in Brazilian
population as well.11 However, the data are
inadequate to study the coronary predominance in
relation to sex in our population. The incidence of
right predominance 57%,left dominance 10% and
balanced 33% of circulation out of 30 cases.12,13
LCX
RCA
M CV
PD
Figure:1. Dissection of human Heart & Antero posterior view of arteriogram showing right
coronary dominance
(PD: posterior descending branch, RCA: right coronary artery, MCV: middle cardiac vein, LAD: left
anterior descending branch, LCX: left circumflex, D: diagonal, LMA&RMA: right and left marginal
branches)
80
Vasudeva Reddy et al.,
Int J Med Res Health Sci.2013;2(1):78-82
LCX
PD
Figure:2. Dissection of human heart showing Left coronary dominance
(PD: posterior descending branch-interventricularartery, LCX:leftcircumflexbranch)
RCA
LCX
PD
PD
Figure:3. Dissection of human Heart & Antero posterior view of arteriogram showing Balanced
circulation
(PD: posterior descending branch-interventricular arteries, RCA: right coronary artery, LCA: left coronary
artery, LAD: left anterior descending branch, LCX: left circumflex branch)
81
Vasudeva Reddy et al.,
Int J Med Res Health Sci.2013;2(1):78-82
CONCLUSION
Our study reveals the majority of the cases
observed with right coronary artery dominance
compared to left coronary artery dominance and
also the incidence of right coronary dominance
are higher in males than females. In some cases
we observed left predominance in males which
indicates the reason for higher incidence of
myocardial infarction in males when compared
to females.
ACKNOWLEDGEMENT
Authors are thankful to Dr R V Subhakar,
Professor, for his able guidance and special thanks
to Dr R Sekhar, Professor, for his constant
encouragement for this work.
REFERENCES
1. Williams PL, Bannister LK, Berry MM,
Collins P, Dyson M, Dussek JE, Ferguson
MWJ; Grays Anatomy. 2000; 38th Ed.,
Edinburgh, Churchill Livingstone: 1505-1510.
2. Libby P, Bonow RO, Mann DL, Zipes DP.
Braunwald; Heart Diseases a text book of
Cardiovascular Medicine. 2008; 8th Ed: 478.
3. Gawlikowska SA, Miklaszewska D, Czerwi
ÅF, Folia O. Analysis of the influence of
heart size and gender of coronary circulation.
Folia Morphol. 2010; 69 (1): 35-41.
4. Schlesinger MJ; Relation of anatomic pattern
to pathological conditions of the coronary
arteries. Arch. Path. 1940; 30:403-415.
5. James TN. Anatomy of the coronary arteries,
New York. Paul B Hoeber. 1961; 12-150.
6. Anderson RH, Becker AE; Cardiac anatomyAn integrated text and colour atlas. 1980; 2123.
7. Effler, Groves DB, Suarez LK, Favdoro EL;
Direct coronary artery surgery with end
arterotomy and patch - graft reconstruction.
Journal of thoracical cardiovascular surgery.
1967; 53-93.
8. Abuchaim DC, Spera CA, Faraco DL, Ribas
Filho JM, Malafaia O; Coronary dominance
patterns in the human heart investigated by
corrosion casting. Rev Bras Cir Cardiovasc.
2009; 24 (4):514-8.
9. Vieira TH, Moura PC Jr, Vieira SR, Moura
PR, Silva NC, Wafae GC et al; Anatomical
indicators of dominance between the coronary
arteries in swine. Morphology. 2008;
92(296):3-6.
10. Side HS, Olumbe AO, Kalebi A; Anatomy
and pathology of coronary artery in adult
black Kenyans. East Afr MED J. 2002;
79(6):323-7.
11. Balci B, Yilmaz O. Atherosclerotic
involvement in patients with left or right
dominant coronary circulation. Kardiol Pol.
2004; 60(6):564-6.
12. Ayer, A Rao YG; A Radiographic
investigation of the coronary arterial pattern in
human hearts. Journal of anatomical society of
India. 1957; 6:63-67.
13. Jain.SP, Hazary S; Coronary arterial patterns
in man and some other animals. Journal of
Anatomical Society of India.1958;7: 1-4.
82
Vasudeva Reddy et al.,
Int J Med Res Health Sci.2013;2(1):78-82
International Journal of Medical Research
&
Health Sciences
www.ijmrhs.com Volume 2 Issue 1Jan-Mar 2013 Coden: IJMRHS Copyright @2013 ISSN: 2319-5886
Received: 9th Dec 2012
Revised: 25th Dec 2012
Accepted: 29th Dec 2012
Original research article
BODY FRIENDLY, SAFE AND EFFECTIVE REGIMEN OF MgSO4 FOR ECLAMPSIA
*Gautam S. Aher 1, Urmila Gavali2
1
Professor, Dept of OBGY; 2Assistant Professor, Padmashree Dr. Vithalrao Vikhe Patil Medical College
& Hospital, Ahmednagar, Maharashtra.
*Corresponding author email: drgsaher@gmail.com
ABSTRACT
Pre-eclampsia and eclampsia are major health problems in developing countries. MgSO4 is the standard
drug in the control of convulsions in eclampsia. Our study carried out at PDVVPF’s hospital is based on
the low dose regimen than Pritchard, which is suitable for Indian women who are of smaller built than
women in western world. This prospective study included 50 eclampsia patients receiving low dose
MgSO4 therapy. The loading dose of MgSO4 was 9gm. Following this 2.5 gm was given intramuscularly
every 6 hourly for 24 hours after administration of the loading dose. Patients were monitored hourly by
observing their respiratory rate, knee jerk and urine output. Out of 50, two patients required Pritchard
regimen, rest completely recovered from eclampsia. The maternal and perinatal morbidity and mortality
were comparable to those of the standard Pritchard regime. The study did not find a single case of
magnesium related toxicity with low dose MgSO4 regime. Low dose magnesium sulphate regime was
found to be safe and effective in eclampsia.
Key Words : Eclampsia, Pritchard Regime, Low dose MgSO4.
INTRODUCTION
Eclampsia is a common cause of maternal
mortality worldwide particularly in the developing
countries. It is estimated that every year eclampsia
is associated with about 50,000 maternal deaths
worldwide, most of which occur in developing
countries.1 The incidence of eclampsia in our
country varies from 0.5%-1.8%. The major
breakthrough in the management of eclampsia
came when Dr. J. A. Pritchard published his
standardized MgSO4 treatment regime in 1984.
The collaborative Eclampsia Trial which was a
large multicentric trial in 27 centres in 9
developing countries, found magnesium sulphate
to be a better anticonvulsant in the management of
eclamptic seizures when compared to phenytoin
and diazepam.2 There has been a constant
discussion in literature regarding dose of
Magnesium sulphate and therapeutic serum
Magnesium levels. J A Pritchard commented
that if a woman is known to be or appear to be
small, the dose should probably be limited.3 Winit
Phauapradit et al commented that is appropriate to
take into account body weight when considering
the dosage of drug for Asian women with body
83
Aher GS et al.,
Int J Med Res Health Sci. 2013;2(1):83-86
weight less than 7okg. The aim of the present
study was to evaluate the effectiveness of low
dose magnesium sulfate in control of convulsions
in eclampsia, to assess the magnesium related
toxicity and to analyze the maternal and perinatal
outcome.
MATERIALS AND METHODS
During the study period of 2009 to 2011, at Dr.
Padmashree Vithalrao Vikhe Patil Hospital, 50
cases of antepartum eclampsia were included in
the present study after human ethical committee
approval. Patients with a history of generalized
tonic-clonic convulsions, elevated blood pressure
and proteinuria with no previous history of seizure
disorders like epilepsy were included in the
present study. Patients were excluded from study
if there was doubt about the diagnosis because the
accompanying relatives did not witness the
seizure, there was no elevated blood pressure on
admission or had received diazepam as
anticonvulsant prior to admission. After taking
written informed consent from each patient that
fulfilled the inclusion criteria patients received
loading dose of 4 grams of magnesium sulphate
(20%) i.v. with 2.5 grams (50%) i.m. in each
buttock. Subsequently, maintenance dose of 2.5
grams (50%) was given i.m. in alternate buttock
every 6 hours up to 24 hours after delivery or after
last convulsion, whichever was later. Serum Mg++
level was measured 12 hours after the first dose. If
convulsions were not controlled by the low dose
regime, then the case was shifted to the standard
Pritchard regime. Patients were monitored for
respiratory rate, Urine output (30ml/ hour) & deep
tendon reflexes same as that of Pritchard regimen.
All the principles of management of eclampsia are
followed. After stabilization of patients, labour
was induced or augmented. Cesarean section was
performed for obstetric indications.
RESULTS
During the study period, 57 (2.4%) cases of
antepartum eclampsia were noted among the 2375
deliveries. Among these, 50 cases were included
in the study. Most of the patients (36 cases; 72%)
had not taken antenatal care. The patients were
from 17 years to 35 years with a mean age of 21
years. 78% cases were primigravidas.
The total dose of magnesium sulphate, required
for control of convulsions was less than 20 grams
ie.56.82% less than that is required in standard
Pritchard regime. The serum magnesium levels
were monitored in all cases for evidence of
magnesium toxicity. The mean serum magnesium
value ranged between 4.1 to 4.35meq/lit during
the low dose regime. There was no maternal
mortality due to eclampsia or its complication in
the present study. In present study Microsoft excel
was used for statistical analysis.
Table: 1. Comparison of our regime with Pritchard’s regime
MgSO4 regime
96%
Control of convulsions
4%
Recurrence Rate
4%
Cases requiring a shift to the
standard Pritchardt regime
12%
Perinatal mortality
4.1 to 4.35meq/lit
Serum Magnesium level
0
Signs of drug toxicity
Pritchard’s regime
93.33%
6.67%
33.84%
3.74-6.14mg/dl
2%
84
Aher GS et al.,
Int J Med Res Health Sci. 2013;2(1):83-86
Table:2. Comparison of total dose of MgSO4 in different regimes
Name of regime
Pritchard
regime
Low dose
Padhar regime
Low dose
Dhaka regime
MgSO4 low dose
regime
Loading dose MgSO4 (20%) IV
Loading dose MgSO4 (50%) IM
Maintenance dose (50%) IM
4gm
10gm
5gm 4 hrly
3gm
5gm
2.5gm 4hrly
4gm
6gm
2.5gm 4 hrly
4gm
5gm
2.5gm 6 hrly
30
23
25
19
Total dose (gm) in 24 hrs
DISCUSSION
The incidence of eclampsia within the study
period was 2.4% which underscores the
magnitude of the disease. Other factors found
associated with eclampsia in this study were
young maternal age; primigravidity and lack of
prenatal care which are similar to what have been
reported by other workers. 5, 6 Also majority of
these patients belongs to the lower socioeconomic
group. 84% patients had body weight less than
50kg. Pritchard regime was standardized for
western women, having total bodymass index
much higher than women from developing
countries, including India. In present study
convulsions were controlled in 96% of cases with
total dose less than 20 gms (43.18% of pritchard
regime. In present study intramascular dose was
reduced to 2.5gms at 6 hr interval. This did not
affect the efficacy of regime as evidenced by
serum Mg levels at 12 hrs. However this
significantly decreased incidence of pain at
injection site, tissue necrosis and abscess
formation. Rashida Begum et al7 in their study,
reported that eclamptic convulsions were
controlled in 98% cases with modified (Dhaka)
regime of magnesium sulphate. Results of the
present study were comparable with above
mentioned studies. Begum MR et al8 suggested a
small body mass index to be the reason for
effectiveness of low dose regimen in women in
developing countries. There was no maternal
mortality in the present study. Perinatal mortality
in the present study was 12%. The majority
(66.7%) of deaths were stillbirths and 33.3%
Aher GS et al.,
were neonatal deaths. Prematurity, placental
abruption and growth restriction were common
causes of perinatal deaths. Sardesai Suman et al
reported 33.90% perinatal mortality.9 The mean
serum magnesium levels remained in the range of
4.1 to 4.35meq/lit during low dose magnesium
sulphate regime. Therefore low dose regimens,
might significantly improve the safety. Moreover,
low dose MgSO4 might be used in cases with
mild renal impairment which is usually present in
these patients.
CONCLUSION
Associated with similar efficacy in controlling
convulsions and potentially more favorable
toxicity and complication rates, the use of low
dose MgSO4 protocols is a viable alternative to
standard dose therapy. The dose required for
control of a convulsion with the low dose
magnesiumsulphate regime was less than half of
the standard Pritchard regime making it a body
friendly
regime.
However
multi-center,
randomized controlled trials are recommended to
test this proposed regimen to support routine
clinical use low dose protocols.
ACKNOWLEDGEMENT
We could not have been able to work this low
dose MgSO4 regime of ours without studying
Prichard’s regime and established low dose
regimes like Padhar regime and Dhaka regime.
85
Int J Med Res Health Sci. 2013;2(1):83-86
REFERENCES
1. Duley L. Maternal mortality associated with
hypertensive disorders of pregnancy in Africa,
Asia, Latin America and the Caribbean. Br J
ObstetGynaecol. 1992;99:547-53.
2. The Eclampsia Trial Collaborative Group.
Which anticonvulsant for women with
eclampsia? Evidence from Collaborative
Eclampsia Trial.Lancet. 1995; 345:1445-63
3. Jack A. Pritchard, Cunningham G et al. The
Parkland Memorial Hospital Protocol for
treatment of eclampsia: Evaluation of 245
cases. Am. J. ObstetGynacol. 1984;148:95163.
4. Phaupradit Winit, Saropala N et al, Serum
level of Magnesium attained in Magnesium
Sulphate therapy for severe preeclampsia.
Asia Oceania J. Obstet& Gyn. 1993; 194:38789
5. Ekele BA, Bello SO, Adamu AN. Clusters of
eclampsia in a Nigerian teaching hospital. Int
J Gynecol Obstet. 2007;96:62–66.
6. Bugalho A, Bacci A, Bergstrom S. Risk
factors in Mozambican women with
Eclampsia: A case-referent study. Afr J Repro
Health. 2001;5:30–35.
7. Rashida Begum. Anowara Begum, Richard
Johnson et al. A low dose (Dhaka) magnesium
sulphate regime for eclampsia. Acta
Obstetricaet Gynecologica Scandinavica 2001;
80(1):998.
8. Begum MR, Begum A, Quadir E. Loading
dose versus standard regime of magnesium
sulphate in the management of eclampsia: a
randomized trial. J ObstetGynaecol Res.
2002;28:154–59.
9. Sardesai Suman, MairaShivanjali, PatilAjit et
al. Low dose magnesium sulphate therapy for
eclampsia and imminent eclampsia- Regime
tailored for Indian women. J. Obstet Gynecol
India 2003; 53-6: 546-550
86
Aher GS et al.,
Int J Med Res Health Sci. 2013;2(1):83-86
International Journal of Medical Research
&
Health Sciences
www.ijmrhs.com Volume 2 Issue 1 Jan-Mar 2013 Coden: IJMRHS Copyright @2013 ISSN: 2319-5886
Received: 15 th Nov 2012
Revised: 13th Dec 2012
Accepted: 16th Dec 2012
Original research article
LIPID INDICES IN TYPEII DIABETES MELLITUS AND THEIR ASSOCIATION WITH
MACRO AND MICRO VASCULAR COMPLICATIONS
*Imran Ahmed Siddiqui MD 1, Laxmikanth B MD2, Mariya MD3, Rama Rao J MD4.
1
Specialist, Department of Biochemistry ESIC Super Specialty Hospital, Hyderabad
Asst Professor Department of Biochemistry Shri Sathya Sai Medical College & Research Institute,
Chennai.
3
Asst Professor, Department of Anatomy, Shadan Institute of Medical Sciences, Hyderabad
4
Professor & Head Department of Biochemistry, Osmania Medical College, Hyderabad
2
*Corresponding author email: write2drimran@gmail.com
ABSTRACT
Background: Type II Diabetes Mellitus patients can develop complications over a prolonged period of
time. The alterations in lipid indices can be associated with these complications. Aims:To identify
changes in lipid metabolism in type 2 DM in context with the glycemic status, its relative impact on the
macro & micro vascular events, and the effects of insulin therapy on the lipid indices. Methods and
Material: 158 Type II diabetics were selected as cases and 30 subjects without any coincidental illness as
controls were selected for the study. Total cholesterol, Triglyceride, HDL-C, Cholesterol/ HDL-C ratio
and Atherogenic Index (AI) were estimated and the data was statistically analyzed. Results: Atherogenic
index and CHOL/HDL-C levels were significantly higher in diabetics than in controls. Both the indices
were also found to be lowered in patients on treatment with insulin. The AI in patients with complications
was also significantly higher than those without complications; however CHOL/HDL-C was not
significantly different. Thus using the best cutoff values AI can be used as a better indicator for
complications than using the ratio of CHOL/HDL-C. Conclusion: AI can be used to indicate the presence
of increased cardiovascular risk in patients with type II DM, and as a guide for the aggressive therapeutic
approach.
Keywords: Type II DM, Lipid indices, Atherogenic index, Micro and Macro vascular complications.
INTRODUCTION
Diabetes a metabolic disorder is characterized by
hyperglycemia and a predisposition to micro and
macro vascular diseases1,15,19. In patients with
diabetes atherosclerosis occurs at an earlier age
and is the chief cause of mortality in them 2,14.
Diabetes leads to impaired carbohydrate
metabolism in association with derangement in
lipid metabolism, virtually every lipid and
87
Imran et al.,
Int J Med J Res Health Sci. 2013;2(1):87-92
lipoprotein is affected in type II DM1. Elevated
triglycerides associated with low HDLc levels,
preponderance of small dense lipoproteins and
increased apolipoprotein B in diabetics is the most
prevalent pattern of dyslipidemia3,4,5,16,17,18.
Hypertriglyceridemia, decrease in HDL are
independent risk factors for coronary heart
disease4,17, small dense LDLc are also atherogenic
as they are more likely to form oxidized LDL and
are less readily cleared. Recently rather than the
concentration of cholesterol in various
lipoproteins the size and composition are shown
to be important in atherogenesis. However as the
sub fractionation of lipoproteins by the present
method cannot be undertaken in all the clinical
laboratories and recently as the AIP has been
shown to correlate with the size and composition
of lipoproteins3,18; Hence in the present study we
observed the lipid profile and AIP and
CHOL/HDL ratio, in type II diabetic patients in
context with glycemic status and its relation to
macro and micro vascular events and effects of
insulin therapy on lipid indices.
MATERIALS &METHODS
After permission from the Institutional Ethical
Committee, Total 178 subjects in between 30-80
yrs age were selected for the present study. 148
known diabetics on regular treatment as cases and
30 healthy subjects without any coincidental
illness as controls. Patients with a history of
smoking and alcoholism were excluded from the
study; Cases were divided based on the level of
glycemic control into HBA1c < 7 as good control
(group I n=46), HBA1c 7-8 fair control (group II
n=50) and HBA1c > 8 as poor control (group III
n=52).
The above same Cases 148 were also categorized
into group 1 consist of cases who had a history of
complication in the past 10 years (n=62) and
group2 who never had a history of complication
in the past 10 yrs (n=86), to see its relation to the
study parameters
The above same 148 cases were also divided into
2 groups, group I was the cases who were on oral
therapy ( i.e. oral hypoglycemic) (n = 95). Group
II were patients who were on insulin therapy ( n =
53). After an overnight fast, peripheral venous
blood samples were collected in two vaccutainers
5ml in gel vaccutainer and 2 ml in the EDTA
vaccutainer. Serum separated after centrifuge; was
used to analyze fasting & the post prandial blood
sugar by GOD-POD method, Total cholesterol by
CHOD-POD method 6, Triglycerides by GPO-PAP
method and HDL-c fraction which was assayed
using the cholesterol CHOD-POD method6.
The EDTA sample was used to measure HbA1C
that was determined by HPLC method. LDL was
calculated
from
Frieldwalds
formula7,
CHOL/HDL-C ratio, AIP log (TG/HDL-C) 3 was
calculated in different groups. Data obtained was
analyzed by SPSS statistical software (v 17.0);
ANOVA was used to compare the 3 groups and
significance was estimated using the F value in
between different groups.
RESULTS
Table 1: Mean ± SD of Various Parameters in Cases and Controls
Controls
Group I
Group II
Group III
F value
Sig
T.Chol
153.6 ± 25.16
164.7 ± 27.2
172.2 ± 22.9
178.7 ± 35.67
5.414
<.001
HDL
LDL
VLDL
TG
38.5 ± 4.39
96.4 ± 15.27
18.6 ±0.42
93.1 ± 9.49
35.6 ± 4.54
96.4 ± 20.8
32.5 ± 5.05
163.3± 25.65
36.08 ± 3.5
96.6 ± 20.11
38.7 ± 11.24
194.71 ±56.8
34.78 ± 4.4
103.04 ± 32.6
40.93 ± 13.4
205.3 ± 67.2
5.16
0.83
38.70
38.93
.002
.478
<.001
<.001
AIP
0.38 ± 0.06
0.659±0.059
0.71 ± 0.11
0.75 ± 0.1
127.14
<.001
CHOL/HDL
4.02 ± 0.85
4.59 ± 0.30
4.76 ± 0.29
5.15 ± 0.89
20.46
<.001
88
Imran et al.,
Int J Med J Res Health Sci. 2013;2(1):87-92
Table 1 shows the mean and SD of different lipid
fractions, studied. The mean of total cholesterol,
triglycerides, VLDL, AIP, CHOL/ HDL ratio was
significantly increased in patients than controls
(p<0.001). There was no significant increase in
LDLc in patients compared to controls (p=0.478).
Serum HDLc was significantly decreased in
patients when compared to controls (p=0.002).
Multiple comparison ANOVA shows that Total
Cholesterol was significantly higher in group III
(p=0.003), than group I(=0.422) and group II
(=0.092)compared to controls; the increase was
not significant in comparison of group I with
group II(0.701) and group III(0.095),and group II
with group III (p=0.784). HDL-c was significantly
decreased in group III (p=0. 002), than group I
(0.036) and group II (0.150) when compared to
controls; the decrease was not significant in
comparison of group I with group II (0.981) and
group III (0.0740), and group II with group III
(p=0. 580). TG and VLDL was significantly
higher in group III (p=0. 001), than group I (=0.
001) and group II (=0. 001) compared to controls;
and in comparison of group I with group II (=0.
031) and group III (=0. 001), and group II with
group III (p=0. 001). LDL-c was not significantly
higher
in
patients
compared
with
controls(p=0.7333) and in between the groups
(p=0.717)
ANOVA for AIP shows that AIP was
significantly more in group III (<0.001), group II
(<0.001), & group I (<0.001) when compared to
controls; and in group III (<0.001) and group II
(<0.025) compared to group I but the increase was
not significant between group II and group III
(0.231). The CHOL / HDL-c ratio was
significantly more in group III (<0.001), group II
(<0.001), & group I (<0.001) when compared to
controls, and in group III compared to group I
(<0.001) but the increase was not significant
between group I and group II (0.700) and group II
and group III (0.086).
ANOVA in relation to insulin therapy shows that
total cholesterol (0.002), LDL-c (<0.001) was
significantly more in patients on insulin than
patients with other oral hypoglycemic (OHA),
increase in total cholesterol was significant in
relation to controls (<0.001) than LDL-c (0.062).
There was no significant increase in HDL-c in
patients on insulin compared to patients on OHA
(0.702). Insulin therapy showed a significant
decrease in TG (0.033), VLDL (0.031), AIP
(<0.001), CHOL/HDL ratio (0.046) in patients on
insulin therapy than on OHA.
ANOVA in relation to complications shows that
patients with complications showed no increase in
total cholesterol (0.934) & LDL-c (0.652) than
patients without complications, but the increase in
total cholesterol (0.019) was significantly more
compared to controls, but the increase in LDL-c
was not significant when compared to controls
(0.633). Patients with complications showed no
significant decrease in HDL than patients without
complications (0.652), but the decrease was
significant when compared to controls (0.006).
TG and VLDL showed a significant increase in
patients with complications than without
complications (<0.001), and controls (<0.001).
AIP was significantly more in patients with
complications than without complications
(<0.001), and controls (<0.001). CHOL/HDL-c
ratio was not significantly different in patients
with and without complications.
At the best cutoff value AIP is a much better
marker in identifying complications (sensitivity
80%, specificity 70%) than CHOL/HDL-c ratio
(sensitivity 50%, specificity 55%).
89
Imran et al.,
Int J Med J Res Health Sci. 2013;2(1):87-92
Table 2: Area under the curve, sensitivity and specificity, of various lipoproteins, AIP and
CHOL/HDL-c ratios; calculated from best cut off value using ROC curve.
PARAMETER
T.CHOL
HDLC
LDL
VLDL
TG
AIP
CHOL/HDL
AUC
0.552
0.531
0.603
0.747
0.747
0.810
0.564
COMPLICATION
SENSITIVITY SPECIFICITY
52%
56%
27%
70%
41%
64 %
40 %
99.94%
64 %
78 %
80 %
69.7%
50 %
55 %
DISCUSSION
Diabetes mellitus is the commonest metabolic
disorder, a social and economic burden to the
society because of the increased morbidity and
mortality associated with its complications3, 8, 9, 10.
Many markers are studied for their association in
the development of diabetic complications. The
most common amongst them are various lipids,
lipoproteins and different ratios involving these
complications3, 8, 10. Recently lipid particle sub
fractions have also been implicated in the
atherogenic process18. The major phenotypic
feature of diabetes mellitus, the hyperglycemia is
shown to be directly or indirectly associated with
the pathogenesis of complications; insulin therapy
is shown to be associated with decreased
incidence of complications2. The present study
was undertaken to assess the value of different
markers.
All Lipoproteins are shown to be affected in
diabetes mellitus. The most prevalent pattern
being increased TG, decreased HDL-c with an
increase in the LDL-c3,4,5,16,17,18, present study
confirms the changes in TG and HDL-c, but the
increase in LDL-c was not significant and not to
the extent of TG, this can be expected as TG is
most affected lipid component, increase in TG
level may lead to increase in LDL-c and
cholesterol10 . The abundance of free fatty acids
appears to play an important role in the
pathogenesis of low HDL in DM. In liver free
AUC
0.654
0.597
0.285
0.625
0.625
0.712
0.628
INSULIN
SENSITIVITY SPECIFICITY
57%
67%
35%
79%
55 %
75 %
24 %
90 %
25.6 %
87 %
62.8%
75.7%
61.4%
62.8%
unsaturated fatty acid stimulate the TG synthesis
and VLDL production. Low HDL and increased
TG are also markers of beta cell toxic metabolic
situation and beta cell failure11,16,18.
Hyperlipidemia is associated with hyperglycemia
and glycemic control reduces the risk for all
complications from DM. Good glycemic control
requires a continual combination of proper diet,
daily physical activity, and usually antiglycemic
drug therapy9. Poor control of blood glucose
levels impairs endogenous insulin production,
resulting in a vicious cycle, that affects both the
carbohydrate and lipid metabolisms in patients
with diabetes2, 9. Hyperglycemia is shown to
induce similar intracellular signals in endothelial
cells as hyperlipidemia3.
In the present study we observed significantly
higher total cholesterol, TG, VLDL and
significantly lower HDL-c in poor diabetics
compared to controls, however TC, HDL-c, are
not significantly different in different grades of
glycemic status. TG and the TG associated ratio
paralleled glycemic status.
In the present study we observed significantly
lower TG, VLDL and ratios in diabetics on insulin
compared to other modes of treatment. However
total cholesterol and LDL-c is significantly higher
in patients on insulin therapy with no significant
increase in HDL-c. Insulin treatment was shown
to be associated with improvement in
90
Imran et al.,
Int J Med J Res Health Sci. 2013;2(1):87-92
dyslipidemia of DM. Insulin therapy increases the
expression of Apo A1 gene and inhibits the
production of VLDL12.
Various lipid and lipoprotein fractions are shown
to
be
associated
with
diabetic
2,13,14,18
complications
. In the present study we
found a significantly higher concentration of total
cholesterol, TG, VLDL and AIP, and Lower
HDL-c in patients with complications. However
LDL-c and Chol/HDL-c ratios are not
significantly different.
To assess the significance of these various
markers the best cutoff values were calculated
using ROC analysis. The AIP is the only indicator
which showed significant sensitivity and
specificity in identifying diabetic complications,
TG is the next relatively better marker. All other
markers showed poor sensitivity.
CONCLUSION
The present study confirms that the abnormalities
in TG and VLDL are more prominent than
Cholesterol and LDL in patients with diabetes and
HDL is a better indicator of lipid abnormalities
than total cholesterol and LDL.
AIP is a good marker in identifying complications
associated with diabetes, and is better correlated
with glycemic status in diabetics on insulin
therapy. And as AIP can easily be calculated from
routine lipid investigations, AIP can be routinely
be used as a marker for prediction of
complications.
Acknowledgement. : we acknowledge our patients
who have participated in the study
3.
4.
5.
6.
7.
8.
9.
10.
11.
12.
REFERENCES
1.
2.
Brown. WV. Lipoprotein disorder in diabetes
mellitus. Medical clinics of North America
1994:. 78, 143-61.
Jenny EK et al. Do glucose and lipids exert
independent effects on atherosclerotic lesion
Initiation or progression to advanced plaques?
Circ. Res. 2007;100:769-81
13.
Meng HT et al.
Pioglitazone reduces
atherogenic index of plasma in patients with
type 2 diabetes. Clin Chem. 2004; 50:7;118488
Michael HD. Global risk management in
patients with type 2 diabetes mellitus. Am J
Cardiol 2007; 99:41–50.
Sandra JL. Prevention and treatment of
atherosclerosis: A practitioner’s guide for
2008 The American Journal of Medicine.
2009; 122:38-50
Allan et al, enzymatic determinations of total
serum cholesterol. Clin Chem. 1974; 20: 47075.
Friedwald, Levy WT. Estimation of
concentration of LDL-c in plasma without the
use of preparative ultracentrifuge. Clin Chem.
1972; 18; 499-02.
Steven M Haffner etal. Mortality from
coronary heart disease in subjects with type 2
Diabetes and in nondiabetic subjects with and
without prior Myocardial infarction. N Engl J
Med 1998;339:229-34.
Standards of medical care in diabetes; diabetes
care: 2012; 35,11-S49.
David Snipelisky, Paul Ziajka. Diabetes and
hyperlipidemia: a direct quantitative analysis.
World Journal of Cardiovascular Diseases,
2012; 2: 20-25.
Lucia Rohrer. High density lipoproteins in the
intersection of diabetes mellitus, Inflammation
and cardiovascular disease. Current Opin
Lipidol.2004; 15:269–27
Maxime
N.
Insulin-Mediated
DownRegulation of Apolipoprotein A5 Gene
Expression through the Phosphatidylinositol
3-Kinase Pathway: Role of Upstream
Stimulatory Factor. Mol Cell Biol. 2005
February; 25 (4): 1537–48.
Auni Juutilainen etal. Type 2 Diabetes as a
Coronary Heart Disease Equivalent: An 18year prospective population-based study in
Finnish subjects. Diabetes Care December
2005;28(12): 2901-07.
91
Imran et al.,
Int J Med J Res Health Sci. 2013;2(1):87-92
14.
15.
16.
17.
18.
19.
Diane M Erdman etal. The Impact of
Outpatient Diabetes Management on Serum
Lipids in Urban African-Americans With
Type 2 Diabetes. Diabetes Care January 2002;
25(1): 9-15.
Edward JB etal. Does diabetes always confer
coronary heart disease risk equivalent to a
prior myocardial infarction? Implications for
prevention. Diabetes care. 2011;34(3): 782-84.
Tangvarasittichai etal. Association of serum
lipoprotein ratios with insulin resistance in
type 2 diabetes mellitus. Indian Council of
Medical Research, May 2010 Volume: 131,
Issue: 5.
Byambaa Enkhmaa etal. Postprandial
Lipoproteins and Cardiovascular Disease Risk
in Diabetes Mellitus. Curr Diab Rep. 2010
February; 10(1): 61–69.
Richard WN. LDL Cholesterol Lowering in
Type 2 Diabetes: What Is the Optimum
Approach?
Clinical
Diabetes
January
2008;26(1): 8-13.
W
Todd
Cade.
Diabetes-Related
Microvascular and Macrovascular Diseases in
the Physical Therapy Setting. Physical
Therapy November. 2008;88(11):1322-35.
92
Imran et al.,
Int J Med J Res Health Sci. 2013;2(1):87-92
International Journal of Medical Research
&
Health Sciences
www.ijmrhs.com Volume 2 Issue 1 Jan-Mar 2013 Coden: IJMRHS Copyright @2013 ISSN: 2319-5886
Received: 26 th Nov 2012
Revised: 13th Dec 2012
Accepted: 30th Dec 2012
Original research article
PHYTOCHEMICAL SCREENING AND ACUTE TOXICITY STUDY OF ETHANOLIC
EXTRACT OF ALPINIA GALANGA IN RODENTS.
Subash K.R*, Muthulakshmi Bhaarathi G, Jagan Rao N, Binoy Vargheese Cheriyan
Department of Pharmacology, Meenakshi Medical College and Research Institute, Kanchipuram, Tami
Nadu.
*corresponding author email: subbu2207@yahoo.com
ABSTRACT
Introduction: Alpinia galanga is an important ingredient in various herbal formulations has reached
extensive acceptability as therapeutic agents for several diseases. The investigation of authentic analytical
methods, which can reliably profile the phytochemical composition and studies on toxicity profile,
including hematological and biochemical parameters is an important initial step for the establishment of
standardization to screen further in search of consistent biological activity. Aim: To screen ethanolic
extract of Alpinia galanga for its phytochemical constituents and acute toxicity profile. Methods: Acute
toxicity studies done in rodent by OECD guideline 423 and phytochemical analysis by standard laboratory
grade reagents. Results The present study revealed the presence of complex phytochemical constituents
including phenols and flavanoids. The acute toxicity results has classified the test material to fall under the
hazard category 2000mg/kg<LD50<5000mg/kg according to globally harmonized classification system.
Conclusion The present study concludes the safety of ethnobotanical use of Alpinia galanga from acute
toxicity results and the presence of various phytochemical constituents in Alpinia galanga may be
responsible for its various pharmacological actions documented in traditional medicine.
Key words: Phytochemical screening, Alpinia galanga, Acute toxicity, Ethanolic extract.
INTRODUCTION
The use of medicinal plants and preparations
derived from them as dietary supplements,
Nutraceuticals, functional foods and herbal
medicinal products has become more widely
accepted in developing countries. Therefore, it is
important to evaluate the adverse effects of these
plants and their preparations to increase the
confidence in its safety to human, particularly for
use in the development of pharmaceutical
products. Based on Strobel and Daisy 20031 there
should be some Rationale for plant selection like
plants from unique environmental settings
especially those with an unusual biology, plants
that have an ethno botanical history, plant that are
93
Subash KR et al.,
Int J M ed res Health Sci. 2012;2(1):93-100
endemic that has an unusual longevity and plant
growing in areas of great biodiversity. The
medicinal plant selected and investigated for
present study Alpinia galanga has a very strong
ethno botanical history endemic in south east Asia
and still available as an Ayurvedic preparation for
wider
therapeutic
application
including
inflammatory disorders. It is used as a constituent
of the following Ayurvedic preparations. Rasandi
gugluva,
Ashvagandaoil,
Karpasadi
oil,
Mahanarayaoil, Mahabalaoil, Vishagananeelaoil,
Chyathya ghathya, Vruhathjagaladighathaya,
Kakubdhadi powder, Ashvagandadi powder,
Ranagigru kvathaya, Ranavishvadiya (Rasna
dashamula), Rasna sapthayakaya, Bilvorasnadi
kvathaya,
Dashamul
Iguruadi
kvathaya,
2
Dashamuladi kvathaya, Kumaraguliya .
Apart from traditional Ayurvedic preparation
modern pharmaceutical companies manufacture
and provide these preparations in the form of
capsules and tablets with standardized packing,
few hit products containing Alpinia galanga in the
formulary includes Rumalaya forte and
Orthocare-B for the treatment of arthritis. Based
on a review of the literature the present study is an
effort to screen phytochemical constituent and
study acute toxicity activity of ethanolic extract of
Alpinia galangal
MATERIALS AND METHODS
Plant Materials
The rhizomes from the plant Alpinia galanga
were collected from the local areas of Coimbatore
(Tamil Nadu, India). The collected material was
authenticated by Dr Sasikala Ethirajulu, Assistant
Director (Pharmacognosy), Siddha Central
Research Institute, Chennai, India.
Experimental animals
Colony inbred animal strains of swiss albino mice
of female sex weighing 20-25 g three in each
group control and test were used for the
toxicological studies according to OECD
guidelines. The animals were kept under standard
conditions 12:12 (day/night cycles) at 22 0C room
temperature, in polypropylene cages. The animals
were fed on standard pellet diet and tap water ad
libitum. The animals were housed for one week in
polypropylene cages prior to the experiments to
acclimatize to laboratory conditions. The
experimental protocol was approved by the
Institutional Animal Ethical Committee (IAEC).
Preparation of Plant Material
The collected rhizome materials were thoroughly
washed under running water, shade dried for a
week at 35-40oC, pulverized in an electric grinder
and exhaustively extracted successively in a
Soxhlet apparatus by using the solvent, ethanol.
The extracts were concentrated under reduced
pressure and were then powdered.
Qualitative Phytochemical Analyses
The phytochemical tests below were carried out
on the ethanolic extract of Alpinia galanga to
determine the active constituents according to the
procedures and methods outlined in Barnes, J.
(1999) and Harborne3,4. These phytochemical
tests were done to detect the presence of
secondary metabolites, such as alkaloids, tannins,
saponins, resins, flavonoids, steroid, glycosides
and terpenoids in the plant under investigation.
Test for Alkaloids
A quantity (0.2g) of the sample was boiled with
5ml of 2% HCl on a steam bath. The mixture was
filtered and 1ml portions of the filtrate was
measured into four test tubes. Each of the 1ml
filtrate was treated with 2 drops of the following
reagents.
i. Dragendorff’s test: A red precipitate
indicates the presence of alkaloids.
ii. Mayer’s test: A creamy-white colored
precipitate indicates the presence of alkaloids.
iii. Wagner’s test: A reddish-brown precipitate
indicates the presence of alkaloids.
iv. Picric Acid (1%): A yellow precipitate
indicates the presence of alkaloids.
Test for Flavonoids
A quantity (0.2g) each of the extracts was heated
with 10ml of ethyl acetate in boiling water for 3
94
Subash KR et al.,
Int J M ed res Healt h Sci. 2012;2(1):93-100
minutes. The mixture was filtered differently and
the filtrates used for the following tests:
i. Ammonium Test: A quantity (4ml) each of the
filtrates was shaken with 1ml of dilute ammonia
solution (1%). The layers were allowed to
separate. A yellow coloration was observed at the
ammonia layer, which indicates the presence of
flavonoids.
ii. Aluminum Chloride Test: A quantity (4ml)
each of the filtrates was shaken with 1ml of 1%
aluminum chloride solution and observed for light
yellow coloration. A yellow precipitate indicates
the presence of flavonoids.
Test for Phenols
i. Ferric chloride test: The fraction of the
extract was treated with 5 % ferric chloride
and observed for the formation of deep blue or
black colour.
ii. Liebermann’s test: The extract was heated
with sodium nitrite, added H2SO4 solution
diluted with water and excess of dilute NaOH
was added and observed for the formation of
deep red or green or blue colour.
Test for Glycosides
Dilute sulphuric acid (5ml) was added to 0.1g
each, of the extracts in a test tube and boiled for
15 minutes in a water bath. It was then cooled and
neutralized with 20% potassium hydroxide
solution. A mixture, 10ml of equal parts of
Fehling’s solution A and B was added and boiled
for 5 minutes. A more dense red precipitate
indicates the presence of glycoside.
Test for Steroids and Terpenoids
A quantity (9ml) of ethanol was added to 1g each
of the extracts and refluxed for a few minutes and
filtered. Each of the filtrates was concentrated to
2.5ml in a boiling water bath. Distilled water, 5ml
was added to each of the concentrated solution,
each of the mixtures was allowed to stand for 1
hour and the waxy matter was filtered off.
Each of the filtrates was extracted with 2.5ml of
chloroform using a separating funnel. To 0.5ml
each of the chloroform extracts in a test tube was
carefully added 1ml of concentrated sulphuric
acid to form a lower layer. A reddish-brown
interface shows the presence of steroids. To
another 0.5ml each of the chloroform extract was
evaporated to dryness on a water bath and heated
with 3ml of concentrated sulfuric acid for 10
minutes in a water bath. A grey colour indicates
the presence of terpenoids.
Test for Saponins
A quantity (0.1g) each of the extract (ethanol) was
boiled with 5ml of distilled water for 5 minutes.
The mixture was filtered while still hot and the
filtrates used for the following tests:
i. Emulsion Test: A quantity (1ml) each of the
filtrates was added drops of olive oil. The mixture
was added to another two drops of olive. The
mixture was shaken and observed for the
formation of emulsion.
ii. Frothing Test: A quantity (1ml) of the
different filtrates was diluted with 4ml of distilled
water. The mixture was shaken vigorously and
then observed in standing for a stable froth.
Test for Tannins
A quantity (2g) each, of the extracts (n-hexane
and water) was boiled with 5ml of 45% ethanol
for 5 minutes. Each of the mixtures was cooled
and filtered. The different filtrates were subjected
to the following tests.
i. Lead Sub-acetate Test: To 1ml of the different
filtrates was added 3 drops of lead sub-acetate
solution. A cream gelatinous precipitate indicates
the presence of tannins.
ii. Ferric Chloride Test: A quantity (1ml) each
of the filtrates was diluted with distilled water and
added 2 drops of ferric chloride. A transient
greenish to black color indicates the presence of
tannins.
Test for Proteins
A quantity (5ml) of distilled water was added to
0.1g each, of the extracts. This was left to stand
for 3 hours and then filtered. To 2ml portion of
the filtrate was added 0.1ml Millon’s reagent. It
was shaken and kept for observation. A yellow
precipitate indicates the presence of proteins.
95
Subash KR et al.,
Int J M ed res Healt h Sci. 2012;2(1):93-100
Burette Test: A quantity (2ml) each of these
extracts was put in a test-tube and 5 drops of 1%
hydrated copper sulphate was added. A quantity,
2ml of 40% sodium hydroxide was also added and
the test-tube shaken vigorously to mix the
contents. A purple coloration shows the presence
of proteins (presence of two or more peptide
bonds).
Test for Carbohydrate
A quantity of 0.1g each of the extracts was shaken
vigorously with water and then filtered. To the
aqueous filtrate was added a few drops of Molisch
reagent, followed by vigorous shaking again.
Concentrated sulphuric acid, 1ml was carefully
added to form a layer below the aqueous solution.
A brown ring at the interface indicates the
presence of carbohydrate.
Acute oral toxicity study
Acute oral toxicity was conducted as per the
Organization of Economic Cooperation and
Development (OECD) guidelines 423 (Acute
Toxic Class Method). The acute toxic class
method is a stepwise procedure with 3 animals of
a single sex per step. Depending on the mortality
and /or moribund status of the animals, on the
average 2-4 steps may be necessary to allow
judgment on the acute toxicity of the test
substance. This procedure results in the use of a
minimal number of animals while allowing for
acceptable data based scientific conclusion. The
method uses defined doses (5, 50, 300, 2000
mg/kg body weight) and the results allow a
substance to be ranked and classified according to
the Globally Harmonized System (GHS) for the
classification of chemicals which cause acute
toxicity. Wistar albino rats of either sex weighing
200-250 g were fasted overnight, but allowed
water ad libitum. Since Alpinia galanga is
relatively nontoxic in clinical practice where the
rhizome powder 1-3 gm is used5. The highest dose
of 2000mg/kg/p.o. directly (as per OECD
guidelines “Unclassified”) was used in the acute
toxicity study6. The animals were observed
closely for behavioral toxicity, if any by using
functional observation battery which includes
central nervous system signs of excitation,
depression, motor activity and autonomic nervous
system.
Biochemical studies
The procedures were followed as per standard
laboratory technology. Estimation of glucose
Aspartate aminotransferase (AST) Alanine
aminotransferase (ALT) Alkaline phosphatase
(ALP) Urea was estimated using a commercial
Glucose estimation kit (Span Diagnostics) by
standard methods 7.
Haematological studies
Erythrocyte count, Total Leukocyte Count (WBC)
and Hemoglobin was estimated by
Hemocytometer method8.
Statistical analysis
Total 3 rodents are used as per the guidelines
provided by OECD 423 and the results were
expressed as mean ± standard error of mean
(S.E.M.)
RESULTS AND DISCUSSION
Phytochemical analysis
Alpinia galanga belongs to the family
Zingiberaceae. The ethanolic extract of Alpinia
galanga had an extractive yield of 2.24% with
total ash value of 6.17 %, water soluble ash 2.26
% and acid insoluble ash of 3.78% (Table-1).
Qualitative phytochemical analysis revealed the
presence of various constituents such as alkaloids,
carbohydrates, saponins, tannins, protein,
glycosides, flavonoids, steroids and terpinoids.
Quantitative Phyto chemical analysis of ethanolic
extract of Alpinia galanga is reported to have
maximum total phenol and flavonol content9. The
results for qualitative Phyto chemical analysis
were tabulated in Table no -2.
96
Subash KR et al.,
Int J M ed res Healt h Sci. 2012;2(1):93-100
Table:1. Physical properties extractive values of ethanolic extract of A. galanga
S. No
Parameters
Results
1
Loss of drying @ 100 degree Celsius
0.42 %
2
Total ash value
6.17 %
3
Water soluble ash
2.26 %
4
Acid insoluble ash
3.78 %
5
pH at 10% aqueous solution
3.04 %
6
extractive yield - solvent ethanol
2.24%
Table: 2. Preliminary Qualitative Phytochemical study of ethanolic extract of A.galanga
Sl
No
Constituents
1
Alkaloids
2
Carbohydrates
3
Steroid& Terpenoids
4
Protein
5
Phenols
6
Tannins
7
Flavanoids
Test
Observation
Inference
Intensity
Mayer’s reagent
Wagner’s reagent
Picric Acid (1%)
Dragendorff’s test
Molisch reagent
Fehling A&B
Benedict’s reagent
Liebermann Burchard
Burette Test
Milky precipitate
Reddish brown precipitate
Yellow precipitate
Red precipitate
Dull violet colour
Red precipitate
Dark green colour
Purple coloration
+
+
+
+
+++
++
+++
+++
++
Ninhydrin test
Ferric chloride test
Liebermann’s test
10% lead acetate
Braymer’s test
Ammonium Test
Aluminum Chloride
Glacial acetic acid,
FeSO4 , Con H2SO4
Purple coloration
Deep blue colour
Deep green colour
No changes
No changes
Yellow colouration
Yellow precipitate
Red precipitate
+++
++
+
_
_
+
++
+++
&
Glycosides
Foam test
No foam
_
8
Saponin
Emulsion test
No emulsion
_
9
(+) denotes the presence of the respective class compound, (-) denotes the absence of the respective class
compound
From this study, the presence of phenolic
compounds such as terpenoids, steroids
(phytosterols i.e. ß-sitosterol) in ethanolic extract
of Alpinia galanga may contribute to the
antioxidant properties benefited by traditional
medicine use. For many years now, it has been
97
Subash KR et al.,
Int J M ed res Healt h Sci. 2012;2(1):93-100
known that plant polyphenols (steroids,
terpenoids, flavonoids etc) are antioxidants in
vitro10. These antioxidants are compounds that
reduce the formation of free radicals or react with
and neutralize them thus potentially protecting the
cell from oxidative damage 11. The tannins and
resins in the extract are employed as astringent
both in the gastrointestinal tract and on skin
abrasions by traditional medicine. The flavonoids
and phenolic compounds in plants have been
reported to exert multiple biological effects
including antioxidant, free radical scavenging
abilities, anti inflammatory, an anti carcinogenic
activity which are detected in extract 12.
Acute Toxicity
The acute toxicity study was done as per the
guidelines laid by The Organization for Economic
Co-operation and Development (OECD). The
OECD Test Guidelines are recognized world-wide
as the standard reference tool for chemical testing.
Since available literature information suggests
that mortality is unlikely at the highest starting
dose level (2000 mg/kg body weight), the limit
test is performed as explained in materials and
methods. There was no gross difference in body
weight of the control and extract treated group,
observed for over the period of 14 days (Table-3).
..
Table:3. Body weight, Death and Toxicity observations of EE Alpinia galanga
Animal
identity
(markings)
BODY WEIGHT (gm)
Signs of toxicity
(Day 0-14)
Body Weight
changes(gm)
(Day 0 & 14)
Day-7
23.30
23.35
24.95
Day-14
23.30
24.37
24..95
No death
No death
No death
Nil
Nil
Nil
00.06
00.05
00.05
EE Alpinia galanga
24.80
HEAD
24.80
24.86
No death
Nil
00.06
25.50
25.55
25.57
No death
Nil
00.07
HEAD
NECK
TAIL
NECK
Initial
23.24
23.32
24.90
Date of death
prior to
sacrifice
24.00 24.05
24..08
No death
Nil
00.08
TAIL
observed for first four hours, twenty four hours,
Similarly all six animals three in each group are
day 7 and day 14 for central nervous system
individually observed daily for position, activity,
excitation, depression, autonomic nervous system
food, water intake and signs of toxicity like
and motor activity. The extract revealed normal
hyperactivity,
circling,
jumping/hopping,
behavioral activity. At the end of 14 days the
excessive grooming, kicking of rear legs, standing
on front legs and gait abnormalities. The
control and ethanolic extract of A.galanga treated
observation revealed normal activity in both
group was sacrificed and investigated for
groups (Table -4)
haematological, biochemical and necropsy
analysis. The results revealed no significant
Behavioral hematological and biochemical
difference in haematological, biochemical
studies
Gross behavioural studies of ethanolic extract of
parameters (Table-5 & 6) and in necropsy
A.galanga – 2000mg/kg and control group
observation of sacrificed animals did not show
any gross abnormalities in tissues and major
organ.
98
Subash KR et al.,
Int J M ed res Healt h Sci. 2012;2(1):93-100
Table:4. Individual cage -side observations
Animal identity
(markings)
Position
Onset of toxicity
Activity
Food and Water Signs of toxicity
intake
Control
HEAD
Normal
Normal
Adequate
Nil
Nil
NECK
Normal
Normal
Adequate
Nil
Nil
Normal
TAIL
EE Alpinia galangal
Normal
Adequate
Nil
Nil
HEAD
Normal
Normal
Adequate
Nil
Nil
NECK
Normal
Normal
Adequate
Nil
Nil
TAIL
Normal
Normal
Adequate
Nil
Nil
Table:5. Effect of EE Alpinia galanga rhizome on hematological parameters after 14 days of acute
toxicity testing in Swiss albino mice
Groups
Hb %
RBC
WBC
Differential leukocyte count (%)
(n=3)
(gm)
(milli/cu.mm)
(cells/cu.mm)
Control
15.03 + 2.49 10.85 + 1.63
EE Alpinia 15.61 + 3.46 11.68 + 1.48
Lymphocytes
Monocytes
Granulocytes
7.05 + 0.56
71
19
8.9
7.96 + 1.59
75
15
9
galanga
Table:6. Effect of EE Alpinia galanga rhizome on biochemical markers after 14 days of acute
toxicity testing in Swiss albino mice
Groups
AST (IU/L)
ALT (IU/L) Urea (mg/dl) Creatinine Glucose
(mg/dl)
(mg/dl)
Control (D. W)
45.50 + 3.19
14.40 + 0.73
56.07 + 2.06
0.48 + 0.40
286.04 + 3.96
EE Alpinia galangal
47.45 + 2.44
13.78 + 1.65
54.04 + 1.78
0.48 + 0.35
279.71 + 18.39
CONCLUSION
Selection of scientific and systematic approach to
the biological evaluation of plant products based
on their use in the traditional system of medicine
forms the basis for an ideal approach in the
development of new drugs from the plant 13.
Phytochemical screening of Alpinia galanga has
revealed the presence of many complex
substances including phenols and flavanoids
Subash KR et al.,
which are responsible for many biologic activity
and acute toxicity test in the present study has
revealed that the ethanolic extract of Alpinia
galanga substance is classified in the hazard
category 2000mg/kg < LD50 < 5000mg/kg
according to globally harmonized classification
system.
99
Int J M ed res Healt h Sci. 2012;2(1):93-100
ACKNOWLEDGEMENTS
The Author profoundly thanks the Vice principal
Dr M. Chandrasekhar Meenakshi Medical College
and Research Institute, and Mr. Purushothaman,
for providing assistance in utilizing central
research lab facilities.
REFERENCE
1. Strobel G, Daisy B. Bioprospecting for
microbial endophytes and their natural
products. Microbiology and Molecular
Biology Review.2003, 67: 491-02.
2. Ayurveda Pharmacopoeia. Department of
Ayurveda, Colombo, Sri Lanka. 1979,l: Part 2
& 3:11-25
3. Barnes J. Trease and Evans' Pharmacognosy.
Focus on Alternative and Complementary
Therapies. 1999, 4: 151–152.
4. Harborne JB. Phytochemical methods: a guide
to modern techniques of plant analysis.
London: Chapman & Hall. 1998, 3rd ed:302 .
5. Khare CP. Encyclopedia of Indian Medicinal
Plants. Springer, 2007, 1st edition, 44-45.
6. Ecobichon DJ. The basis of toxicity testing.
CRC Press, New York, 1997, 43-86.
7. Kanai L. Mukherjee. A text book of medical
laboratory technology. A procedure manual
for routine diagnostic tests. Tata McGraw Hill
Publishing company ltd. 1999; 1:265-76.
8. Miale
JB.
Laboratory
Medicine:
Haematology. 4th Ed. C.V. Mosby co,
St.Louis, 1972; 1198-09
9. Dhanabal SP, Satish kumar MN, Parth
Kumar H, Bavadia, Srividya . Antioxidant and
Antidiabetic
Activity
of
Alpinia
Galanga. IJPPR.2011, 3(1):6-12
10. Rice-Evans CA, Miller NJ, and Paganga G.
The relative antioxidant activity of plant
derived polyphenolic flavonoids. Free Rad
Res. 1995; 22(4): 375-83
11. Delanty N, and Dichter MA. Antioxidant
therapy in neurological disease. Arch Neurol.,
2000; 57(9): 1265-70.
12. Prashant Tiwari, Bimlesh Kumar, Mandeep
Kaur, Gurpreet Kaur, Harleen Kaur
Phytochemical screening and Extraction: A
Review International Pharmaceutica Sciencia .
2011;1(1): 98-106.
13. Kar DM, Maharana L, Parrnik S, Dash GK.
Studies on hypoglycemic activity of solanum
xanthocarpum schrad & Wendl fruit extract in
rats. Journal of Ethnopharmacology. 2006;
108: 251-56.
100
Subash KR et al.,
Int J M ed res Healt h Sci. 2012;2(1):93-100
International Journal of Medical Research
&
Health Sciences
www.ijmrhs.com Volume 2 Issue 1Jan-Mar 2013 Coden: IJMRHS Copyright @2013 ISSN: 2319-5886
Received: 9th Dec 2012
Revised: 25th Dec 2012
Accepted: 31st Dec 2012
Original research article
DEHYDROEPIANDROSTERONE LEVELS AND COGNITIVE FUNCTION IN AGING
*Rathna Kumari U1, Padma K2
1
PG Resident, 2 Director, Institute of Physiology and experimental medicine, Madras Medical College,
Chennai-03
*
corresponding author email: uratna_1986@yahoo.co.in
ABSTRACT
Background: Dehydroepiandrosterone (DHEA) is a steroid hormone secreted by the adrenal cortex.
Recent research reports show that DHEA has various beneficial effects including neuro protective effects
and that the decline in its production with aging may contribute to neuronal dysfunction and degeneration,
and thus cognitive decline.Aim: To assess the cognitive functions and estimate the levels of DHEA in
subjects of the same age group. Materials and Methods: A cross sectional comparative study of sixty
healthy male participants between 60 to 70 years of age was done. They did not have other medical
disorders likely to affect cognitive function. Their performance in the principal domains of cognition, i.e.
memory, attention and concentration, verbal fluency, language and visuospatial functioning was observed.
Serum levels of DHEA were estimated for all the participants by ELISA method. Results: A significant
positive correlation was observed between DHEA level and three domains of cognition viz., visuospatial
skills (r = 0.95), verbal fluency (r = 0.49) and short term memory (r = 0.28). No association was found
with other domains of cognition. Conclusion: Subjects with low levels of serum DHEA among the same
age group showed a significant decline in visuospatial skills, short term memory and verbal fluency.
Keywords: Dehydroepiandrosterone sulphate, Cognitive function.
INTRODUCTION
Dehydroepiandrosterone (DHEA) is a steroid,
mainly of adrenal origin, that is found in relatively
high concentrations in human plasma. It serves as
a precursor of both androgenic and estrogenic
steroid hormones. In the circulation, DHEA exists
both free and bound to sulphate (DHEA-S). Thus,
DHEA-S serves as the principal storage form of
DHEA. DHEAS – has many intrinsic effects like
antiaging,
antiobesity,
antidiabetic,
anti
1
atherogenic and neuroprotective effects . A
progressive decrease in circulating levels of
DHEA with age has long been recognized, with
peak levels occurring between the third and fourth
decades of life and decreasing progressively
thereafter by about 90% over the age of 85.
Though DHEAS levels peak at around 25 years of
age and starts declining with increase in age, it is
subject to wide inter-individual variations. Its
levels are also affected by factors like gender,
physical activity etc. Recent research reports show
Rathna et al.,
Int J Med res Health Sci. 2013; 2(1):101-106
101
that decline in DHEA production with aging may
contribute to neuronal dysfunction and
degeneration, and thus cognitive decline. Animal
experiments showed that DHEAS can enhance
neuronal and glial survival and differentiation in
culture2, 3. Administration of DHEA has been
reported to have striking beneficial effects on
memory. Their cognitive performances were
directly related to increases in plasma levels of
DHEA and DHEA-S4. The present study thus was
performed to investigate possible associations
between DHEA levels and cognitive performance
in healthy elderly men.
MATERIALS AND METHODS
,
After the institutional ethical approval the present
study was conducted in the Institute of Physiology
and Experimental medicine, Madras Medical
College, Chennai. After obtaining informed
consent, sixty healthy male subjects (who had
completed at least 10 years of basic school
education) aged between 60 and 70 years were
selected randomly from the urban population of
Chennai city. They did not have other medical
disorders likely to affect cognitive function. We
explained the scope and details of the study to the
subjects. The subjects underwent routine clinical
examination and biochemical tests to satisfy the
selection criteria. . Fasting blood samples of the
subjects were obtained for estimation of DHEA-S.
Fasting blood samples were obtained under strict
aseptic precautions, by venepuncture of the
antecubital vein. The serum was separated and
stored in the deep freezer at -20 0 C. The serum
levels of DHEA-S was measured using ELISA
kits viz. serum Dehydroepiandrosterone sulphate
estimation supplied by Cal biotech Inc
(California). The Addenbrooke's Cognitive
Examination- Revised (ACE-R) 16 was applied to
all the participants. It is a brief and simple
cognitive screening tool. It is established as a
sensitive screening test for Mild Cognitive
Impairment, dementia and Alzheimer’s disease. It
takes about 15 minutes to administer this test for
each participant.
Table: 1. ACE-R five major domains of cognition and normal values.
Attention
Memory
Verbal fluency
Language
Visuospatial functioning
Nor mal Values
Below nor mal/ poor
16 and above
17 and above
9 and above
22 and above
14 and above
<16
<17
<9
<22
<14
RESULTS
In our study the mean DHEA level (µg/dl) of the
subjects was (142.9 ± 36). We observed a
significant positive correlation between DHEA
level and three domains of cognition viz.,
visuospatial skills (r = 0.95), verbal fluency (r =
0.49) and short term memory (r = 0.28). No
significant association was found with other
domains of cognition
102
Rathna et al.,
Int J Med res Health Sci. 2013; 2(1):101-106
Fig:1.Correlation between DHEA (µg/ dl) and verbal fluency.
Fig:2.Correlation between DHEA (µg/ dl) and visuospatial skills.
Fig:3. Correlation between DHEA (µg/dl) and short term memory.
103
Rathna et al.,
Int J Med res Health Sci. 2013; 2(1):101-106
Table: 2. Correlation between DHEA and Visuospatial skills
DHEA
Pearson
Correlation
DHEA
VISUOSPA
DHEA
VISUOSPA
DHEA
VISUOSPA
Sig.
(2-tailed)
N
**.
VISUOSPA
1.000
.952**
.
.000
60
60
.952**
1.000
.000
.
60
60
Correlation is significant at the 0.01 level
Table: 3. Correlation between DHEA and Short Term Memory.
DHEA
Pearson
Correlation
DHEA
STM
DHEA
STM
DHEA
STM
Sig.
(2-tailed)
N
*.
STM
1.000
.279*
.
.031
60
60
.279*
1.000
.031
.
60
60
Correlation is significant at the 0.05 level
Table: 4. Correlation between DHEA and Verbal Fluency
DHEA
Pearson
Correlation
DHEA
FLUEN
DHEA
FLUEN
DHEA
FLUEN
Sig.
(2-tailed)
N
**.
FLUEN
1.000
.487**
.
.000
60
60
.487**
1.000
.000
.
60
60
Correlation is significant at the 0.01 level
Table 5: Correlation between DHEA and Long Term Memory.
DHEA
Pearson
Correlation
Sig.
(2-tailed)
N
DHEA
LTM
DHEA
LTM
DHEA
LTM
LTM
1.000
.059
.
.655
60
60
.059
1.000
.655
.
60
60
No significant correlation
Table 6: Correlation between DHEA and Language skills.
DHEA
Pearson
Correlation
Sig.
(2-tailed)
N
DHEA
LANG
DHEA
LANG
DHEA
LANG
LANG
1.000
.068
.
.604
60
60
.068
1.000
.604
.
60
60
No significant correlation
104
Rathna et al.,
Int J Med res Health Sci. 2013; 2(1):101-106
DISCUSSION
Debonnel et al in the year 1996 showed that
DHEA acts on the central nervous system to
increase the effects of the excitatory
neurotransmitter, glutamate, and decrease the
effects of the inhibitory neurotransmitter, GABA5.
DHEA and its sulfated form are considered
neuroactive because they affect the GABA-A
receptor complex and NMDA-mediated glutamate
transmission via sigma receptors12. Studies have
also shown that DHEA increases neuronal
excitability, enhances neuronal plasticity and acts
as a neuroprotective agent 6.
Blauer et al in 1991observed that both the
immunological and neural effects of DHEA/S
may
be
related
to
their
powerful
7.
antiglucocorticoid action It has been proved that
very high levels of cortisol can cause damage to
neurons, particularly in the hippocampus8. The
adverse effects of cortisol which might be seen
during stress or trauma may be counteracted by
the high levels of DHEA. Lower levels of DHEA
in older adults may make them more vulnerable to
the damaging effects of cortisol9. In vitro studies
have proved that DHEA can increase the
proliferation of human neural stem cells and the
number of neurons.
Some research studies showed lower levels of
DHEA in the serum of patients diagnosed with
dementia10. DHEA and DHEA sulfate are proved
to be neurosteroids that modulates learning and
memory11.
Wolf et al in 1997 found significant improvement
following DHEA administration compared with
placebo in both immediate recall and delayed
recall memory test13. Higher endogenous DHEAS
levels were independently and favorably
associated with better executive function,
concentration, and working memory15. Crosssectional studies have reported a relationship
between the prevalence of Alzheimer’s disease
and low dehydroepiandrosterone sulphate
(DHEA-S) plasma levels14.
CONCLUSION
In an aim to find an association between DHEA
levels and cognitive functions in healthy ageing,
we found that higher levels of DHEA was linked
to better visuospatial skills, verbal fluency and
short term memory. Recently, there has been a
resurgence of interest in DHEA, because it has
been suggested that it might have anti-ageing
effects. It has also been suggested that serum
DHEA may be represented as a biomarker of
healthy aging and physiological methods of
improving its levels by physical activity, diet etc.,
are topics of recent research. Hence, age related
cognitive decline, Alzheimer’s disease and its
associated complications which are considered as
an expanded spectrum of accelerated ageing can
attribute a part of its pathogenesis to lowering
DHEA levels. Further research on this topic can
derive clues to pathogenesis of ageing.
REFERENCES
1. Adams JB. Control of secretion and function
of C19-delta 5-steroids of the human adrenal
gland. Mol Cell Endocrinol 1985; 41:1–17.
2. Roberts E, Bologa L, Flood JF, Smith GE.
Effects of dehydroepiandrosterone and its
sulfate on brain tissue in culture and on
memory in mice. Brain Res. 1978; 406:357–
62.
3. Bologa L, Sharma J, Roberts E. 1987
Dehydroepiandrosterone, and its sulfated
derivative reduce neuronal death and enhance
astrocytic differentiation in brain cell cultures.
J Neurosci Res.1987; 17:225–34
4. Wolkowitz,
Owen
M.,
et
al.
Dehydroepiandrosterone (DHEA) treatment of
depression. Biological Psychiatry.1997; 41(3):
311-18.
5. Debonnel G, Bergeron R, and de Montigny C.
Potentiation by dehydroepiandrosterone of the
neuronal response to N-methyl-D-aspartate in
the CA3 region of the rat dorsal hippocampus:
105
Rathna et al.,
Int J Med res Health Sci. 2013; 2(1):101-106
an effect mediated via sigma receptors.
Journal of Endocrinology 1996;150:S33-42.
6. Kimonides VG, Khatibi NH, Svendsen CN,
Sofroniew
MV,
Herbert
J.
Dehydroepiandrosterone (DHEA) and DHEAsulfate (DHEAS) protect hippocampal
neurons against excitatory amino acid-induced
neurotoxicity. Proceedings of the National
Academy of Sciences USA 1998; 95:1852-57.
7. Blauer KL, Poth M, Rogers WM, Bernton
EW. Dehydroepiandrosterone antagonises the
suppressive effects of dexamethasone on
lymphocyte proliferation. Endocrinology
1991; 129:3174-79.
8. Lupien SJ, de Leon M, de Santi S, Convit A,
Tarshish C, Nair NPV. Cortisol levels during
human aging predict hippocampal atrophy and
memory deficits. Nature Neuroscience 1998;
1(1):69-73.
9. Herbert J. Stress, the brain, and mental illness.
BMJ 1997; 315:530-35.
10. Hillen T, Lun A, Reischies FM, Borchelt M,
Steinhagen TE, Schaub RT. DHEA-S plasma
levels and incidence of Alzheimer's disease.
Biological Psychiatry 2000; 47(2):161-163.
11. Baulieu EE, Robel P. Dehydroepiandrosterone
and dehydroepiandrosterone Sulfate as
neuroactive neurosteroids. J Endocrinol 1996;
150:S221–39
12. Bergeron R, Montigny CD, Debonnel G.
Potentiation of neuronal NMDA response
induced by dehydroepiandrosterone and its
suppression by progesterone: effects mediated
by sigma receptors. J Neurosci 1996;
16(3):1193–202.
13. Wolf OT, Neumann O, Hellhammer DH,
Geiben AC, Strasburger CJ, Dressendorfer
RA, et al. Effects of a 2-week physiological
dehydroepiandrosterone
substitution
on
cognitive performance and well-being in
healthy elderly women and men. J Clin
Endocrinol Metab 1997; 82(7):2363–67.
14. Hillen, Thomas, et al. DHEA-S plasma levels
and incidence of Alzheimer’s disease.
Biological psychiatry.2000; 47(2): 161-63.
15. Davis SR, Shah S, McKenzie D, Kulkarni J,
Davison S, Bell R. Dehydroepiandrosterone
Sulfate Levels Are Associated with More
Favorable Cognitive Function in Women.
Clinical Endocrinology and Metabolism 2008;
93(3):801–08.
16. Mioshi, Eneida, et al. The Addenbrooke's
Cognitive Examination Revised (ACE‐R): a
brief cognitive test battery for dementia
screening. International journal of geriatric
psychiatry. 2006; 21(11): 1078-85.
106
Rathna et al.,
Int J Med res Health Sci. 2013; 2(1):101-106
International Journal of Medical Research
&
Health Sciences
www.ijmrhs.com Volume 2 Issue 1Jan-Mar 2013 Coden: IJMRHS Copyright @2013 ISSN: 2319-5886
Received:2 nd Dec 2012
Revised: 20 th Dec 2012
Accepted: 25 th Dec 2012
Review article
TRANSGENIC ANIMALS AND THEIR APPLICATION IN MEDICINE
*Bagle TR1, Kunkulol RR2, Baig MS3, More SY4.
1
Assistant Professor, 2 Associate Professor, Department of Pharmacology, Pravara Institute of Medical
Sciences-Deemed University(PIMS-D), Loni, Maharashtra.-413736.
3
Assistant Professor, Government Medical College, Aurangabad, Maharashtra. 431001
4
Research Student, Department of Pharmaceutical Chemistry, Prin.K.M.Kundnani College of Pharmacy,
Colaba, Mumbai, Maharashtra.400005.
*Corresponding author email: tusharbagle@gmail.com
ABSTRACT
Transgenic animals are animals that are genetically altered to have traits that mimic symptoms of specific
human pathologies. They provide genetic models of various human diseases which are important in
understanding disease and developing new targets. In early 1980 Gordon and co-workers described the first
gene addition experiment using the microinjection technology and since then the impact of transgenic
technology on basic research has been significant. Within 20 years of its inception, ATryn the first drug
approved by USFDA from transgenic animals was developed and it has opened door to drugs from
transgenic animals. In addition, they are looked upon as potential future donors for xenotransplantation.
With increasing knowledge about the genetics and improvements in the transgenetic technology numerous
useful applications like biologically safe new-generation drugs based on human regulatory proteins are
being developed.Various aspects of concern in the coming years are the regulatory guidelines, ethical issues
and patents related to the use of transgenic animals. This modern medicine is on the threshold of a
pharmacological revolution. Use of transgenic animals will provide solutions for drug research,
xenotransplantation, clinical trials and will prove to be a new insight in drug development.
Keywords: Transgenic animals, Xenotransplantation, Ethics, Patent.
INTRODUCTION
With the advent of transgenic technology and its
application in many laboratories around the world,
there is an increase in the generation and use of
genetically modified animals in biomedical,
pharmaceutical research and safety testing. This
development has been additionally accelerated by
the decoding the genome of man, mouse and rat.1
Pharmaceutical companies are faced with the
challenge that about 10% of compounds tested in
clinical trials make to the market and, out of these,
a minority will generate significant profit. The cost
107
Bagle TR et al.,
Int J Med Res Health Sci. 2012;2(1):107-116
of identifying new drug is immense, about United
States (US) $ 800 million and 80% of this cost is
spent in clinical trials and development.
Transgenic technology has potential to influence
the attrition rate in pharmaceutical research by
increasing the quality of both targets and
compounds. 2
To date most of the medicines are synthetically
produced and will continue in future. However, the
challenge for the pharmaceutical industry is the
development of ‘Biotech medicines’ which include
therapeutic proteins such as enzymes and
antibodies. 3 The global market for recombinant
proteins from domestic animals is expected to
exceed US$1 billion in 2008 and reach US$18. 6
billion in 2013.4 The two major animal systems of
production are pharmaceutical proteins in milk and
egg white from transgenic animals. 1
Since the first transgenic mice were generated in
1982, transgenic animal models have been used
extensively to investigate biomedical important
mechanisms underlying a variety of diseases, to
develop and evaluate new therapies. 5 Thus
transgenic animals have the ability to fulfill the
needs of the pharmaceutical industry and in
coming years they are looked as potential
contributors to the drugs and research in medicine.
Making of Transgenic Animals
There are three types of laboratory animal models
mentioned in the literature. They are spontaneous,
induced and transgenic. Spontaneous models shape
up as a result of naturally occurring mutations.
Induced models are produced by a laboratory
procedure like administration of a drug or
chemicals, feeding of special diets or surgical
procedure. The third category includes transgenic
models.6Transgenic refers to insertion of cDNA
(complimentary deoxyribonucleic acid) made from
specific mRNA (messenger ribonucleic acid) into
cells.7 A transgenic animal is defined as an animal
which is altered by the introduction of recombinant
DNA through human intervention. 8
Following sequence is generally adopted for the
development of transgenic animals irrespective of
species: 1, 9
Identification and construction of the foreign
gene and any promoter sequences
Introduction of DNA directly into the
pronucleus of a single fertilized egg by various
methods
Implantation of these engineered cells into
surrogate mothers
Bringing the developing embryo to term,
proving that the foreign DNA has been stably
and heritably incorporated into the DNA of at
least some of the newborn offspring.
Demonstrating that the gene is regulated well
enough to function in its new environment.
The foreign DNA can be inserted into the
pronucleus or cytoplasm of the embryo using
microinjections or transposon. Other methods of
DNA transfer are by lentivirus, sperms, pluripotent
cells and cloning. The last three methods allow
random gene addition and targeted gene integration
via homologous recombination
or gene
1,6
replacement thus causing mutation.
Targeted
mutation refers to a process whereby a specific
gene (removal of a gene or part of a gene) is made
nonfunctional (knocked-out) or less frequently
made functional (knocked-in). 4, 7 A transgenic
organism carrying more than one transgenes is
known as multiple transgenic. 4These methods do
not create new species, but only offer tools for
producing new strains of animals that carry novel
genetic information. 10
Transgenic Animal models of various diseases
An animal model is a living, non-human animal
used for research and investigation of human
disease, for the purpose of better understanding the
disease without the added risk of causing harm to a
human being during the entire drug discovery and
development process. Transgenic animal models
are created by the insertion of a particular human
DNA into fertilized oocytes which are then
allowed to develop to term by implantation into the
oviducts of pseudo pregnant females.6 There are
108
Bagle TR et al.,
Int J Med Res Health Sci. 2012;2(1):107-116
different models of transgenic animals for various
diseases.
A.
Human Immunodeficiency Virus/ Acquired
Immunodeficiency Syndrome (HIV/AIDS):
Tg26 HIVAN Mouse Model was the first
transgenic model developed in 1991 for HIV.
Since than many models have developed,
Rosenstiel et al gives summary of 32 transgenic
murine HIVAN models developed. 11 These
transgenic animals can express HIV-1 proteins;
develop symptoms and immune deficiencies
similar to the manifestations of AIDS in humans. 12
Other models are AIDS Mouse and Smart Mouse. 6
B.
Alzheimer’s disease: No animal models
existed for the disease before transgenic
technology was employed. Immunization of
Amyloid precursor protein A42 in transgenic mice
showed that vaccination against Alzheimer’s
disease could have potential as a therapeutic
approach.2, 6 Different animal models like
Alzheimer’s mouse, amyloid pathology mouse
models like PDAPP mice, Tg2576 mice, 13, 14 TAU
transgenic mouse models like ALZ7 mice, 7TauTg
mice and presenilin transgenic models like ApoE
knockout are developed to study Alzheimer’s
disease. 13, 15
C.
Cardiovascular disease: Various transgenic
animal models for gain and or loss of function of
angiotensin, endothelin, natriuretic peptides,
catechoalmines,
Calcium
binding-signaling,
sodium channel transporters, and nitric oxide
synthesis involved in cardiovascular regulation are
used to study cardiovascular diseases.16 Transgenic
models of heart failure and hypertrophy like Gene
overexpression of Calmodulin, Gene mutation of
alpha cardiac myosin heavy chain and Knockout
gene model of transforming growth factor are
developed.17 Mutation of the ApoE gene that is
critical for uptake of chylomicrons and very lowdensity lipoprotein particles, results in a model that
develops atherosclerotic lesions histologically
similar to those found in humans.2
D.
Diabetes Mellitus: Transgenic models are
developed for studying the genes, and their role in
peripheral insulin action. Models of insulin
Bagle TR et al.,
secretion such as glucokinase, islet amyloid
polypeptide, and hepatic glucose production in
type 2 diabetes are developed. 18A transgenic
mouse model that expressed Insulin Dependent
Diabetes Mellitus by inserting a viral gene in the
animal egg stage is also developed.19 There are
other models like beta receptor knockout mouse,
uncoupling protein (UCP1) knockout mouse,acute
and chronic models for the evaluation of
antidiabetic agents. 18, 20, 21, 22
E.
Angiogenesis:
Mouse
models
of
angiogenesis, arterial stenosis, atherosclerosis,
thrombosis, thrombolysis and bleeding addresses
techniques to evaluate vascular development.23
Inhibition of angiogenesis is currently one of the
biggest opportunities for new cancer therapies.
With the help of angiogenesis transgenic animal
models inhibitors are identified which act on
specific mechanisms of angiogenesis. 2
F.
Cancer diseases: Oncomouse was first
transgenic animal to be patented. Its germ cells and
somatic cells contain an activated human oncogene
sequence introduced into the animal at an early
embryonic stage to ensure that the oncogene is
present in all the animal cells.6 Mechanisms for
tumor progression and metastasis via E-cadherin,
and other adhesion molecules is possible by
various transgenic knockout models. 7
Transgenic animal models are used in the
assessment of mutagenicity, carcinogenicity and
tools for understanding metabolic enzymes and
receptors. 24 There are transgenic animal models
for mutagenicity assays approved by the World
Health organization like LACItransgenic model
(Big Blue® construct) and LACZ transgenic
model (Muta™Mouse construct). 25Variety of
transgenic animals have been generated by
different strategies in experimental immunotherapy
of cancer, each aims to activate different immune
system components. Some of them are transgenic
rodent models expressing tumor associated
antigens like MUC1 transgenic mice, Oncogene
transgenic mice to study immunotherapeutic
strategies, transgenic mice expressing immune
effector cell molecules like Fc-receptor transgenic
Int J Med Res Health Sci. 2012;2(1):107-116
109
mice 5 The preclinical transgenic model of Matrix
Metalloproteinase (MMP) inhibitors studies the
bioactive products of MMP and their possible
effects on cell physiology. 26 Animal models for
Huntington’s disease, skeletal muscle disease and
other diseases are also developed.27, 28
Disease models are needed in medicine so that one
can discover the targets for drug development.
Adding and deleting genes in these animals
provide them new properties that make them useful
for better understanding of disease or
manufacturing a cure. It is not ethical or safe to
perform the initial tests in humans, so transgenic
animals are used. As the testing of new vaccines
and drugs must first be performed on animals,
these disease models are indispensable. 6
Products from Transgenic Animals
Most transgenic species are studied for research
applications as well as potential commercial
pharmaceutical productively. Here are some of the
transgenic animals and their products in
development.
Goats: Monoclonal Antibodies (MAbs) , Ig fusion
proteins, tPA (tissue Plasminogen Activator),
ATryn (recombinant human antithrombin III) is the
first transgenic recombinant protein from
transgenic animal approved by the United States
Food and Drug Administration (USFDA) in
January 2009. 9,29
Chickens and Eggs: vaccines; interferons,
cytokines; Human Serum Albumin (HSA), insulin,
MAbs. 9
Pigs: organs for xenotransplantation, human
hemoglobin, human protein C. 9,30,31
Cows: Factors VIII and IX, protein C, recombinant
antithrombin III (rATIII), recombinant HSA, and
human milk protein. 9
Mice: expression of malaria protein for vaccine
development; MAbs, ATIII, beta interferon; cystic
fibrosis transmembrane regulator; Factor X, HSA,
tPA, myelin basic protein; prolactin; fibrinogen
and antineoplastic urinary protein. 9
Rabbits: recombinant human C1 inhibitor, human
erythropoietin, human alpha antitrypsin, human
interleukin 2, tPA, alpha glucosidase, and human
growth hormone. 9
Sheep: sheep milk includes fibrinogen (major
constituent, with thrombin and Factor XIII) human
Factor VII, Factor IX, activated protein C and
alpha-1-antitrypsin. 9,31
Other Species: Frogs, nematodes, and marine
invertebrates have been used to study various
promoter elements and gene transfer technology. 9
Currently in most pharmaceutical companies,
relatively large numbers of targets are validated to
varying extents and progressed to the high
throughput screening stage. The drugs acting on
these targets are then used in clinical trials where
the attrition rate is generally high, this makes it
extremely costly. It is believed that the greater use
of transgenic models could reduce the required
throughput for achieving success and thereby
significant impact on costs.10
Drugs from Transgenic Animals and Other
Applications:
Proteins started being used as pharmaceuticals in
the 1920s with insulin extracted from pig pancreas.
In the early 1980s, human insulin was prepared in
recombinant bacteria and is now used by most of
the diabetic patients. This success was limited as
bacteria cannot synthesize complex proteins such
as monoclonal antibodies or coagulation blood
factors that must be matured by post-translational
modifications to be active or stable in vivo. These
can be fully achieved only in mammalian cells
which can be cultured in fermenters or used in
living animals. Several transgenic animals can
produce recombinant proteins but presently two
systems started being implemented. The first is
milk of transgenic mammals and the second
system are chicken egg white. A variety of
recombinant proteins which includes antibodies,
vaccines, blood factors, hormones, growth factors,
cytokines, enzymes, milk proteins, collagen,
fibrinogen and others are being developed in
transgenic animals. 1,3,31
The mammary gland is the preferred production
site, because of the quantities of protein that can
110
Bagle TR et al.,
Int J Med Res Health Sci. 2012;2(1):107-116
be produced in this organ and established methods
for extraction and purification of these
proteins.Products derived from the mammary
gland of transgenic goats and sheep are ATIII, αantitrypsin and tPA. ATIII is employed for the
treatment of heparin-resistant patients undergoing
cardiopulmonary bypass. The enzyme αglucosidase from the milk of transgenic rabbits has
been successfully used for Pompe’s disease. 4, 31
Blood, seminal plasma, urine, silk gland and insect
larvae haemolymph are other theoretically possible
systems. Blood most of the time cannot store high
levels of recombinant proteins which are naturally
unstable also biologically active proteins in blood
may alter the health of the animals. Milk avoids
essentially these problems and is presently the
most mature systems to produce recombinant
proteins from transgenic organisms. Now
experiments validate egg white as a source of
foreign proteins including recombinant vaccines. 1,
31
Blood replacement
The current production system for blood products
is donated human blood, and this is limiting
because of disease concerns, lack of qualified
donors, and regulatory issues. Genetically
engineered animals, such as cattle carrying human
antibody genes which are able to produce human
polyclonal antibodies, have the potential to
provide a steady supply of polyclonal antibodies
for treatment of various infectious and medical
conditions like organ transplant rejection, cancer,
and autoimmune diseases and other diseases. 32
There are currently at least 33 different drugs in
clinical testing including several in pivotal trials
that contain variable regions from transgenic mice
encoded by human sequences. Also there are 17
therapeutic MAbs approved by the USFDA which
are in different phases of drug development. 33
Functional human haemoglobin has been produced
in transgenic swine. The transgenic protein
purified from the porcine blood showed oxygenbinding characteristics similar to natural human
haemoglobin but only a small proportion of
porcine red blood cells contained human form of
haemoglobin. 4
Xenotransplantation of porcine organs to human
patients
Today more than 250,000 people are alive only
because of the successful transplantation of an
appropriate human organ (allotransplantation).
However, progress in organ transplantation
technology has led to an acute shortage of
appropriate organs, and cadaveric or live organ
donation does not meet the demand. To close the
growing gap between demand and availability of
appropriate human organs, porcine xenografts from
domesticated pigs are considered to be the best
alternative.4
Essential
prerequisites
for
a
successful
4, 34
xenotransplantation are:
1. Prevention of transmission of zoonoses
2. Compatibility of the donor organs in anatomy
and physiology
3. Overcoming the immunological rejection of the
transplanted organ.
The immunological hurdles are:
(a) Hyperacute rejection response (HAR) occurs
within seconds or minutes.
(b) Acute vascular rejection occurs within days.
(c) Cellular rejection occurs within weeks after
transplantation.
(d) Chronic rejection is a complex immunological
process resulting in the rejection of the
transplanted organ after several years.
Due to demand and unavailability of appropriate
organs, xenotransplantation is considered as the
solution of choice. The pig seems to be the optimal
donor animal because their organs have a similar
size as human organs, porcine anatomy and
physiology is same and maintenance is possible at
high hygienic standards at relatively low costs. 34, 35
Two main strategies have been successfully
explored for long-term suppression of HAR, the
knockout of α-gal epitopes which are the antigenic
structures on the surface of the porcine cells that
cause HAR and synthesis of human complement
regulatory proteins in transgenic pigs. 31, 34, 36
111
Bagle TR et al.,
Int J Med Res Health Sci. 2012;2(1):107-116
Problems with drugs from transgenic animals:
Erythropoietin could not be expressed in the
mammary gland of transgenic cattle. The recovery
rates of Factor VIII protein were low. 34 Another
concern is leakage of a target protein into the
circulation by way of the mammary epithelial cells
and as measured by increased plasma levels of the
protein designed to be expressed only in the
animal’s milk. 9 There is also a risk of transmission
of infection from animal to man. 31 There are some
unique concerns such as premature lactational shut
down observed in some animals expressing
recombinant proteins in their mammary gland. 37
While there are problems associated with
transgenic animals, the benefit derived from them
is far superior and with the increase in technology
this could be solved.
Drugs from Transgenic Animals in Clinical
Trials
The approval of ATryn (rATIII) by USFDA has
opened gates for other drugs from transgenic
animals. 29 Recombinant C1 inhibitor produced in
the milk of transgenic rabbits has completed phase
III trials and is expected to receive registration. 4, 31
A topical antibiotic against Streptococcus mutans,
for prevention and treatment of dental caries, has
completed phase III trials. 34 Vaccine used in
Alzheimers disease has restored neurological
performance in the mice, and is currently in phase
II human clinical trials. 6α-Glucosidase from the
rabbit is in clinical trial phase II/III for Pompe’s
disease. 31, 34 Products such as α-anti-trypsinused
for cystic fibrosis, α-AT deficiency and tPA used
for coronary clots are currently in phase II/III
clinical trials and are expected to be on the market
within the next few years. 34
Ethics in Transgenic Animals
Genetic modification of micro-organisms and
plants has least concern with regards to ethics but
when it comes to genetic modification of animals
and particularly humans, more objections are
registered. There remains concern that with
advances in transgenic animal technologies the
number of animals used for research may actually
increase rather than reduced because of a wider
range of diseases and conditions. 38
Ethical concern with oncomouse is that it usually
suffers in order to collect relevant information,
which contradict the principles of animal
rights.6Adenopolyposis coli knock-out mutant
mice are clinically normal until the intestinal
polyps develop, after which mice become anemic
and lose weight. Each newly created transgenic
strain has the potential to cause poor health and
suffering in the animals hence measures need to be
undertaken to minimize animal suffering. 39
Other ethical concerns are breaching species
barriers and animal life should not be regarded as a
chemical product subject to genetic alteration and
patentable for economic benefit. Also genetic
engineering of animals interferes with the integrity
or telos of the animal. Telos is defined as the set of
needs and interests which are genetically based,
environmentally expressed, and which collectively
constitute or define the form of life or way of
living exhibited by that animal, and whose
fulfillment or thwarting matter to that animal. 37
In India attitude towards animals is tinged with
religious and ethical colour which makes religious
sentiments and public awareness necessary to be
taken in consideration.40 The 3R (Reduction,
Refinement, Replacement) aim to minimize pain
experienced
by
the
animals
used
in
29
experiments. Inspite of the problems listed above,
transgenic animals may represent a “refinement” in
comparison to some other traditional experimental
models of disease where animals bear a heavy load
of suffering. A genotype is an excellent model of
disease for selected body functions at the
molecular or cellular level while the corresponding
phenotype is completely healthy. Thus it becomes
necessary to consider the moral implications of
producing such a species as well as measures of
reducing animal suffering. 39
Patents on Transgenic animals
Patenting of animal models is the need of hour,
because it is an indispensable tool for screening of
novel molecule to various diseases. A human
112
Bagle TR et al.,
Int J Med Res Health Sci. 2012;2(1):107-116
pathological condition in animals is most important
to determine the therapeutic efficacy of novel
molecule. They allow facilitation of the screening
process to eliminate inactive moieties and assess
the pharmacologist to identify the therapeutic
potential and characterize the toxicological profile
of novel chemical or biological entities. 6
The two major aspects in granting patents to
animal model are morality and reproducibility. 6
Other concerns like restrictive licensing of the
patents can hinder transfer of knowledge. 41
Preclinical animal models are important in drug
discovery, because they lay the fundamental for
human trials. Patents remain one of the important
ways of recovery of the investments made by the
Pharmaceutical companies in research. The Indian
Patent Law section 3i and 3 j states that all the
surgical processes and animals are not patentable,
hence animal models are not patentable in India. If
the suitable amendments are made then animal
models can be patentable in India and it would
open novel vistas in the research arena in India. 6
Regulation in Transgenic Animals
Pharmaceutical research on animals in India
depends on Department of Biotechnology,
National
Institute
of
Immunology
and
Environment Protection Act. An Animal Welfare
Board is constituted, with a Committee for the
Control and Supervision of Experiments Animals
(CPCSEA) which is in charge of legal and ethical
aspects or animal research. General Guidelines on
caring for animals in research are in accordance
with the International Committee for Laboratory
Animal Science (ICLAS) Guidelines. However
there is no specific law or guidelines for cloned
and transgenic animals. In 2000, Indian Council of
Medical Research Report promotes transgenic
animal research as long as it would pursue a higher
scientific goal. 40, 42
With changes in the overall process of drug
discovery, US patents of animal models encourage
scientists in America and Europe to produce
animal models which are very close to human
disease and hence contribute significantly to the
process of drug discovery. 6 The Indian regulatory
authorities need to be prepared for such challenges
of ethics, regulation and patents in transgenic
animals.
Future prospects
Xenogenic cells, in particular from the pig, hold
great promise with regard to successful cell
therapy for human patients. Porcine islet cells
transplanted to diabetic patients has shown to be
partially functional over a period of time. Porcine
fetal neural cells have been transplanted into the
brain of patients suffering from Parkinson’s
disease, Huntington’s disease, stroke and focal
epilepsy. The advantages of porcine neural cells
over their human counterparts are the abundant
availability. 34The pig could be a useful model for
studying defects of growth-hormone releasing
hormone, which are implicated in conditions such
as Turner syndrome, hypochrondroplasia, and
intrauterine growth retardation.4
Eggs provide other non-invasive harvesting
medium. Significant quantities of two human
proteins, interferon beta-1a and a humanized
monoclonal antibody (miR24) were expressed in
the whites of eggs laid by transgenic hens. miR24
is being developed for malignant melanoma. 3
There are transgenic animals for the development
of unique biological materials like polymers based
on spider silks that may be useful as suture or
plastic materials in facial and orthopedic
restorative surgery. 43,37 It is impractical to obtain
sufficient quantities of plasma butylcholinesterase
(BChE)
to
treat
humans
exposed
to
organophosphorus agents in agriculture and
chemical warfare, the production of recombinant
BChE in milk of transgenic animals is under
investigation. 44 It is proven that the amount of
human antithrombin III obtained per year from
transgenic goats is equivalent to this resulting from
90,000 human blood samplings. 1 Thus transgenic
animals have the capacity of mass production and
an effective alternative to various human
byproducts.
Improvements
in
transgenic
technology include inducible gene expression,
113
Bagle TR et al.,
Int J Med Res Health Sci. 2012;2(1):107-116
artificial chromosomes and advancement in
nuclear transfer. 34, 45, 36
Emerging transgenic technologies: 4, 31, 45
Lentiviral transfection of oocytes and zygotes,
Chimera generation via injection of pluripotent
cells into blastocysts
Culture of spermatogonia and transplantation
into recipient males
Ribonucleic acid interference
Researchers are using transgenic animals to
develop therapies for a wide range of diseases
discussed above and other diseases like Anaemia,
Emphysema,
Haemophilia,
Malaria
and
3
Rheumatoid arthritis.
CONCLUSION
Major prerequisites for success and safety of
transgenic animals will be a continuous refinement
of reproductive biotechnologies. In coming years
genetically modified animals will play a significant
role in the field of biomedicine especially in drug
development,
animal
disease
models,
xenotransplantation, antibody production, gene
pharming and blood replacement. 4 The regulatory
aspects and ethics should be given due
consideration while using transgenic animals.
From research, pigs and transgenic animals derived
products like milk, eggs seems to be promising in
developments of therapeutic strategies. Drugs from
transgenic animals can minimize the attrition rate
in clinical trials by increasing the quality of the
target and compound combinations making the
transition from discovery into development.
Transgenic technology can impact at many points
in the discovery process, including target
identification and target validation. It also provides
models designed to alert researchers early to the
potential problems with drug metabolism and
toxicity which will help in providing better models
for human diseases. 2
Transgenic in general is a rapidly advancing field,
and within 20 years of its inception it has produced
the first USFDA approved drug for transgenic
animals. Thus the use of transgenic animals has the
capacity to overcome the current and future needs
in medicine and is now a necessity rather than a
matter of choice.
REFERENCES
1. Houdebine LM. Production of pharmaceutical
proteins by transgenic animals. Comparative
Immunology Microbiology and Infectious
Diseases. 2009;32:107-21
2. Snaith MR, Tornell J. The use of transgenic
systems in pharmaceutical research. Briefings
in Functional Genomics and Proteomics.2002;
1 (2): 119-30.
3. RDS: Understanding Animal Research in
medicine and coalition for medical progress.
Medical Advances And Animal Research The
contribution of Animal Sciences to the Medical
Revolution: Some Case Histories. [Serial on
the Internet]. 2007. [Cited 2012 Nov 21];
Available
from
http://www.protest.org.uk/MAAR.pdf
4. Niemann H, Kues W, Carnwath JW.
Transgenic farm animals: present and future.
Rev.sci.tech. Off. Int. Epiz. 2005;24(1):285-98
5. McLaughlin PMJ. Kroesen BJ, Harmsen MC.
Lou FMH. Cancer immunotherapy: insights
from transgenic animal models. Critical
reviews in Oncology/Hematology.2001; 40:5376
6. Kandhare AD, Raygude KS, Ghosh P, Gosavi
TP, Bodhankar SL. Patentability of Animal
Models: India and the Globe. International
Journal of Pharmaceutical and Biological
Archives. 2011; 2(4):1024-32.
7. Applied Research Ethics National Association.
Institutional Animal Care and Use Committee
Guidebook. [Homepage on the Internet]. 2002.
[Cited 2012 Oct05]. Available
from
http://grants.nih.gov/grants/olaw/guidebook.pd
f
8. United States Food and Drug Administration.
Points To Consider In The Manufacture And
Testing Of Therapeutic Products For Human
Use Derived From Transgenic Animals.
[Homepage on the Internet]. 1995. [cited 2012
114
Bagle TR et al.,
Int J Med Res Health Sci. 2012;2(1):107-116
Nov
05];
Available
from
http://www.fda.gov/downloads/BiologicsBlood
Vaccines/GuidanceComplianceRegulatoryInfor
mation/OtherRecommendationsforManufacture
rs/UCM153306.pdf
9. Volume with supplement: Montgomery A.
Transgenic animals walking bioreactors.
BioProcess International. 2004. 40-51.
10. Jube S, Borthakur D. Recent advances in food
biotechnology research. In: Hui YH, Nip W-K,
Nollet LML, Paliyath G, Sahlstrom S, Simpson
BK editors. Food Biochemistry and Food
Processing. Oxford: Blackwell Publishing,
2006; p 35-70.
11. Rosential P. Gharavi A, Agati VD. Klotman P.
Transgenic and Infectious Animal Models of
HIV-Associated Nephropathy. J Am Soc
Nephrol.2009; 20:2296-304.
12. Joshi PC. Guidot DM. HIV-1 transgene
expression in rats induces differential
expression of tumour necrosis factor alpha and
zinc transporters in the liver and the lung.
AIDS Research and Therapy. 2011;8(36):1-11.
13. Spires TL. Bradley TH. Transgenic Models of
Alzheimer’s disease: Learning from Animals.
The Journal of the American Society for
Experimental Neurotherapeutics.2005; 2 (3):
423-37.
14. Gotz J, Streffer JR, David D, Schild A,
Hoerndli F, Pennanen L etal. Transgenic
animal models of Alzheimer’s disease and
related disorders: histopathology, behaviour
and therapy. Molecular Psychiatry. 2004;
9:664-83.
15. Schenk D. Amyloid-β immunotherapy for
Alzheimer’s disease: the end of the beginning.
Nature Reviews/Neuroscience. 2002; 3:824-28.
16. Bader M, Bohnemeier H, Zollmann FS,
LockleyJones OE, Ganten D. Transgenic
animals in cardiovascular disease research.
Experimental Physiology.2000; 85(6):713-31.
17. Hasenfuss G. Animal models of human
cardiovascular disease, heart failure and
hypertrophy. Cardiovascular Research. 1998;
39:60-76.
18. Srinivasan K. Ramarao P. Animal models in
type 2 diabetes research: an overview. Indian J
Med Res. 2007; 125: 451-72.
19. Etuk EU. Animal models for studying diabetes
mellitus. Agri. Bio. J. N. Am. 2010; 1(2): 13034.
20. Henson MS. Timothy DO. Feline Models of
type 2 Diabetes Mellitus. ILAR Journal. 2006;
47(3):234-42.
21. Kumar S. Singh R. Vasudeva N. Sharma S.
acute and chronic animal models for the
evaluation
of
antidiabetic
agents.
Cardiovascular Diabetology. 2012; 11(9):1-13.
22. Eddouks M. Chattopadhyay, Zeggwagh NA.
Animal models as tools to investigate
antidiabetic and anti-inflammatory plants.
Evidence
based
Complementary
and
Alternative Medicine. 2012. 1-14.
23. Carmeliet P. Moons L. Collen D. Mouse
models of angiogenesis, arterial stenosis,
atherosclerosis and hemostasis. Cardiovascular
Research. 1998;39:8-33.
24. Boverhof DR. Chamberlain MP. Elcombe CR.
Gonzalez FJ. Heflich RH. Lya GH. Transgenic
animal models in Toxicology: Historical
Perspectives
and
Future
Outlook.
2011;121(2):207-33.
25. World Health Organization. Transgenic
Animal Mutagenicity Assays. [Homepage on
the Internet]. 2006. [cited 2012 Nov 03];
Available
from
http://www.inchem.org/documents/ ehc
/
ehc/ehc233.pdf
26. Pavlaki M, Zucker S. Matrix Metalloproteinase
inhibitors (MMPIs): The beginning of Phase I
or the termination of phase III clinical trials.
Cancer and metastasis reviews. 2003; 22:17703
27. Ramaswamy S. McBride JL, Kordower H.
Animal Models of Huntington’s Disease. ILAR
Journal. 2007; 48(4):356-73.
28. Horton WA. Skeletal development: insights
from targeting the mouse genome. Lancet.
2003; 362:560-69.
115
Bagle TR et al.,
Int J Med Res Health Sci. 2012;2(1):107-116
29. Ormandy EH. Dale J, Griffin G. Genetic
engineering of animals. Ethical issues,
including welfare concerns. CVJ.2011; 52:54452
30. Prather RS. Shen M, Dai Y. Genetically
modified Pigs for medicine and Agriculture.
Biotechnology and Genetic Engineering
Reviews. 2008; 25:245-66.
31. Hunter CV, Tiley LS, Sang HM. Development
in transgenic technology: applications for
medicine.
TRENDS
in
Molecular
Medicine.2005; 11 (6): 293-98.
32. Alison VE. Genetically Engineered Animals:
An overview. [Serial on the Internet]. 2008.
[Cited 2012 Nov 25]; Available
from
http://animalscience.ucdavis.edu/animalbiotech
/Outreach/Genetically_engineered_animals_ov
erview.pdf
33. Lonberg N. Human antibodies from transgenic
animals.
Nature
Biotechnology.
2005;23(9):1117-1125
34. Niemann H, Kues WA. Application of
transgenesis in livestock for agriculture and
biomedicine. Animal Reproduction Science.
2003;79:291-317.
35. Fung J, Rao A, Starzl T. Clinical trials and
Projected future of Liver Xenotransplantation.
World Journal of Surgery.1997; 21:956-61.
36. Cooper DK. Clinical Xenotransplantation-how
close are we?. Lancet. 2003; 362:557-59.
37. Alison LE. What is the future of animal
biotechnology?. California Agriculture. 2006;
60( 3):132-139.
38. Einsiedel EF. Public perceptions of Transgenic
animals. Rev. Sci. tech. Off. Int. Epiz. 2005;
24(1):149-157.
39. Special Issue: Mertens C, Rulicke T. Welfare
Assessment and Phenotype Characterisation of
Transgenic Mice. Altex. 2007;24: 46-48
40. Indian Council of Medical Research. The Use
of Animals in Scientific Research. [Homepage
on the Internet]. 2008. [Cited 2012 Dec 03];
Available
from
http:
//icmr.
nic.
in/bioethics/Animals_biomedical%20research.
pdf
Bagle TR et al.,
41. The Parliamentary Office of Science and
Technology. Biomedical Patents. [homepage
on the Internet]. 2012. [cited 2012 Dec 01];
Available
from http://www.parliament.uk/
Templates/BriefingPapers/Pages/BPPdfDownl
oad.aspx?bp-id=POST-PN-401
42. Rigaud N. OECD International Futures Project
on “The Bioeconomy to 2030: Designing
Policy Agenda”. Biotechnology: Ethical and
social debates. [homepage on the Internet].
2008. [cited 2012 Dec 01]; Available from
http://www.biotechnologie.de/BIO/Redaktion/
PDF/de/laenderfokus/indien-oecd-vollberichtmitanhang,property=pdf,bereich=bio,sprache=de,r
wb=true.pdf
43. Goldman IL, Kadulin SG, Razin SV.
Transgenic animals in medicine: Integrations
and expression of foreign genes, theoretical
and applied aspects. Med SciMonit. 2004;10
(11): RA274-285.
44. Huang YJ, Huang Y, Baldassarre H, Wang B,
Lazaris A, Leduc M. Recombinant Human
Butyrylcholinesterase from the milk of
transgenic animals to protect against
organophosphate poisoning. PNAS. 2007;
104(34):13603-13608.
45. Park F. Lentivirus vectors: are they the future
of animal transgenesis?. Physiol. Genomics.
2007; 31:159-173
116
Int J Med Res Health Sci. 2012;2(1):107-116
International Journal of Medical Research
&
Health Sciences
www.ijmrhs.com
Volume 2 Issue 1 Jan-Mar 2013
Coden: IJMRHS Copyright @2013 ISSN: 2319-5886
th
Received: 4 Dec 2012
Revised: 20th Dec 2012
Accepted: 26th Dec 2012
Case report
CASE OF CHOLEDOCHAL CYST PRESENTING AS PERFORATION ABDOMEN
Gobbur RH1, *Baradol RV 2, Nyammannavar3
1
Professor, 2Asst Professor, 3Asso Professor Dept. of Pediatrics, BLDEU’s Shri B M Patil Medical College,
Bijapur, Karnataka.
*Correspondence author email: ravikumar8901@gmail.com
ABSTRACT
Introduction: Choledochal cyst is an uncommon congenital anomaly of Hepoatobiliary system. It is a case
of choledocal cyst presenting as perforation and biliary ascites which is rare in infants. Clinical picture: An
infant was admitted at BLDE hospital with history of convulsion and breathlessness, on examination child
had abdominal distension. Investigations like erect X ray abdomen done which revealed ascites with
features of peritonitis, so exploratory laparotomy done which showed a choledochal cyst with perforation
causing biliary ascites. Treatment: Child was treated in the pediatric intensive care unit for convulsion.
Exploratory laparotomy done and the perforated choledochal cyst was sutured and drain placed in situ. The
child improved from 2nd post operative day. Conclusion: Choledochal cyst can present as perforation,
biliary ascites and peritonitis in infants. Therefore treatment should be oriented to this aspect also.
Keywords: Choledochal cyst, Bliary ascites
INTRODUCTION
Choledochal cysts are congenital bile duct
anomalies. These cystic dilatations of the biliary
tree can involve the extrahepatic biliary radicles,
the intrahepatic biliary radicles or both. Cystic
disorders of the bile ducts are rare entity but they
are well defined malformations of pancreatic
biliary systems involving intra hepatic bile ductile,
extra hepatic or both. No strong unifying etiologic
theory exists for choledochal cysts. The
pathogenesis is probably multifactorial1. In many
patients with choledochal cysts, an anomalous
junction between the common bile duct and the
pancreatic duct can be demonstrated. This
abnormal union allows pancreatic secretions to
reflux into the common bile duct, where the
pancreatic
proenzymes
become
activated,
damaging and weakening the bile duct wall.
Defects in epithelialization and recanalization of
the developing bile ducts and congenital weakness
of the ductal wall also have been implicated. The
result is the formation of a choledochal cyst.
Since Vaten first described the entity in 1723,
many cases have been reported worldwide. The
incidence in the western population is 1:100000 to
117
Gobbur RH et al
Int J Med Res Health Sci. 2013;2(1):117-120
1:150000 and in our population it is about 0.7% 2.
Choledochal cysts are three to four times more
common in females than in males3. Their origin is
unknown; however, they are considered
congenital.
These anomalies can be classified using various
systems. The most widely used subdivision of
choledochal cysts are Todani’s classification (Fig
1), which is a modification of the Alonso-Lej
classification4
Generally the patient with choledochal cyst
presents with cholestatic jaundice and abdominal
pain. A palpable abdominal mass may be found in
less than 20% of the cases. In adults, chronic and
intermittent abdominal pain is the most common
symptom. Children with choledochal cyst
generally present with the triad of abdominal pain,
abdominal mass and jaundice. Recurrent
cholangitis and jaundice may also occur5. A
choledochal cyst is rarely symptomatic, but should
be considered if dilatation of the bile duct or the
ampulla is demonstrated. Here we are presenting a
case of congenital choledocal cyst presented with
biliary ascites as a complication.
CASE
An infant, known case of seizure disorder was well
controlled on anticonvulsants like phenytoin and
valproate. This patient was brought into hospital
with c/o fever, convulsions, cough, breathlessness
and abdominal distension. On the 1 st day, the
patient was started on i.v. antibiotics like
Ceftriaxone and Azithromycin, Inj Deriphylline
was administered. Convulsions were well
controlled on anticonvulsants. All routine blood
and urine investigation along with chest X-ray
were done. Haemogram showed neutriphilia with
thrombocytosis. Haemoglobin was 12.8gm%.
Bleeding time & clotting time were 2 & 4.45 min
respectively. Serum sodium, potassium, chloride
and calcium levels were 150meq/lit, 3meq/lit, 114
meq/lit and 9.5 mg/dl respectively. All reports
were in normal range.
On 2nd day of admission there was progressive
distension of the abdomen causing respiratory
compromise. Emergency erects x-ray abdomen
was taken which showed dilated bowel loops with
features of peritonitis secondary to bowel
perforation (Free air under the diaphragm). The
child was taken for emergency explorative
laparotomy. Intraoperatively choledochal cyst with
perforation was found. Then the edges of
perforation were sutured. 1 liter of bilious fluid
was drained. Abdomen was closed with a drain in
situ.
Baby required ventilator support for 2 days and
was oxygen dependent for 7 days. Culture report
was found to be sterile. The child was put on
Piperacillin. As improvement was inadequate,
Meropenem was started on the 4th postoperative
day. The child showed improvement with a
spontaneous eye opening on the 4th post operative
day. Abdominal drain was removed on 5 th Post
operative day. RT is fed with milk was started on
6th POD. The child was afebrile, conscious and
comfortable by 9th POD. RT feeds was gradually
increased along with oral feeds.
DISCUSSION
This is the case report study of choledochal cyst
presenting as abdominal perforation which is an
uncommon complication and it is first reported by
Weber in 1934.11
Choledochal cysts are rare abnormalities of the
biliary tree. Choledochal cysts are generally
classified using Todani’s classification, which is as
follows;
Classification by Todani and co workers 4 (as
shown in figure no.1)
I: Dilatation of hepatic and common bile duct
(40% to 85%).
II: Diverticulum of the common bile duct (2%
to 3%).
III: Intraduodenal common bile duct dilatation
(1.4% to 5.6%).
IV: Intra- and extrahepatic bile duct dilatation
(18% to 20%).
V: Intrathepatic bile duct dilatation (Carolis
disease).
118
Gobbur RH et al
Int J Med Res Health Sci. 2013;2(1):117-120
Fig: 1. Types of choledochal cyst (Classification by Todani and coworkers)
Patients with choledochal cyst commonly present
with jaundice, abdominal pain and abdominal
mass. Infants frequently present with jaundice and
acholic stools. In early infancy, this may prompt a
work-up for biliary atresia. In addition, infants
with choledochal cysts often have a palpable mass
in the right upper quadrant of the abdomen,
accompanied with hepatomegaly. Children
diagnosed after infancy typically have a clinical
picture of intermittent biliary obstruction or
recurrent bouts of pancreatitis6.
The main diagnostic tool for detection of a
choledochal cyst, especially in childhood, is
ultrasonography. In adults, computer tomography
can confirm the diagnosis; however, endoscopic
retrograde cholangiography or magnetic resonance
cholangiography is the most valuable diagnostic
method and can accurately show cystic segments
of the biliary tree7.
Complications of choledochal cyst are mainly
ascending cholangitis, intrahepatic bile duct stones,
intrapancreatic terminal choledochal calculi,
pancreatic duct calculus, bowel obstruction,
cholangiocarcinoma, liver dysfunction and
pancreatitis8.
Surgery is the treatment of choice for a
choledochal cyst. Complete excision of all cystic
tissue is recommended because of the risk of
recurrent cholangitis and the high risk of malignant
degeneration9. Excision of the cyst and
reconstruction
of the
biliary
tree
by
choledochal/hepato-jejunostomy with a Roux-en
Y-loop is the standard procedure. Another
procedure includes excision of the distal common
bile duct, excision of the common hepatic duct,
dilatation of the intrahepatic bile duct,
intraoperative endoscopy10.
CONCLUSION
This case report study gives an idea of rare
presentation of choledochal cyst as perforative
abdomen with biliary ascites. So whenever a
patient of abdominal perforation presents,
choledochal cyst should keep in mind as a possible
cause of perforation. The patient should be treated
according to the cause of perforation.
119
Gobbur RH et al
Int J Med Res Health Sci. 2013;2(1):117-120
REFERENCES
1. Idress K, Ahrendt S. Cystic Disorders of Bile
Ducts. In: John L. Cameron, Andrew M.
Cameron, editors. Current surgical Therapy.
10 th edition 2010: Elsevier Publication; 353-57.
2. Singham J, Yoshida EM, Scudamore CH.
Choledochal cysts: part 1 of 3: classification
and pathogenesis. Can J Surg. Oct 2009;
52(5):434-40.
3. Shah OJ, Shera AH, Zargar SA, Shah P,
Robbani I, Dhar S, et al. Choledochal cysts in
children and adults with contrasting profiles:
11-year experience at a tertiary care center in
Kashmir. World
J
Surg.
Nov
2009;33(11):2403-11
4. Todani T, Watanabe Y, Narusue M, Tabuchi
K, Okajima K. Congenital bile duct cysts:
Classification, Operative procedures and
review of thirty seven cases. Am J Surg; Aug
1977: 34(2): 263-69
5. Ahmad
Rahmoony,
Basaam
Samawii.
Choledochal cyst in children an experience at
the Royal Medical Services; JRMS. Dec 2006;
13 (2): 67-70
6. Beata Jablonska. Biliary cysts: Etiology,
diagnosis and management. September 2012;
Volume 18,Issue 35: 4801-10
7. Kim MJ, Han SJ, Yoon CS, Kim JH, Oh JT,
Chung
KS
et
al.
Using
MR
cholangiopancreatography to reveal anomalous
pancreaticobiliary ductal union in infants and
children with choledochal cysts. AJR Am J
Roentgenol: 2002, 179: 209-214.
8. Nyamannawar B M, Das K. Spontaneous
infantile choledochal cyst perforation. Indian J
Pediatric; 2007; 74(3): 299-300.
9. Kobayashi S, Asano T, Yamasaki M,
Kenmochi T, Nakagohri T, Ochiai T. Risk of
bile duct carcinogenesis after excision of
extrahepatic bile ducts in pancreaticobiliary
maljunction. Surgery; 1999, 126: 939-44.
10. Treem W R, Hyams J S, Mc Gowman G S,
Sziklas J. Spontaneous rupture of a
choledochal cyst: clues to diagnosis and
etiology. J Pedatr Gastroenteraol Nutr.1991;
13(3):301-06.
11. Weber FP. Cystic dilatation of common
bile duct. Br J Chid Dis 1934, 31:27-29.
120
Gobbur RH et al
Int J Med Res Health Sci. 2013;2(1):117-120
International Journal of Medical Research
&
Health Sciences
www.ijmrhs.com Volume 2 Issue 1 Jan-Mar 2013 Coden: IJMRHS Copyright @2013 ISSN: 2319-5886
Received: 4thDec2012
Revised: 25th Dec 2012
Accepted: 29th Dec 2012
Case report
AN INTERESTING CASE OF COR PULMONALE
*Bagrecha Manish V1, Kunkulol Rahul R2
1
Post graduate student, Department of Medicine, Pravara Institute of Medical Sciences, Loni
Associate Professor, Department of Pharmacology, Secretary, Research cell, PIMS, Loni, Maharashtra
2
*Corresponding author email:manish.bagrecha@gmail.com
ABSTRACT
A 14 yrs old boy presented with a history of breathlessness since 1 yr which had increased from 2 days,
cough with expectoration and pedal edema since 7 days. In the past patient had history of kyphoscoliosis
since birth and had a history of repeated URTI. On examination he had tachycardia, tachypnea, raised JVP,
kyphoscoliosis, bilateral pitting edema. Respiratory auscultation revealed bilateral fine crepitations and
wheezes. On investigation haemoglobin: 14.6, T.L.C: 20,000,chest X-ray: kyphoscoliosis with
cardiomegaly. Clinical diagnosis of corpulmonale due to kyphoscoliosis was achieved and was confirmed
with 2D echo. ECG showed RVH. The patient was treated with oxygen, diuretics, antibiotics,
bronchodilators. Patient improved and was discharged on bronchodilators and was asymptomatic on follow
up.
Key words: Corpulmonale, Kyphoscoliosis.
INTRODUCTION
Kyphoscoliosis is a disorder characterized by
progressive deformity of Spine consisting of lateral
and posterior curvature.In majority, it is
of idiopathic etiology.
Deformity
results
in shortening
of
height.
Patients
can
be asymptomatic. Mobility of the chest wall is
impaired, the chest wall is stiff and lung volumes
are restricted. Hypoventilation can occur due to
small tidal volumes and increased dead space
Bagrecha et al.,
ventilation. V/Q mismatch leads to significant
hypoxia, and can progress to symptoms of
Corpulmonale.1Certain persons with longstanding
dorsal
kyphoscoliosis
develop
pulmonary
hypertension and corpulmonale. We had a young
patient presenting with the same. Respiratory
failure due to kyphoscoliosis, leading to
corpulmonale, has rarely been reported, in spite of
the fact that kyphoscoliosis is common. This fact
led us to report this case.2
Int J M ed Res Health Sci. 2013;2(1):121-123
121
CASE
A 14 yrs boy presented with a history of
breathlessness since 1 yr which was initially on
exertion but had increased to breathlessness at rest
since 2 days, cough with expectoration and pedal
edema since 7 days. In the past patient had
kyphoscoliosis since birth and had a history of
repeated URTI.
On examination he had tachycardia (120 bpm),
tachypnea
(28/min), raised
JVP
(6cm),
kyphoscoliosis, and bilateral pitting edema.
Respiratory ascultation revealed bilateral fine
crepitations and polyphonic wheezes. The cardiac
auscultation revealed loud P2 and there was also
evidence of ejection systolic murmur in pulmonary
area. On investigation haemoglobin: 14.6, T.L.C:
20,000/cmm, ABG was suggestive of type II
respiratory failure (pH 7.37,pO2 22mm Hg pCO2
52 mm Hg.,spo2:84%), 2D Echo showed severely
dilated RA and RV , grade III TR, severe
pulmonary hypertension 78mm Hg.
Fig:1. Chest X-ray showing Kyphoscoliosis with Cardiomegaly
Fig: 2. ECG was showing ‘P’ Pulmonale, right axis deviation and right ventricular hypertrophy
122
Bagrecha et al.,
Int J M ed Res Health Sci. 2013;2(1):121-123
Treatment
Controlled oxygen therapy, intermittent positive
pressure respiration, digitalis, diuretics, antibiotic,
bronchodilators (inhalational and intravenous).
The patient improved with treatment and was
discharged on bronchodilators and diuretics.
Follow up
The patient is doing well with bronchodilators and
diuretics.
DISCUSSION
Several pathophysiologic features contribute to
respiratory dysfunction in kyphoscoliosis.
Underlying problem is increased work of
breathing resulting from poorly compliant chest
wall. Distortion of chest wall causes under the
ventilation of some regions of lungs,
microatlectasis, ventilation perfusion mismatch
and hypoxemia. 3 Common complication of
kyphoscoliosis is pulmonary hypertension and
corpulmonale. Hypoxemia and hypercapnia are
important for the development of pulmonary
hypertension. However increased resistance of
pulmonary vessels results from compression
especially in areas where chest wall is distorted.
Exertional dyspnea is the most common symptom.
PFT shows decreased TLC, VC and FRC. Chronic
respiratory insufficiency and corpulmonale are the
end results of severe kyphoscoliosis, the level of
respiratory difficulty correlates with severity of
chest wall deformity.4Cor pulmonale
is
associated with kyphoscoliosis when the external
angle of the scoliosis is more than 100" and the
kyphosis is more than 20°, with a vital capacity
less than one liter5.
In contrast to chronic pulmonary emphysema, the
alveolar hypoventilation in kyphoscoliosis is due
to anatomic striction of the chest rather than to
bronchial obstruction and uneven distribution of
inspired air. The factors responsible for the
increased pulmonary resistance is believed to be
mechanical compression of the vascular bed,
anatomic thickening of the precapillary vessel
wall, and effects of hypoxemia. 6
ACKNOWLEDGEMENTS
Many thanks to Dr. Tewari SC, Prof&Head, Dept.
of Medicine for his guidance and encouragement.
REFERENCES
1. ChandrashekharA.,Kyphoscoliosis,www.med
dean.luc.edu/lumen/MedEd/medicine/pulmon
ar/diseases/pdis22.htm,Loyala
University
medical education network.
2. RL
Naeye.
CorPulmonale.
Kyphoscoliosis
American
and
journal
of
pathology, 1961;38 (5): 561-73
3. Steven EW, Barbar AC, Jess M: Principles of
pulmonarymedicine,
(ed)
Weinberger,
Cockrill, Mandel, Mosby Elsevier,5th edition
2008; 248-49.
4. Bergofsky EH, Turino GM, Fishman AP.
Cardiorespiratory failure in kyphoscoliosis.
Medicine. 1959; 38: 263-317
5. Wanderrnun KL, Gomein MS, Faber I, Cor
Pulmonale
Secondary
Kyphoscoliosis in
to
Marfan's
Severe
Syndrome.
Chest, 1975; 67 (2): 250-51.
6. Israel
Steinberg,
Corpulmonale
in
kyphoscoliosis, The American journal of
Roentgenology, radium
therapy
and
nuclear medicine, 1966;97 (3); 658-63
123
Bagrecha et al.,
Int J M ed Res Healt h Sci. 2013;2(1):121-123
Academia.edu no longer supports Internet Explorer.
To browse Academia.edu and the wider internet faster and more securely, please take a few seconds to upgrade your browser.
Related Papers

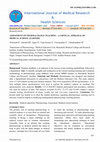
Download


Download
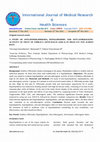
Download


Heart, Lung and Circulation, 2003
Download


Download

