International Studies Quarterly (2022) 0, 1–14
Capital Mobility and Taxation: State–Business Collusion in China
LING CHEN
Johns Hopkins University, USA
AND
Do more mobile firms pay lower taxes? Conventional wisdom argues that capital mobility creates downward pressure on
corporate taxes, as firms can threaten to exit. Nevertheless, empirical findings are highly mixed and hard to reconcile, partly
due to a lack of data at the microlevel. Using two comprehensive panel data sets with more than 780,000 Chinese firms
over two decades, we find that firms with higher shares of mobile capital pay higher effective tax rates. We contend that this
counterintuitive finding results from the strategic interaction between firms and governments. Knowing their vulnerability and
sunk cost, firms with more fixed assets were more active in protecting themselves by bribing and colluding with local officials.
Meanwhile, officials were more willing to seek bribes from these firms in exchange for tax cuts. In contrast, mobile firms were
disadvantaged. Although capital mobility may provide additional bargaining power, firms with fixed assets can overcome this
advantage through state–business collusion. Our quantitative and qualitative evidence show that fixed firms paid lower taxes
in cities with cozy government–business relations. However, such advantages decreased after the launch of anti-corruption
campaigns and in cities with higher fiscal transparency.
¿Las empresas más móviles pagan menos impuestos? La creencia popular sostiene que la movilidad del capital crea una presión
a la baja en los impuestos de sociedades, ya que las empresas pueden amenazar con irse. Sin embargo, los resultados empíricos
son muy variados y difíciles de conciliar, en parte debido a la falta de datos en el micronivel. Utilizando dos conjuntos de datos
de panel exhaustivos con más de 780 000 empresas chinas a lo largo de dos décadas, descubrimos que las empresas con mayor
proporción de capital móvil pagan tipos impositivos efectivos más altos. Consideramos que este hallazgo contraintuitivo se
debe a la interacción estratégica entre empresas y gobiernos. Conscientes de su vulnerabilidad y de los costos irrecuperables,
las empresas con más activos fijos fueron más dinámicas a la hora de protegerse mediante la práctica del cohecho y la colusión
con los funcionarios locales. Mientras tanto, los funcionarios estaban más dispuestos a conseguir sobornos de estas empresas
a cambio de reducciones de impuestos. Por el contrario, las empresas móviles estaban en desventaja. Aunque la movilidad
del capital puede proporcionar un poder de negociación adicional, las empresas con activos fijos pueden superar esta ventaja
mediante la colusión entre las empresas y el Estado. Nuestros datos cuantitativos y cualitativos demuestran que las empresas
fijas pagaron menos impuestos en las ciudades con relaciones estrechas entre el gobierno y las empresas. Sin embargo, estas
ventajas disminuyeron después del lanzamiento de las campañas anticorrupción y en las ciudades con mayor transparencia
fiscal.
Les entreprises plus mobiles paient-elles moins d’impôts? Les idées reçues soutiennent que la mobilité des capitaux crée
une pression à la baisse sur les impôts sur les sociétés, car les entreprises peuvent menacer de quitter un pays. Néanmoins,
les constatations empiriques sont très mitigées et difficiles à réconcilier, en partie en raison d’un manque de données au
niveau micro. Nous nous sommes appuyés sur deux jeux de données de panel complets comprenant plus de 780 000 entreprises chinoises sur deux décennies et nous avons constaté que les entreprises dont les parts de capitaux mobiles étaient
plus importantes payaient des taux d’imposition effectifs plus élevés. Nous soutenons que cette constatation contre-intuitive
résulte de l’interaction stratégique entre les entreprises et les gouvernements. Conscientes de leur vulnérabilité et de leurs
coûts irrécupérables, les entreprises disposant d’un plus grand nombre d’actifs fixes se sont protégées plus activement en
soudoyant et en s’entendant avec des fonctionnaires locaux. Dans le même temps, les fonctionnaires étaient davantage disposés à demander des pots-de-vin à ces entreprises en échange de réductions d’impôts. À l’inverse, les entreprises mobiles ont
été désavantagées. Bien que la mobilité des capitaux puisse offrir un pouvoir de négociation supplémentaire, les entreprises
disposant d’actifs fixes peuvent pallier cet avantage par le biais d’une collusion entre l’État et les entreprises. Nos preuves
quantitatives et qualitatives montrent que les entreprises fixes ont payé moins d’impôts dans les villes où les relations entre le
gouvernement et les entreprises étaient intimes. Toutefois, ces avantages ont diminué suite au lancement de campagnes de
lutte contre la corruption et dans les villes où la transparence fiscale est plus grande.
Ling Chen is an Assistant Professor in the School of Advanced International Studies at Johns Hopkins University. Her research interests lie in the political economy
and state–business relations of China, such as economic, tax, and industrial policies. She is also affiliated with the Fairbank Center at Harvard University as an Associate
in Research.
Florian M. Hollenbach is an Associate Professor in the Department of International Economics, Government, and Business at Copenhagen Business School. His
primary research interests are the political economy of taxation, state capacity, corruption, and the influence of money in politics. He is also in the steering committee
of the Anti-Corruption Data Collective, a new initiative bringing together journalists, data analysts, academics, and policy advocates to expose corruption in developed
countries.
Author’s note: The article was previously presented at the Meeting of the American Political Science Association in 2017, the Meeting of the Association for Asian
Studies in 2018, the Undemocratic Political Economy conference at the Western Political Science Association in 2018, and the Chinese Politics Mini-Conference at the
American Political Science Association meeting in 2021. We thank the editors and two anonymous reviewers, as well as Timm Betz, Iza Ding, Nate Jensen, Ding Li, Quan
Li, Weijia Li, Margaret Pearson, Amy Pond, David Steinberg, Juan Wang, Rachel Wellhausen, and Susan Whiting for very helpful comments. We also thank Kevin Acker,
Yufan Huang, Xiuyu Li, Yue Lin, Hao Zhang, and Yujin Zhang for their research assistance. All remaining errors are our own. The replication code underlying this article
is available on the ISQ Dataverse, at https://dataverse.harvard.edu/dataverse/isq. For questions concerning our data, please contact us directly.
Chen, Ling, and Florian M. Hollenbach. (2022) Capital Mobility and Taxation: State–Business Collusion in China. International Studies Quarterly,
https://doi.org/10.1093/isq/sqab096
© The Author(s) (2022). Published by Oxford University Press on behalf of the International Studies Association. This is an Open Access article distributed under the terms of the
Creative Commons Attribution License (https://creativecommons.org/licenses/by/4.0/), which permits unrestricted reuse, distribution, and reproduction in any medium,
provided the original work is properly cited.
Downloaded from https://academic.oup.com/isq/advance-article/doi/10.1093/isq/sqab096/6514648 by guest on 04 February 2022
FLORIAN M. HOLLENBACH
Government and Business, Copenhagen Business School, Denmark
�2
Capital Mobility and Taxation
Introduction
Government officials, meanwhile, also have more incentives to create connections with fixed asset firms. Officials
are more likely to offer tax cuts in exchange for bribery and
long-term economic benefits when they anticipate firms to
reside in their jurisdiction for a long time. On the other
hand, with more mobile firms, officials may become opportunistic and extract as much as they can through the already established channel of taxation. While mobile firms
may have some bargaining power, fixed asset firms can effectively overcome their own disadvantages in cozy state–
business environments. Only when state–business collusion
is substantially constrained, do mobile firms have significant
advantages over fixed asset firms.
We investigate our argument using two firm-level data sets
containing data on asset types and yearly tax payments. The
first data set is based on the China National Survey of Industrial Firms (CNSIF) and contains data on over 780,000 firms
in 477 Chinese cities between 1995 and 2007. As a second
source, we use the China Stock Market and Accounting Research
Database (CSMAR) for data on effective tax payments by
3,628 firms in 285 cities between 2009 and 2017. The two
data sets allow us to investigate the relationship between capital mobility and tax rates on two different samples of firms,
as well as two unique time periods.
Using these data, we first establish that the overall relationship between capital mobility and effective tax rates in
China is consistently positive across two different data sets
and several different empirical specifications. We then empirically explore the strategic interactions between governments and firms as a potential explanation for our findings,
drawing on quantitative and qualitative evidence.
First, we show that the relationship between capital mobility and effective tax rates differs by city-level government–
business relations. The advantage of fixed asset firms is
stronger in cities with better relations between firms and
city tax bureaus. Second, we present evidence that the
anti-corruption campaign launched by President Xi Jinping in 2013 has significantly weakened the relationship between mobility and effective tax rates, compared to the precampaign period. Xi’s campaign has substantially tightened
the control on government–business collusion and reduced
the options of government business interactions compared
to the pre-Xi period. As we show, more mobile firms paid
higher taxes before the anti-corruption campaign, but this
difference was significantly smaller after 2013, even when
accounting for firm fixed effects. Finally, we show that the
relationship between capital mobility and higher effective
tax rates only exists in cities with low fiscal transparency. In
cities with high fiscal transparency, the advantage of fixed
asset firms disappears.
Overall, our evidence suggests that when widespread
government–business collusion is allowed, fixed asset firms
have lower effective tax rates due to their commitment to
networking and building relationships with local governments. However, anti-corruption and pro-transparency reforms have constrained the choice of collusion, leveled the
playing field, and weakened the advantages of fixed asset
firms.
Our findings illustrate that when studying the relationship between capital mobility and taxation, we need to consider both the advantages and disadvantages of mobile and
fixed asset firms. The relationship is highly dependent on
firm–government interactions and the political and economic environment. The conventional wisdom about mobile firms’ advantages is not wrong in highly transparent
and clean settings, where state–business collusion through
bribery is constrained. Nevertheless, where government
Downloaded from https://academic.oup.com/isq/advance-article/doi/10.1093/isq/sqab096/6514648 by guest on 04 February 2022
Over the last half-century, political economists have grappled with the idea that capitalist countries’ power to
tax corporations is limited, with capital mobility being a
crucial constraining factor. Economic growth in capitalist
societies is dependent on the investment of private actors.
Even in closed economies, politicians have to trade off maximizing revenues and increasing taxes such that capital owners do not limit private investment. In other words, the state
is structurally dependent on capital (Przeworski and Wallerstein
1988). As capital becomes more mobile, capital owners can
threaten to move to other jurisdictions, further exerting
downward pressure on tax rates. Standard theoretical arguments, therefore, expect higher capital mobility to lead to
lower corporate tax rates.
This classic argument in political economy, however, has
both theoretical and empirical shortcomings. Theoretically,
the argument overlooks other strategic interactions between
firms and governments (Kim 2017). While capital mobility
can provide firms with more bargaining power under some
conditions, such mobility can also create disadvantages. Empirically, existing research has arrived at contradictory findings. While some studies confirm the conventional wisdom
that capital mobility and corporate taxes are inversely related, others cast doubt on such a claim and even find that
the reverse is true. The relationship between capital mobility and taxation varies considerably across contexts, with political and economic variables—ranging from regime type
to levels of economic development—playing a role. Therefore, one crucial challenge is to tease out the conditions in
which a negative relationship between capital mobility and
taxation may exist.
The difficulties in reconciling the mixed findings are
likely caused by the lack of comprehensive data at the microlevel. Much of the research investigating the relationship between capital mobility and tax rates has used countrylevel data on average or statutory tax rates, which can mask
key relationships among variables and are often weak predictors of effective tax rates. In contrast, we use comprehensive panel data sets with individual firms’ effective tax
rates across China. We test our argument at the firm level
in a single country, where local governments with high autonomy compete to attract and retain investments. This research design allows us to hold constant other potential
confounding factors, such as the political system. The finegrained data on each firm’s actual tax payments and total
profits allow us to calculate a yearly effective tax rate for each
firm instead of relying on statutory tax rates at the country
level.
In this context, we find that, contrary to conventional
expectations, firms with higher mobile capital shares pay
higher effective tax rates than firms with a higher proportion of fixed assets. We contend that this positive relationship between mobility and tax rates results from the strategic interactions between firms and governments under the
condition of state–business collusion instead of the conventional scenario of state–business bargaining. Firms with low
asset mobility are aware that they are vulnerable to predatory taxation. In exchange for tax reductions, they thus
spend extra effort in bribing and building connections with
government officials over the long run. Given the startup cost associated with fixed assets, these firms also have
stronger incentives to invest in such behavior. By contrast,
mobile firms may be more willing to pay higher taxes in the
short run and use their bargaining power instead of investing in long-term resources to build connections.
�LING CHEN
AND
FLORIAN M. HOLLENBACH
business collusion is prevalent, mobile firms may pay higher
costs, and fixed asset firms’ advantages may dominate.
Capital Mobility and Taxation
run and in areas beyond taxation. At the same time, government officials are much more likely to seek bribes and build
relations with firms with low mobility. Since fixed asset firms
are more dependent on local government officials for survival in the long run, these relationships are also more beneficial to government officials. Consequently, under certain
political and economic conditions, fixed asset firms can turn
their apparent disadvantages into advantages when competing over local fiscal policies.
Firms with higher capital mobility, in contrast, have fewer
barriers to move and have more bargaining power, according to conventional wisdom. However, when collusion is allowed, mobility also comes with disadvantages. For these
firms, it is less worthwhile to invest resources into building
relations as they are more likely to move in the future. Due
to lower relocation costs and shorter time horizons, mobile
firms are less active than fixed asset firms in terms of paying
bribes to public officials (Gauthier and Goyette 2014). Anticipating that mobile firms are less dependent on the government and less vulnerable, officials would also have fewer
incentives to seek bribes or establish new networks. Knowing that they may move, government officials would resort
to taxation, an already set-up institution of state extraction,
while firms are still in their jurisdiction.
Viewed in this light, the conventional theoretical expectation that capital mobility increases a firm’s bargaining power
over taxation is not necessarily wrong but requires essential
qualifications. One has to take firm–government interaction
and the political economic environment into full consideration, which determines the advantages and disadvantages
for mobile/fixed asset firms:
(1) In a context when state–business collusion is prevalent, as described above, the strategic interactions between firms and governments can reach an equilibrium that favors fixed asset firms rather than mobile
firms. While mobile firms can still threaten to exit,
such threat has less impact, as officials focus on colluding with fixed asset firms, which offer kickbacks and
side payments. This scenario is especially applicable
in countries where corruption and political connections are found to help reduce tax rates to the state’s
detriment, e.g., as has been noted for Brazil, Malaysia,
India, and Russia (Marjit, Mukherjee, and Mukherjee
2000; Tanzi and Davoodi 2000; Safavian, Graham, and
Gonzalez-Vega 2001; Adhikari, Derashid and Zhang
2006; Timmons and Garfias 2015; Hollenbach and
Silva 2019).
(2) By contrast, where fiscal transparency is high or
government–business collusion and corruption are significantly constrained, the conventional assumption
of state–business bargaining is more appropriate. In
this context, bribery, corruption, and government–
business relationships matter less, and fixed-asset firms
have few advantages. In the ideal scenario where corruption is impossible, mobile firms’ exit threats become salient in obtaining tax breaks. The mobile
firms’ exit would cause losses to the local economy,
pushing local officials to offer tax breaks to mobile
firms.
Placed in such a theoretical context, much of recent
Chinese history falls into the former scenario, where
government–business collusion and the guanxi network
have played crucial roles in shaping economic activities.
Given the limited channels for formal policy lobbying and
weak protection of property rights, businesses tend to bribe
public officials and resort to political connections (Pearson
Downloaded from https://academic.oup.com/isq/advance-article/doi/10.1093/isq/sqab096/6514648 by guest on 04 February 2022
Much theoretical work suggests that capital mobility constrains the extractive ability of the state and ought to lower
taxes on capital. To put simply, firms with mobile capital can
choose to exit in the face of higher tax rates. Increasing capital mobility should, therefore, exert downward pressure on
effective tax rates (Hirschman 1970) and may change distributive outcomes. All else equal, governments may attempt
to attract mobile capital by lowering taxes and providing investment incentives, which can result in a “race to the bottom” (Rodrik and van Ypersele 2001).
Even though this theoretical expectation is well known
and straightforward, the empirical results are mixed. On the
one hand, research suggests that capital mobility has indeed
shifted taxation from capital to labor, generating distributional consequences by lowering effective tax rates on capital and raising taxes on labor (Garrett 1995; Rodrik 1997;
Bretschger and Hettich 2002). Statutory corporate tax rates
have continuously fallen in Organization for Economic Cooperation and Development (OECD) countries since the
mid-1980s (Devereux, Griffith and Klemm 2002). On the
other hand, others question the supposed effect of globalization on tax competition, finding little support for a
race to the bottom for capital tax rates (Quinn 1997; Hays
2003; Basinger and Hallerberg 2004; Plümper, Troeger, and
Winner 2009).
Moreover, the relationship between capital mobility and
tax rates differs considerably across countries and regions, depending on factors such as resource endowment,
regime type, and level of economic development. Cai and
Treisman (2005) argue that countries’ resource endowments and levels of human capital determine whether the
competition to attract mobile capital constrains governments. Li (2006) and Genschel, Lierse, and Seelkopf (2016)
show that whether countries compete over mobile capital
via tax rates depends on their level of fiscal decentralization
and regime type. Jensen (2013) finds that while capital mobility may lower firms’ taxes in OECD countries, paradoxically, mobility raises tax rates in non-OECD countries with
US firms’ investments. Pond and Zafeiridou (2019) show
that when governments care about firm performance in financial markets, they prefer lower taxation for less mobile
firms to prop up their financial performance. The effect is
most prominent under democratic governance and broad
participation in the stock market.
How does one reconcile these different findings regarding the relationship between capital mobility and taxation? A growing body of work suggests that strategic interactions between governments and businesses can offer
a potential explanation. Firms with a high proportion of
fixed assets are more vulnerable to government extraction as they cannot easily move to another location (Cao
et al. 2021). Additionally, with higher start-up and thus
sunk costs, these firms face more extensive losses when
government intervention disrupts production (Johns and
Wellhausen 2020; Zhu and Deng 2021). Understanding
their disadvantages, these firms are more likely to actively
engage in bribery and corruption to protect themselves
from the extractive state. Recent studies found that fixed
assets are associated with higher levels of bribery and corruption, based on evidence in China, Vietnam, and Uganda
(Bai et al. 2019; Zhu and Deng 2021). Once firms establish
good relationships with the state, they benefit in the long
3
�4
Capital Mobility and Taxation
Research Design and Case Selection
China is now one of the world’s largest economies, where
state involvement and state–business relations play an important role. In the early 1980s, China decentralized its revenue system and increased fiscal autonomy at the local level.
The fiscal decentralization significantly incentivized local
governments to promote economic growth and generate
revenue sources (Shirk 1993; Oi 1999; Whiting 2001; Ong
2012). Although a 1994 reform reclaimed part of the revenue to the central government, most expenditures and the
responsibilities of tax collections remain at the local level
(National Bureau of Statistics 2015). Until the start of the Xi
regime, local governments had considerable discretion over
the offering of tax breaks before collecting taxes. At the
same time, the cadre evaluation systems of party and government officials create an essential institution of accountability from above, comparable to that of Vietnam (Jensen
and Malesky 2018). Higher-level officials evaluate the performance of lower-level officials based on local economic
indicators. These evaluations increase pressure on local
government officials to compete to attract investment and
to promote economic growth (Lü and Landry 2014; Jiang
2018; Chen and Zhang 2021). Since the 1990s, offering tax
breaks has become an essential tool for local governments to
draw investment and retain firms in their jurisdiction (Gao
2015; Zuo 2015; Chen 2018; Naughton 2018). While the
central government did not openly endorse this practice, it
allowed local governments to provide tax breaks based on
local conditions (yin di zhi yi). Several studies have noted the
impact of regional competition on offering tax breaks in
China (Cheng, Lin, and Simmons 2017; Xing, Cui, and Qu
2018).1
1
These policies, from 1990 to present, were later summarized in the catalog
of tax-break policies [see The State Tax Bureau of China (2015)].
In contrast, we still know little about how local government officials and businesses in China have used tax-break
policies to build mutually beneficial relationships and consolidate connections (Zheng 2006; Choi 2009; Chen 2018).
Local officials, generally underpaid, often sacrifice state revenue for personal benefits (Zhang 2021). The hundreds of
tax-break policies issued by the central government, which
generated even more policies at the local level, were hard to
monitor. The criteria for evaluating firms’ eligibility for tax
breaks were particularly flexible. A China National Audit Office investigation found that 98 percent of the investigated
counties had issued tax-break policies without central government approval, reducing tax revenues by more than 7 billion yuan.2 According to interviews, tax bureaus and other
government departments would often directly reach out to
firms (or tax companies with connections to firms) to seek
bribes and kickbacks and advertise such opportunities.3 At
the same time, firms actively seek help from local governments. While official application processes exist, it is nearly
impossible to stay on top of hundreds of policies or navigate approval through different government departments
without building networks with local tax bureaus. Nurturing and maintaining good relationships with local officials—
through cash, gifts, or banquets—are essential for firms to
“get things done” and receive approval within a realistic
time frame. As discussed above, both the officials and firms
have strong incentives to engage in this type of government–
business collusion, particularly when firms have a higher
proportion of fixed assets. In many of these firms, to facilitate the eventual implementation of tax breaks or exemption policies, specific personnel are employed to establish
and maintain good relations with the tax bureau and other
departments. For example, the representative for a company selling electric power equipment recalled being responsible for establishing connections with the government
department that issued tax-break policies (in this case, the
Development and Reform Commission). She would go to
the government office about twice a week to promise bribes
for a few months. After receiving initial approval, she had to
receive final support from the tax bureau and, therefore, repeated the procedure for another couple of months. When
the official notified her that the tax breaks were finally
“done,” the representative would go in person to deliver the
cash bribes to both the department and tax officials.4
As we show with additional examples below, long-term
government collusion is often established through repeated
interactions, making it more rational to invest in future bribing. By contrast, although mobile firms can also bribe officials, they tend to invest fewer resources and personnel
into doing so and do so less regularly. Moreover, while these
firms have in-house accountants or outsource tax issues to
external accountants, in contrast to fixed asset firms, they
often do not bother to set up special departments or allocate particular personnel in charge of government–business
relations.5 In a comparative context, the Chinese case is representative of a broader set of countries with a lack of fiscal
2
See China National Audit Office, http://www.audit.gov.cn/n5/n25/
c63597/content.html.
3
Interview with a tax bureau official, Sichuan, October 2009; interview with
an accountant in an equipment manufacturing firm, Jiangsu, March 2010. In addition, see Choi (2009).
4
Interview with a financial manager in an electric power equipment company,
Sichuan, November 2009. Earlier forms of bribing are often in cash; later ones
can often take the forms of reimbursement for business travel and entertainment
expenses (Cai, Fang, and Xu 2011).
5
Interview with a manager of a start-up information technology company,
Zhejiang, March 2010.
Downloaded from https://academic.oup.com/isq/advance-article/doi/10.1093/isq/sqab096/6514648 by guest on 04 February 2022
1997). The increased state–business connections play an essential role as an alternative way to obtain property rights
protection (Tsai 2007; Dickson 2008; Wang 2014; Truex
2016; Hou 2019; Zhu and Shi 2019). At the same time, taxation is one of the most important areas for state–business
collusion. Businesses often prepare their bribes well before
the tax season or attend various banquets with local officials. In exchange, officials offer tax breaks or turn a blind
eye toward tax evasion. As discussed above, such an environment made fixed asset firms more active in rent-seeking
than mobile firms. Therefore, we expect firms with a higher
proportion of fixed assets to be more likely to invest in
government–business collusion in China. Meanwhile, officials are more likely to offer tax cuts to those firms than to
more mobile firms.
That said, we also observe variations in government–
business interactions across different periods and localities
in China. We use this variation to investigate our argument
within the same country. We expect fixed-asset firms’ advantages to be most salient in localities with cozy government–
business relations and less salient in areas of higher fiscal
transparency. Likewise, when the state cracks down on corruption and state–business collusion, firms and officials are
deprived of the full range of options for strategic interaction. In this case, mobile firms’ advantages increase. In the
following sections, we use fine-grained firm-level data combined with city-level variables and qualitative evidence to examine the empirical relationship between capital mobility
and taxation and uncover the mechanisms underlying such
a relationship.
�LING CHEN
AND
FLORIAN M. HOLLENBACH
Empirical Analysis
Before proceeding to our primary analysis, we first present
descriptive statistics of our dependent variable of interest: effective income tax rates. Following the standard calculation
for effective income tax rates in China (Liu and MartinezVazquez 2014), we calculate each firm’s yearly effective income tax rate by dividing the firm’s paid corporate income
taxes by its profits.8 The corporate income tax is one of the
primary revenue sources the Chinese government collects
6
Although economic data in China are often subject to manipulation by local
officials (Wallace 2016), the CNSIF data used here are collected directly at the
firm level.
7
Before 2008, China’s standard corporate income tax rate was 33 percent.
Rates for domestic firms were 27 percent for those with profits between 30,000
and 100,000 and 18 percent for those below 30,000. Foreign-invested firms’ rates
were set to 15 percent. In 2008, the standard corporate income tax rate was
changed to 25 percent for domestic and foreign firms. Given the time of its implementation, we do not include the year 2008 in either analysis. In both our data
sets, we control firms’ total profits and their ownership types.
8
We drop observations for firm years with zero or negative profits. We do so
for two reasons: (1) firms with zero or negative profits are pre-determined to pay
from firms. As noted above, crucial for our research design,
local officials have the authority to grant tax breaks on corporate income taxes for a wide range of reasons (Cheng,
Lin, and Simmons 2017; Xing, Cui, and Qu 2018).9
After calculating the effective income tax rate, we end up
with 2,024,432 observations from 1995 to 2007 for 784,267
unique firms in 477 cities across 40 industries (at two-digit
coding) in the national survey data. The left plot in figure 1
displays the density of effective income tax rates for values
between zero and one.10 We use the same method to plot
effective tax rates of firms in the stock market data in the
right plot of figure 1, which includes 22,012 total observations from 3,628 unique firms in 282 cities between 2009
and 2017.11 The two densities have peaks at different values,
which is unsurprising, given the different statutory corporate tax rates in the two time periods. Even though the National Tax Bureau set the standard statutory rates, figure 1
shows a wide range in actual income tax rates paid by firms.
Since both data sets include extremely uncommon values
on the effective income tax rate and a high number of zeros, we estimate statistical models on several transformations
of the dependent variable, including the original scale. Our
main results are based on our preferred measure: the winsorized effective income tax rate (Winsorized). Winsorizing
the dependent variables ensures that our inference is not
the result of extreme values in the dependent variable.12 In
addition, we create a binary variable that is coded zero for
firms paying no income tax and one for those firms that pay
positive income tax rates (Binary). Lastly, we estimate models on the original measure of effective tax rate (Untransformed).Tables A.1 and A.2 in the online appendix show the
summary statistics for all variables for the national firm survey and stock market data, respectively.
We measure our independent variable, capital mobility, as the ratio of mobile assets to the sum of mobile
and fixed assets owned by each firm in a given year, i.e.,
mobile assets
. We largely follow
capital mobility = fixed assets
+ mobile assets
Jensen (2013) on this measurement, which defines capital
mobility as the opposite of fixed assets. According to the
definition of the dataset, mobile capital or mobile assets are
“assets which can be cashed in or spent or consumed in an
operating cycle of one year or over one year, including cash,
all kinds of deposits, short-term investment, receivables,
advance payment, stock, etc.” In contrast, fixed assets are
defined as “the net value of fixed assets, clearance of fixed
assets, project under construction, fixed assets losses in
suspense.” The net value of fixed assets typically includes
property, plants, and any equipment and tools associated
with production and operation of the business.13
Given the observational nature of the data, we are concerned about potential omitted variables that might affect
the relationship between capital mobility and effective tax
rates. At the same time, for many of the potential conzero taxes even without tax breaks according to Chinese Corporate Income Tax
Law (see http://www.gov.cn/flfg/2007-03/19/content_554243.htm; (2) zeros or
negative values in the denominator create infinite or unreasonable effective tax
rates.
9
What we study here is different from tax evasion. A firm’s corporate income
tax is calculated by multiplying total profits with the given tax rate. Tax evasion
means firms under report profits; however, in this case, the effective tax rate remains legitimate.
10
There are 6,260 observations that fall out of this range and are not plotted
here.
11
Again, 815 observations fall out of this range and are not plotted.
12
Specifically, we set values below the 2.5th percentile and above the 97.5th
percentile to the 2.5th or 97.5th percentile value.
13
See the definition of these concepts by National Statistics Bureau at
http://www.stats.gov.cn/tjsj/ ndsj/2011/html/zb14.htm.
Downloaded from https://academic.oup.com/isq/advance-article/doi/10.1093/isq/sqab096/6514648 by guest on 04 February 2022
transparency, e.g., Brazil and India. In many of these cases,
government–business collusion is vital for tax breaks at the
local level with fiscal decentralization (Marjit, Mukherjee,
and Mukherjee 2000; Hollenbach and Silva 2019). Furthermore, even in centralized tax systems, such as Russia and
Malaysia, tax collectors often seek bribes, and the “relational
based” ties between firms and politicians have reduced effective tax rates (Safavian, Graham, and Gonzalez-Vega 2001;
Adhikari, Derashid, and Zhang 2006).
We have assembled two large firm-level panel data sets
to systematically investigate the relationship between capital mobility and taxation, including firm characteristics and
actual tax payments. The first set of data comes from the
CNSIF and cover the years 1995 to 2007. The survey was
taken by the State Economic Census Center of the National
Bureau of Statistics (NBS) and includes microlevel data of
all above-scale industrial firms (with sales above 5 million
yuan) across the entire jurisdictions of mainland China,
covering about 2 million observations.6 As a second data
set, we use firm-level data from the CSMAR, which includes
all publicly listed firms from 2009 to 2017 (about 24, 000
observations).
The two data sets allow us to investigate the relationship between capital mobility and taxation with fine-grained
firm-level data in China. The within-country research design
accounts for potential confounding factors at the country
level, such as differences due to institutional or legal environments. Additionally, both data sets allow us to calculate the effective tax rates based on taxes paid and profits
earned, taking into account any tax rebates, tax breaks, or
special rates.
We study two different periods in the two data sets to ensure policy consistency within each sample. China implemented a fiscal reform in 1994 and a corporate income tax
rate change in 2008. Based on data availability and to avoid
major policy disruption, we analyze the national survey data
from 1995 to 2007, after fiscal reform and before the corporate tax changes. In contrast, we analyze the stock market
data in the period after the corporate tax reform, i.e., from
2009 to 2017.7 The two data sets complement each other
in terms of time period covered and the sample of firms
included. In addition, as we further explain below, we also
use city-level variables as moderators in the capital mobility–
taxation relationship: (1) firms’ rating of relationships with
tax bureau officials and (2) cities’ fiscal transparency scores.
5
�6
Capital Mobility and Taxation
founders, the causal ordering is unclear, and their inclusion
could potentially induce post-treatment bias (Montgomery,
Nyhan, and Torres 2018). We, therefore, present a number
of models with different sets of covariates and fixed effects
included in the analysis.
We estimate a set of standard ordinary least squares
(OLS) models with different sets of fixed effects for both
data sets. First, we estimate a pair of bivariate models with
only our main variable of interest included: capital mobility.
In the second set of models, we add several covariates that
may influence the relationship between capital mobility and
effective tax rates. We include logged firm profits and total
assets, as companies with more mobile capital may also be
more profitable, subjecting them to different statutory tax
rates. Similarly, larger firms may be more mobile, profitable,
and may potentially have more bargaining power with city
bureaucracies. In the third set of models, we add covariates
for the share of exports in firms’ sales, logged total employment, and indicators for state-owned or foreign-invested enterprises. More export-oriented firms could profit from Chinese export promotion and exports may be related to capital
mobility. Foreign firms have a lower statutory tax rate than
domestic firms (state-owned or private), influencing their
effective tax rates. Given that firms are nested within cities,
we cluster standard errors at the city level.
We estimate a similar set of models with the same sets
of fixed effects for the models based on the stock market
data. First, we estimate bivariate models. Next, we control
only for profits (logged) and assets (logged). Lastly, we estimate models with covariates for profits (logged), total assets
(logged), research and development (R&D) expenditure as
the share of total operating costs (R&D intensity), logged
expenditure on employees, as well as ownership type. R&D
expenditure may be related to capital mobility and has been
promoted by the Chinese government through various industrial policies (Chen 2018).
We estimate the three models with different covariates
conditional on two sets of fixed effects. First, we only include
fixed effects for years and the city in which the firm is located. We include year fixed effects in case of domestic or
international events that influence firms’ behavior or local
economies. City fixed effects allow us to account for China’s
vast regional variation in implementing and adapting economic policies (Rithmire 2014). Second, we add additional
fixed effects for industry types (at the two digit-level industrial coding), as different industries are often subject to different tax policies. In total, we thus estimate six different
models for each dependent variable and its transformations.
Given that we are interested in the influence of capital
mobility and most firms’ level of capital mobility does not
significantly change over time, our main models focus on
the differences between firms within each city (and industry).14 The exception is our later model leveraging changes
before and after the anti-corruption campaign, where we include firm fixed effects similar to a difference-in-difference
design.
The Influence of Firm Mobility on Tax Rate
Table 1 shows the relationship between capital mobility and
the winsorized effective income tax rate based on data from
the national survey of industrial firms. Columns 1 and 2
present the estimates for the bivariate models with city/year
and city/year/industry fixed effects, respectively. The coefficient remains effectively unchanged if we add controls for
profits and total assets to these models (columns 3 and 4).
Similarly, adding covariates for exports, employment, and
ownership type does not change the coefficient estimate for
capital mobility (columns 5 and 6). In all six models, the
estimated coefficient on capital mobility is positive and statistically significant at the 1 percent level. Higher shares of
mobile capital are associated with higher effective tax rates.
To interpret the results substantively, consider the model
presented in column 5 in table 1. Here we include fixed effects for city and year, as well as the full set of controls. Holding all other variables constant, an increase in capital mobility from the median value for firms in Shanghai in 2000 to
the third quartile in that group (i.e., from 0.73 to 0.85) is
associated with half percentage point rise in the effective income tax rate (or a 16 percent increase in the tax rate).
The results in table 1 are based on the winsorized dependent variable. In the online appendix, we show the
14
Our main results are effectively unchanged if we include firm fixed effects.
For space reasons, we have not included these results.
Downloaded from https://academic.oup.com/isq/advance-article/doi/10.1093/isq/sqab096/6514648 by guest on 04 February 2022
Figure 1. Density of the effective income tax rates.
Note: The left plot shows the density of the effective income tax rate for the sample derived from the CNSIF for 1995–2007.
The right plot shows the density for the same variable calculated on data from the CSMAR for 2009–2017. Both data sets
contain a large number of firms who pay zero income tax, i.e., both densities spike at zero. At the same time, they display a
large variation in effective income taxes paid by firms.
�LING CHEN
AND
FLORIAN M. HOLLENBACH
7
Table 1. Effective income tax rate (national survey)
Winsorized
Capital mobility
(2)
(3)
(4)
(5)
(6)
0.039**
(0.003)
0.046**
(0.003)
0.042**
(0.003)
−0.001
(0.001)
0.007**
(0.001)
0.048**
(0.003)
−0.001
(0.001)
0.006**
(0.001)
0.046**
(0.003)
−0.001
(0.001)
0.008**
(0.001)
−0.000
(0.000)
0.005**
(0.000)
−0.098**
(0.006)
−0.007*
(0.003)
0.051**
(0.003)
−0.001
(0.001)
0.007**
(0.001)
0.000
(0.000)
0.006**
(0.000)
−0.095**
(0.006)
−0.013**
(0.003)
Yes
Yes
No
Yes
Yes
Yes
Yes
Yes
No
Yes
Yes
Yes
Yes
Yes
No
Yes
Yes
Yes
2,023,967
0.08
2,023,967
0.09
2,023,961
0.08
2,023,961
0.09
1,973,136
0.12
1,973,136
0.13
Profits (ln)
Assets (ln)
Export share
Employees (ln)
Foreign ownership
State ownership
City fixed effects
Year fixed effects
Industry fixed effects
N
Adjusted R2
Notes: Models estimated with standard errors clustered by city. * p < .05; ** p < .01.
The bold rows are emphasized as they are for main independent variables of interest.
same models for the effective tax rates on the original scale
(table A.3 in the online appendix) and the dichotomized
dependent variable (table A.4 in the online appendix).
Throughout all models and specifications of the dependent
variable, we find a positive and statistically significant association between effective income taxes and capital mobility.
With the untransformed dependent variable, the estimated
coefficient on capital mobility is slightly larger. For the
binary dependent variable, we consistently find evidence
that more mobile firms are more likely to pay a positive
effective income tax rate.
In addition to the city and year fixed effects, we estimate
models with the full set of controls for each of the three
dependent variables but with fixed effects for the interactions between city–year and city–year–industry. Table A.6 in
the online appendix shows the results when we add fixed effects for the city–year interaction, in the models presented
in Table A7 in the online appendix, we include fixed effects
for the city–year–industry interaction. Again, the coefficient
of capital mobility is effectively unchanged: Capital mobility
has a positive association with effective income tax rates.15
Table A.5 in the online appendix shows the results when we
estimate our main models (as in table 1) as random instead
of fixed effects models; results are virtually unchanged.
Next, we estimate a similar set of models using the stock
market data. Table 2 shows the estimated coefficients for
capital mobility with the winsorized effective income tax rate
from the stock market data as our dependent variable. As
with the data from the national survey, the coefficient for
capital mobility is generally positive in all six models.16 However, the estimated coefficient is quite small and rounds to
zero in the bivariate model with only city and year fixed effects (column 1).
15
Our results remain if we estimate models with the winsorized dependent
variable on yearly cross-sections and include city fixed effects. Capital mobility is
positively related to effective income tax rates for all years in the sample. Due to
space constraints, we have omitted these results.
16
Note that the stock market data is based on 2009–2017, when China erased
the different corporate tax rates between foreign and domestic firms.
Again, we also estimate these models on the untransformed and dichotomized effective income tax rate. In
models with the untransformed dependent variable, the
coefficient on capital mobility is larger but estimated with
substantially more uncertainty and not statistically significant (Table A.8 in the online appendix). This difference in
results can be traced to only about 170 of the almost 23,000
observations, with very extreme and unrealistic effective income tax rates. With the dichotomized dependent variable,
our main finding remains: firms with more mobile capital
are more likely to pay positive income tax rates (Table A.9
in the online appendix). Our main finding of a positive
relationship remains in models with fixed effects for the
interaction between city and year (Table A.11 in the online
appendix), when we include fixed effects for the city–year–
industry interaction (Table A.12 in the online appendix),
or if we estimate models with random intercepts instead of
fixed effects (Table A.10 in the online appendix). In general, results are quite consistent, with positive coefficient
estimates on capital mobility throughout.
State–Business Collusion as a Moderator
In the previous section, we examined the relationship between capital mobility and effective income tax rates using
two different samples of firm-level data from China. Contrary to conventional wisdom, we find a positive association between capital mobility and effective tax rates, which
challenges the standard assumption that mobile firms generally have advantages over fixed asset firms. Instead, our
results suggest a more complicated reality about the relationship between mobility and taxation. As discussed above,
a reason for this finding is the strategic interaction between firms and governments. Firms with more fixed capital
tend to have advantages under the conditions of constant
government–business collusion. In this section, we further
untangle the mechanisms using qualitative and quantitative
evidence.
Downloaded from https://academic.oup.com/isq/advance-article/doi/10.1093/isq/sqab096/6514648 by guest on 04 February 2022
(1)
�8
Capital Mobility and Taxation
Table 2. Effective income tax rate (stock market data)
Winsorized
Capital mobility
(2)
(3)
(4)
(5)
(6)
0.001
(0.009)
0.017
(0.009)
0.031**
(0.008)
−0.021**
(0.002)
0.035**
(0.002)
0.045**
(0.008)
−0.022**
(0.002)
0.029**
(0.002)
0.036**
(0.009)
−0.019**
(0.002)
0.034**
(0.003)
−0.136**
(0.033)
−0.005**
(0.001)
0.012
(0.013)
0.018*
(0.008)
−0.003
(0.006)
0.049**
(0.009)
−0.022**
(0.002)
0.028**
(0.003)
−0.048
(0.030)
−0.000
(0.001)
0.003
(0.011)
0.013*
(0.006)
0.002
(0.005)
Yes
Yes
No
Yes
Yes
Yes
Yes
Yes
No
Yes
Yes
Yes
Yes
Yes
No
Yes
Yes
Yes
20,945
0.04
20,945
0.15
20,945
0.09
20,945
0.18
15,570
0.10
15,570
0.18
Profits (ln)
Assets (ln)
R&D intensity
Employee benefits (ln)
Foreign ownership
State ownership
Private ownership
City fixed effects
Year fixed effects
Industry fixed effects
N
Adjusted R2
Note: Models estimated with standard errors clustered by city. * p < .05; ** p < .01
The bold rows are emphasized as they are for main independent variables of interest.
Qualitative evidence suggests that firms with a lower degree of mobility, i.e., a higher proportion of fixed assets, are
significantly more likely to invest in political connections to
acquire tax breaks. Moreover, these firms are more likely
to be the targets of public officials seeking gifts. Many of
these businesses rely on natural resource extraction, such
as coal, petroleum, power generation, and mining, where
the location of these resources is geographically constraining and where firms have to interact with government officials intensively to gain access to resources and land. For
example, a coal mining company in the Tongliang county
of Chongqing city with a fixed asset share of 85 percent
was caught bribing a local official with 147,000 yuan. Before the arrest of the official and the firm’s closure, the
company enjoyed an average income tax rate of 10 percent
since its establishment in 2005.17 Similarly, a steel company
in the Liaocheng City of Shandong Province, with a fixed
asset share of 83 percent, had been paying an effective income tax rate of about 3 percent. Nevertheless, the company was on the list of “the top 100 taxpaying companies” in
Liaocheng.18 Liaocheng has recently gained unwanted attention due to an investigation into corruption, money embezzlement, and suicide by public officials.19
Other avenues for firms to gain influence exist as well.
Since its establishment in 1997, a real estate and software
company in Chengdu, Sichuan had successfully received tax
breaks. In the mid-2000s, however, a newly appointed official denied the firm’s qualification for the tax breaks based
on the policy’s restrictions concerning industry type. After
17
Authors’ calculation based on China National Survey of Industrial Firms.
Also, see the report by China Legal Daily at http://www.legaldaily.com.cn/
index/content/2012-05/25/content_3598724. htm?node=20908.
18
Authors’ calculation; also see records at the Tax Bureau of Liaocheng at
http://liaocheng.sd-n-tax.gov.cn/art/2007/11/6/art_22992_49102.html.
19
See, for example, the announcement by Shandong Central Commission for Discipline Inspection at http://www.sdjj.gov.cn/tbbg/201607/
t20160728_11244711.htm.
denial of the tax benefit, a previous colleague of the official
was given a well-paid position in the company. The former
official soon informed his old colleague in government that
the firm’s CEO was a member of the budget committee in
the local People’s Congress, who could influence the budget allocated to the government official’s office. In the end,
the firm was once again approved for the tax break policy.20
Firms with higher capital mobility are not constrained
to particular industries. They range from garments, shoes,
metal processing to auto parts and consumer electronics.
These firms have a higher ability to relocate. In their development, mobile firms are less tied down to local resources
such as mining or land and hence less vulnerable and dependent on local governments. They, therefore, tend to
have weaker incentives to invest resources in bribing, corruption, and networking with local governments. Anticipating that they may move, such investment may not be worth
it in the long run. Similarly, given that government officials
suspect that businesses may not remain in the locality in the
long run, they put less value in relationships with more mobile firms. They tend to take fewer risks engaging in collusion where bribes are exchanged for tax breaks. Not surprisingly, officials had not heard of or were much less familiar
with more mobile firms in their jurisdiction but knew most
fixed asset firms quite well.21
The qualitative evidence brought to bear here suggests a mechanism that links the capital mobility–taxation
relationship to the dynamics of firm–government strategic
interactions. Although each set of the firm-level data does
not allow us to test the proposition directly, we can leverage
the differences across Chinese cities and between different
periods to further investigate the potential mechanism.
20
Interviews with the manager and financial staff of a real estate and software
company, Sichuan, January 2009 and May 2019.
21
Interview with officials in the Bureau of Finance and Bureau of Commerce,
Jiangsu, April 2010.
Downloaded from https://academic.oup.com/isq/advance-article/doi/10.1093/isq/sqab096/6514648 by guest on 04 February 2022
(1)
�LING CHEN
AND
FLORIAN M. HOLLENBACH
First, to examine the potential role of political connections given the estimated relationship in the CNSIF survey,
we use data from the 2005 World Bank Investment Climate Survey (Enterprise Analysis Unit—World Bank Group
2005). The survey investigated various aspects of business–
government relations and was conducted across a sample of
firms in 123 cities in China. The survey included questions
about firms’ interaction with government agencies. We use
the firms’ survey responses about their perceived relationship with tax bureaus as an indicator for political connections at the city level, i.e., better relationships are indicative
of better political connections.
Based on survey responses, we create city-level measures
of government–business relationships for the 123 cities,
which we merge to the firm survey data for 2004 based on
firm locations. While imperfect, we would prefer a firm-level
measure of corruption, this allows us to investigate differences in firm behavior based on city averages. Specifically,
we aim to proxy the city-level environment for corruption
or government–business collusion with the measure of
firm–tax bureau relationships. If our conjecture about the
link between capital mobility, corruption, and tax rates
is correct, then we should observe this relationship play
out differently depending on the city context. We expect
the positive relationship between mobility and tax rates to
be particularly pronounced in cities with more prevalent
government–business collusion.
As a first indication that this is indeed the case, we plot
the bivariate association between firm-level capital mobility
and effective tax rates for two types of cities in figure 2.
In cities where the average relationship between firms and
tax bureaus is below (i.e., worse than) the median of the
tax bureau relationship variable, the bivariate association
is plotted in grey. In contrast, for firms in cities where the
average relationship is above the median, the bivariate
relationship is plotted in black. As the figure suggests, the
relationship between tax rates and mobility is stronger
in cities where government–business relations are better
(more collusion) than the median. In cities with worse
government–business relationships, the linear relationship
between mobility and tax rates is close to zero.
To estimate this potential mechanism using regression
analysis, we regress firms’ effective income tax rates on our
independent variable of interest (capital mobility) interacted with the city-level measure of the relationship between
firms and tax bureaus. We again include the three sets of covariates. In addition, models presented in columns 2, 4, and
6 include city fixed effects, which result in the constituent
term for the tax–bureau relationship to drop out. As table 3
shows, we find evidence in line with the proposed explanation. First, the constituent terms are in the expected direction. Capital mobility has a negative association with tax
rates in cities where relations with the tax bureau are worst,
i.e., when government–business collusion is low, more mobile firms pay lower taxes. At the same time, the constituent
term of our proxy for corruption environment is negative.
Most importantly, in line with the proposed explanation, we
find that the interaction between firm-level capital mobility and city-level firm–tax bureau relationship is positive and
statistically significant. Figure 3 shows the marginal effect of
capital mobility at different levels of city-level firm–tax bureau relationships (based on column 3 in table 3). More
mobile firms pay higher effective tax rates than firms with
more fixed assets in cities with better firm–tax bureau relationships (more collusion). In other words, firms with more
fixed assets pay lower taxes but only in cities with the potential for political connections. This finding holds true across
the full set of controls and if we include city fixed effect, i.e.,
when analyzing only within city variation. In the online appendix, we present results for models with city and industry
fixed effects (Table A.14 in the online appendix), fixed effects for the city–industry interaction (Table A.15 in the online appendix), and with random intercepts (Table A.13 in
the online appendix). Overall, the results are quite similar;
the interaction is always estimated to be positive.22
Anti-Corruption Campaign as a Tipping Point
In November 2012, President Xi Jinping took power in
China and subsequently launched a major anti-corruption
campaign in 2013, which continues to this day. The campaign aims to curb rampant corruption and government–
business collusion in China (Manion 2016). Along with the
campaign, in 2014, the State Council of the central government issued a “Notice on Clearing and Regulating Taxation and Other Preferential Policies,” which started a crackdown on local governments offering tax breaks based on
government–business collusion. Any such tax break would
now have to be inspected and approved by the State Council
of the central state (The State Council of China 2014). However, the central government later provided a grace period
to fend off potential lawsuits by businesses (The State Council of China 2015). The crackdown reduced the issuance of
illegitimate tax breaks based on government–business connections or bribery (Ye 2017). As a result, many bureaucrats
started avoiding direct contact with business owners. The
frequency with which public officials would attend banquets
with business leaders, another avenue for gifts or money to
be presented to public officials, sharply declined. Overall,
the campaign significantly changed how governments and
businesses interact (Ang 2020).
22
We have run the same regression models but using time spent with tax bureaus as the proxy for corruption potential. While we find a positive interaction
effect, the estimate is not significant when standard errors are clustered at the city
level. For space reasons, we have omitted those results.
Downloaded from https://academic.oup.com/isq/advance-article/doi/10.1093/isq/sqab096/6514648 by guest on 04 February 2022
Figure 2. Relationship between mobility and income tax
rates across cities.
Note: This figure shows the relationship between city average capital mobility and effective tax rates for cities with below and above median firm–tax bureau relationships. The
positive association between mobility and tax rates is only
present in cities with above median government–business
relationships (higher collusion).
9
�10
Capital Mobility and Taxation
Table 3. Effective income tax rate—relationship with tax bureaus (national survey)
Winsorized
Capital mobility
Relationship with tax bureau
Capital mobility × tax bureau
(2)
(3)
(4)
(5)
(6)
−0.126
(0.067)
−0.093**
(0.015)
0.045*
(0.019)
−0.098**
(0.036)
−0.100**
(0.037)
−0.110
(0.058)
−0.091**
(0.015)
0.044**
(0.016)
−0.007**
(0.001)
0.004**
(0.001)
0.012*
(0.005)
0.005*
(0.002)
−0.122**
(0.008)
−0.039**
(0.007)
−0.046
(0.042)
0.036**
(0.010)
−0.127*
(0.064)
−0.089**
(0.016)
0.044*
(0.018)
−0.009**
(0.002)
−0.001
(0.002)
0.023*
(0.012)
−0.007**
(0.001)
0.004**
(0.001)
−0.003
(0.004)
0.009**
(0.001)
−0.114**
(0.009)
−0.023**
(0.004)
No
Yes
No
Yes
No
Yes
165,423
0.01
165,423
0.09
165,423
0.02
165,423
0.10
165,168
0.11
165,168
0.17
Profits (ln)
Assets (ln)
0.036**
(0.010)
−0.009**
(0.001)
0.003
(0.002)
Exports (ln)
Employees (ln)
Foreign ownership
State ownership
City FE
N
Adjusted R2
Note: Models estimated with standard errors clustered by city. * p < .05, ** p < .01.
The bold rows are emphasized as they are for main independent variables of interest.
Figure 3. Marginal effect of capital mobility.
Note: This figure shows the marginal effect of capital mobility conditional on the city average score of firm–tax bureau
relationships. As the relationship between firms and the tax
bureau becomes cozier (higher scores), the estimated effect
of capital mobility is increasingly positive.
We use this anti-corruption campaign as a potential shock
to the system of corruption. Suppose the prevalence of
state-–business collusion and bribery is crucial in the relationship between capital mobility and firm taxation. In
that case, the relationship should change with the anticorruption campaign. To test this proposition, we use the
stock market data and estimate the same models as above
but interact our independent variables with an indicator
variable that is zero for the period from 2009 to 2013 (including) and one for years starting 2014 and afterward.
Table 4 presents the results regarding the interaction of
capital mobility with the post-2013 dummy when estimated
on the winsorized dependent variable. For these models,
estimating the effect of mobility in the pre- and post-anticorruption campaign periods, we alternatively include city
and year (columns 1, 3, 5) or firm and year fixed effects
(columns 2, 4, 6). In models with firm and year fixed effects, constant firm-level differences are absorbed, and we
can estimate how firms are affected differently before and
after the start of the anti-corruption campaign (similar to a
difference-in-differences design).
The positive and significant estimate for the constituent
term of capital mobility indicates the positive association in
the period until 2013. After the anti-corruption campaign
went into full effect in 2014, the relationship between capital mobility and effective income taxation is substantially
weaker. Depending on the specific model, the estimated
relationship is halved for the period after 2013. In general,
these results hold across all three of our dependent variables.23 The positive relationship between capital mobility
and tax rates disappears after the Chinese government
cracked down on local corruption and government–
business collusion. The advantage for firms with higher
shares of fixed assets is much smaller after 2013. These
results, especially where we include firm fixed effects, are
quite strong evidence for the idea that the anti-corruption
campaign significantly weakened the mechanism by which
fixed-asset firms gained an advantage over mobile firms.24
In table A.18 in the online appendix, we present the results
23
The estimates of the post-2013 interaction effect are generally robust to using the untransformed effective rate (table A.16 in the online appendix) or the
binary coding (table A.17 in the online appendix) as the dependent variable. In
some of the models without any control variables, we do find insignificant interaction effects.
24
These results generally remain the same if we interact all covariates with the
pre-/post-2013 interaction. Due to space constraints, we have not included those
results.
Downloaded from https://academic.oup.com/isq/advance-article/doi/10.1093/isq/sqab096/6514648 by guest on 04 February 2022
(1)
�LING CHEN
AND
FLORIAN M. HOLLENBACH
11
Table 4. Effective income tax rate (stock market data)—pre-/post-2013
Winsorized
Capital mobility
Capital mobility × post 2013
Profits (ln)
Assets (ln)
Assets (ln) × post 2013
(2)
(3)
(4)
(5)
(6)
0.010
(0.010)
−0.019*
(0.009)
−0.023**
(0.002)
0.002
(0.003)
0.037**
(0.003)
−0.003
(0.003)
0.033**
(0.013)
−0.016
(0.009)
−0.022**
(0.003)
−0.000
(0.003)
0.031**
(0.004)
0.001
(0.003)
0.043**
(0.009)
−0.024**
(0.009)
−0.022**
(0.002)
0.006
(0.004)
0.037**
(0.003)
−0.005
(0.004)
−0.190**
(0.030)
0.098**
(0.036)
−0.004**
(0.001)
−0.003
(0.001)
0.007
(0.012)
0.011
(0.016)
0.015
(0.009)
0.007
(0.009)
−0.002
(0.007)
−0.003
(0.009)
0.062**
(0.012)
−0.026**
(0.009)
−0.022**
(0.003)
0.004
(0.004)
0.034**
(0.005)
−0.001
(0.004)
−0.132*
(0.061)
0.035
(0.055)
−0.003
(0.002)
−0.003*
(0.002)
0.011
(0.021)
0.008
(0.016)
−0.001
(0.013)
0.006
(0.010)
0.008
(0.012)
−0.005
(0.009)
0.046**
(0.009)
−0.028*
(0.012)
0.047**
(0.013)
−0.025*
(0.010)
Yes
No
Yes
No
Yes
Yes
Yes
No
Yes
No
Yes
Yes
Yes
No
Yes
No
Yes
Yes
20,945
0.04
20,945
0.34
20,945
0.09
20,945
0.36
15,570
0.10
15,570
0.38
R&D intensity
R&D intensity × post 2013
Employee benefits (ln)
Employee benefits (ln) × post 2013
Foreign ownership
Foreign ownership × post 2013
State ownership
State ownership × post 2013
Private ownership
Private ownership × post 2013
City fixed effects
Firm fixed effects
Year fixed effects
N
Adjusted R2
Note: Models estimated with standard errors clustered by city. * p < .05; ** p < .01
The bold rows are emphasized as they are for main independent variables of interest.
when we interact our main independent variable with the
year fixed effects, i.e., estimating year-specific effects for
capital mobility. Alternatively, we interact capital mobility
and all covariates with the year fixed effects. To better visualize the results, figure 4 presents the coefficient estimates
for capital mobility from model 4 in table A.18 in the online
appendix. As one can see, the relationship between capital
mobility and effective tax rates becomes weaker over time.
In line with the initial grace period mentioned above, the
relationship first weakens and turns negative in 2016. We
do find a significant positive effect in 2014, likely due to the
fact that a grace period was offered. Thus, firms and local
officials rushed to get tax cuts done before the end of the
grace period.
As the last test of the potential mechanism outlined
above, we use a city-level measure of fiscal transparency as
a moderator of the capital mobility–taxation relationship.
As part of Xi’s effort to establish a more efficient market
and cleaning up the bureaucracy, the Third Plenum of the
18th Party Congress implemented the decision to increase
fiscal transparency in cities nationwide (China CCP Central
Committee 2013). Tax rates should be based strictly on rules
and laws rather than personal relations in more transparent
cities. If our argument is correct, we should see less of a positive relationship between mobility and effective tax rates in
more fiscally transparent cities. Additionally, and in accordance with the findings above, we should expect the interactive relationship between fiscal capacity and mobility to
matter less in later years as the anti-corruption crackdown
takes effect. We test this argument by merging the city fiscal
transparency index from the reports published by Tsinghua
University (Yu 2018) to the stock market data from 2014 to
2018.25
As table 5 shows, in line with our expectations, we find a
positive and significant effect of capital mobility for 2014,
while the interaction with fiscal transparency is negative
25
We used the final scores of fiscal transparency for each city and rescaled
each year’s full score to 100. For more information, see http://www.sppm.
tsinghua.edu.cn/xycbw/yjbg/.
Downloaded from https://academic.oup.com/isq/advance-article/doi/10.1093/isq/sqab096/6514648 by guest on 04 February 2022
Profits (ln) × post 2013
(1)
�12
Capital Mobility and Taxation
Figure 5. Marginal effect of capital mobility by fiscal transparency in 2014.
Note: This figure shows the marginal effect of capital mobility
conditional on the city’s fiscal transparency score for 2014.
As fiscal transparency increases (higher score), the positive
relationship between capital mobility and effective tax rates
disappears.
and significant. Figure 5 shows the marginal effect of capital mobility for 2014. As one can see, the positive relationship of capital mobility with effective tax rates decreases
with higher levels of fiscal transparency. Similar results are
true for 2015, but the relationship disappears in 2016 and
2017. At this point, the anti-corruption campaign had taken
full effect, and firms and officials nationwide were increasingly less likely to collude. Tables A.19 and A.20 in the
Table 5. Interaction with fiscal transparency (stock market data)
Winsorized
Capital mobility
Fiscal transparency (ln)
Capital mobility × transparency
Profits (ln)
Assets (ln)
R&D intensity
Employee benefits (ln)
Ownership other
Foreign ownership
State ownership
Private ownership
2014
2014
2015
2015
2016
2016
2017
2017
0.310**
(0.097)
0.034*
(0.016)
−0.071**
(0.025)
−0.035**
(0.003)
0.051**
(0.004)
−0.088
(0.076)
−0.005*
(0.002)
−0.349**
(0.073)
−0.309**
(0.071)
−0.325**
(0.073)
−0.342**
(0.071)
0.362**
(0.095)
0.251*
(0.106)
−0.029
(0.034)
−0.019
(0.019)
−0.029
(0.021)
0.263
(0.248)
0.042
(0.036)
−0.076
(0.060)
−0.045**
(0.008)
0.045**
(0.008)
−0.118
(0.051)
0.001
(0.003)
−0.137
(0.163)
−0.129
(0.159)
−0.143
(0.164)
−0.143
(0.161)
0.679
(0.395)
0.002
(0.020)
−0.025
(0.019)
−0.198
(0.247)
−0.025
(0.033)
0.040
(0.059)
−0.035**
(0.008)
0.044**
(0.008)
−0.029
(0.082)
−0.005
(0.003)
0.091
(0.153)
0.071
(0.153)
0.070
(0.155)
0.061
(0.151)
−0.322
(0.287)
0.041*
(0.017)
0.031*
(0.011)
0.011
(0.012)
0.196
(0.101)
0.019
(0.016)
−0.043
(0.024)
−0.043**
(0.003)
0.051**
(0.004)
−0.186*
(0.075)
−0.001
(0.002)
−0.190*
(0.070)
−0.154*
(0.070)
−0.163*
(0.068)
−0.190*
(0.068)
−0.083**
(0.025)
−0.036**
(0.003)
0.053**
(0.004)
−0.058
(0.078)
−0.005*
(0.002)
−0.056*
(0.025)
−0.043**
(0.004)
0.051**
(0.004)
−0.175*
(0.069)
−0.001
(0.002)
−0.026
(0.023)
0.069
(0.068)
−0.033**
(0.009)
0.040**
(0.010)
−0.020
(0.103)
−0.002
(0.004)
−0.170
(0.093)
−0.043**
(0.007)
0.042**
(0.008)
−0.122
(0.063)
0.003
(0.004)
0.020
(0.039)
0.003
(0.016)
0.002
(0.012)
City fixed effects
Year analyzed
No
2014
Yes
2014
No
2015
Yes
2015
No
2016
Yes
2016
No
2017
Yes
2017
N
Adjusted R2
2,142
0.78
2,142
0.79
2,237
0.79
2,237
0.80
774
0.76
774
0.78
610
0.79
610
0.79
Note: Models estimate d with standard errors clustered by city. * p < .05; ** p < .01.
The bold rows are emphasized as they are for main independent variables of interest.
Downloaded from https://academic.oup.com/isq/advance-article/doi/10.1093/isq/sqab096/6514648 by guest on 04 February 2022
Figure 4. Coefficient estimates for capital mobility by year.
Note: This figure shows the relationship between capital mobility and effective tax rates over time. The relationship
weakens after the beginning of the anti-corruption campaign and is estimated to be negative in 2016, though statistically insignificant.
�LING CHEN
AND
FLORIAN M. HOLLENBACH
Conclusion
In this paper, we investigate the relationship between capital
mobility and taxation in China. The case of China allows us
to examine the capital mobility–taxation relationship in an
important country with local tax competition, holding many
other covariates constant. Additionally, China is representative of a larger set of cases where effective tax rates at the
local level typically vary widely from the standard rates, as
firms and government officials collude to reduce tax rates.
Using two sets of firm-level panel data over two time periods, we show that firms with a higher level of mobility
pay higher effective tax rates than firms with larger proportions of fixed assets. Our findings suggest that the relationship between asset mobility and effective tax rates depends
highly on the context of strategic interactions between governments and firms. The conventional wisdom that capital mobility lowers taxes generally assumes state–business
bargaining under low levels of bribery and collusion. In
an environment that lacks fiscal transparency and where
tax breaks can be offered in exchange for other economic
benefits, government–business collusion can be an essential
path for firms to reduce taxes. Even within the same country, a more corrupt environment with a cozier relationship
between government and business can change the capital
mobility–taxation nexus.
Our findings reveal the limitations of the current literature on tax policies and shed light on potential directions
for future research. On the demand side of tax breaks, while
firms prefer paying lower taxes, one has to take the cost of
such choices in less transparent environments into consideration. High capital mobility may weaken a firm’s incentives
and ability to build a stronger relationship with government
officials. In contrast, firms with higher proportions of fixed
assets may have stronger incentives to invest in building connections due to their vulnerability to bribe seeking, the sunk
cost of fixed assets, and the long-term benefits of such investment. On the supply side, our finding suggests that bureaucrats may be more likely to offer lower tax rates and seek
bribes when interacting with less mobile firms because of
the vulnerability and commitment of these firms in the long
term.
Finally, one could see investments in political connections
as another type of taxation. We might consider the sum of
investments in government relationships plus income taxes
as the total tax bill. Given the scope of this paper, we are unable to know how high the costs of such investments are and
how such a “total tax bill” differs between fixed asset firms
and more mobile firms. However, it seems unlikely that in
the long run, investment in political connections for individual firms is higher than paying the full tax bill. Examining this trade-off and cost differentials more closely will be
an important avenue for future research.
We believe our results underline the importance of using
firm-level data to investigate these questions. Analyzing firm-
level effective tax rates within a single country allows for a
more fine-grained investigation of the relationship between
mobility and taxation, as well as the varying conditions that
moderate such a relationship. Therefore, it is worth replicating our efforts in other countries, especially countries where
state–business collusion is prevalent.
Supplementary Information
Supplementary information is available at the International
Studies Quarterly data archive.
References
ADHIKARI, AJAY, CHEK DERASHID, AND HAO ZHANG. 2006. “Public Policy, Political Connections, and Effective Tax Rates: Longitudinal Evidence from
Malaysia.” Journal of Accounting and Public Policy 25 (5): 574–95.
ANG, YUEN YUEN. 2020. China’s Gilded Age: The Paradox of Economic Boom and
Vast Corruption. New York: Cambridge University Press.
BAI, JIE, SEEMA JAYACHANDRAN, EDMUND J. MALESKY, AND BENJAMIN A. OLKEN. 2019.
“Firm Growth and Corruption: Empirical Evidence from Vietnam.” The
Economic Journal 129 (618): 651–77.
BASINGER, SCOTT J., AND MARK HALLERBERG. 2004. “Remodeling the Competition for Capital: How Domestic Politics Erases the Race to the Bottom.”
American Political Science Review 98 (2): 261–76.
BRETSCHGER, LUCAS, AND FRANK HETTICH. 2002. “Globalisation, Capital Mobility and Tax Competition: Theory and Evidence for OECD Countries.”
European Journal of Political Economy 18 (4): 695–716.
CAI, HONGBIN, AND DANIEL TREISMAN. 2005. “Does Competition for Capital Discipline Governments? Decentralization, Globalization, and Public Policy.” American Economic Review 95 (3): 817–30.
CAI, HONGBIN, HANMING FANG, AND LIXIN COLIN XU. 2011. “Eat, Drink, Firms,
Government: An Investigation of Corruption from the Entertainment
and Travel Costs of Chinese Firms.” The Journal of Law and Economics 54
(1): 55–78.
CAO, XUN, QING DENG, XIAOJUN LI, AND ZIJIE SHAO. 2021. “Fine Me If You
Can: Fixed Asset Intensity and Enforcement of Environmental Regulations in China.” Regulation & Governance. doi: https://doi.org/
10.1111/rego.12406.
CHEN, LING. 2018. Manipulating Globalization: The Influence of Bureaucrats on
Business in China. Stanford, CA: Stanford University Press.
CHEN, LING, AND HAO ZHANG. 2021. “Strategic Authoritarianism: The Political
Cycles and Selectivity of China’s Tax Break Policy.” American Journal of
Political Science 65 (4): 845–61.
CHENG, SUWINA, KENNY LIN, AND RICHARD SIMMONS. 2017. “A City-Level Analysis
of the Distribution of FDI within China.” Journal of Chinese Economic and
Foreign Trade Studies 10 (1): 2–18.
CHINA CCP CENTRAL COMMITTEE. 2013. “The Decision on Several Key Issues
Regarding Comprehensively Deepening the Reforms.” Government
Document.
CHOI, EUN KYONG. 2009. “Informal Tax Competition among Local Governments in China since the 1994 Tax Reforms.” Issues & Studies 45 (2):
159–83.
DEVEREUX, MICHAEL P., RACHEL GRIFFITH, AND ALEXANDER KLEMM. 2002. “Corporate Income Tax Reforms and International Tax Competition.” Economic Policy 17 (35): 449–95.
DICKSON, BRUCE J. 2008. Wealth into Power: The Communist Party’s Embrace of
China’s Private Sector. Cambridge: Cambridge University Press.
ENTERPRISE ANALYSIS UNIT-WORLD BANK GROUP. 2005. “Investment Climate Survey 2005.” Accessed July 2019. https://microdata.
worldbank.org/index.php/catalog/602/study-description#metadatadata_access.
GAO, JIE. 2015. “Pernicious Manipulation of Performance Measures in
China’s Cadre Evaluation System.” The China Quarterly 223: 618–37.
GARRETT, GEOFFREY. 1995. “Capital Mobility, Trade, and the Domestic Politics
of Economic Policy.” International Organization 49 (4): 657–87.
GAUTHIER, BERNARD, AND JONATHAN GOYETTE. 2014. “Taxation and Corruption:
Theory and Firm-level Evidence from Uganda.” Applied Economics 46
(23): 2755–65.
GENSCHEL, PHILIPP, HANNA LIERSE, AND LAURA SEELKOPF. 2016. “Dictators Don’t
Compete: Autocracy, Democracy, and Tax Competition.” Review of International Political Economy 23 (2): 290–315.
Downloaded from https://academic.oup.com/isq/advance-article/doi/10.1093/isq/sqab096/6514648 by guest on 04 February 2022
online appendix show the relationship when modeled as
panel models with fixed or random effects. The results are
similar to those for 2014 but slightly weaker. Overall, these
results are additional evidence in favor of our argument. Before the anti-corruption campaign took full effect, the positive relationship between capital mobility and effective tax
rates was especially present in cities with low fiscal transparency. In other words, the increase of transparency alleviated the mobility–tax relationship we observe in China.
These results are particularly notable in combination with
the results from the post-anti-corruption campaign period.
13
�14
Capital Mobility and Taxation
PRZEWORSKI, ADAM, AND MICHAEL WALLERSTEIN. 1988. “Structural Dependence
of the State on Capital.” The American Political Science Review 82 (1):
11–29.
QUINN, DENNIS. 1997. “The Correlates of Change in International Financial
Regulation.” American Political Science Review 91 (3): 531–51.
RITHMIRE, MEG. 2014. “China’s ‘New Regionalism’: Subnational Analysis in
Chinese Political Economy.” World Politics 66 (1): 165–94.
RODRIK, DANI. 1997. “Trade, Social Insurance, and the Limits of Globalisation.” NBER Working Paper 5905.
RODRIK, DANI, AND TANGUY VAN YPERSELE. 2001. “Captial Mobility, Distributive
Conflict and International Tax Coordination.” Journal of International
Economics 54 (1): 57–73.
SAFAVIAN, MEHNAZ, DOUGLAS GRAHAM, AND CLAUDIO GONZALEZ-VEGA. 2001. “Corruption and Microenterprises in Russia.” World Development 29 (2):
1215–24.
SHIRK, SUSAN. 1993. The Political Logic of Economic Reform in China. Berkeley,
CA: University of California Press.
TANZI, VITO, AND HAMID REZA DAVOODI. 2000. “Corruption, Growth, and Public
Finances.” IMF Working Paper 182.
THE STATE COUNCIL OF CHINA. 2014. “Notice on Clearing and Regulating Taxation and Other Preferential Policies.” Government Document No. 62.
———. 2015. “Notice on Matters Related to Taxation and Other Preferential
Policies.” Government Document No. 25.
THE STATE TAX BUREAU OF CHINA. 2015. “The Catalog of Tax Exemption and
Deduction Codes.” Government Document No.73.
TIMMONS, JEFFREY F., AND FRANCISCO GARFIAS. 2015. “Revealed Corruption, Taxation, and Fiscal Accountability: Evidence from Brazil.” World Development 70: 13–27.
TRUEX, RORY. 2016. Making Autocracy Work: Representation and Responsiveness in
Modern China. New York: Cambridge University Press.
TSAI, KELLEE S. 2007. Capitalism without Democracy: The Private Sector in Contemporary China. Ithaca, NY: Cornell University Press.
WALLACE, JEREMY. 2016. “Juking the Stats: Authoritarian Information Problems in China.” British Journal of Political Science 46 (1): 11–29.
WANG, YUHUA. 2014. “Institutions and Bribery in an Authoritarian State.”
Studies in Comparative International Development 49 (2): 217–41.
WHITING, SUSAN. 2001. Power and Wealth in Rural China: The Political Economy
of Institutional Change. New York: Cambridge University Press.
XING, JING, WEI CUI, AND XI QU. 2018. “Local Tax Incentives and Behavior of
Foreign Enterprises.” Singapore Management University School of Accountancy Research Paper Series 6 (1): 1–31.
YE, SHAN. 2017. “The Flaws of Commitments to Tax Relief by Local Government.” Contemporary Jurisprudence 31 (06): 116–25.
YU QIAO, ed. 2018. China City Level Government Fiscal Transparency Report. Beijing: Tsinghua University.
ZHANG, CHANGDONG. 2021. Governing and Ruling: The Political Logic of Taxation
in China. Ann Arbor, MI: University of Michigan Press.
ZHENG, YU. 2006. “Fiscal Federalism and Provincial Foreign Tax Policies in
China.” Journal of Contemporary China 15 (48): 479–502.
ZHU, BOLIANG, AND QING DENG. 2021. “Monopoly Rents, Institutions, and
Bribery.” Governance. doi: https://doi.org/10.1111/gove.12597.
ZHU, BOLIANG, AND WEIYI SHI. 2019. “Greasing the Wheels of Commerce?
Corruption and Foreign Investment.” Journal of Politics 81 (4): 1311–
1327.
ZUO, CAI (VERA). 2015. “Promoting City Leaders: The Structure of Political
Incentives in China.” The China Quarterly 224: 955–84.
Downloaded from https://academic.oup.com/isq/advance-article/doi/10.1093/isq/sqab096/6514648 by guest on 04 February 2022
HAYS, JUDE C. 2003. “Globalization and Capital Taxation in Consensus and
Majoritarian Democracies.” World Politics 56 (1): 79–113.
HIRSCHMAN, ALFRED O. 1970. Exit, Voice, and Loyalty: Responses to Decline in
Firms, Organizations, and States. Cambridge, MA: Harvard University
Press.
HOLLENBACH, FLORIAN M., AND THIAGO N. SILVA. 2019. “Fiscal Capacity and Inequality: Evidence from Brazilian Municipalities.” The Journal of Politics
81 (4): 1434–45.
HOU, YUE. 2019. The Private Sector in Public Office: Selective Property Rights in
China. Cambridge: Cambridge University Press.
JENSEN, NATHAN M. 2013. “Domestic Institutions and the Taxing of Multinational Corporations.” International Studies Quarterly 57 (3): 440–48.
JENSEN, NATHAN M., AND EDMUND MALESKY. 2018. Incentives to Pander: How Politicians Use Corporate Welfare for Political Gain. Cambridge: Cambridge University Press.
JIANG, JUNYAN. 2018. “Making Bureaucracy Work: Patronage Networks, Performance Incentives, and Economic Development in China.” American
Journal of Political Science 62 (4): 982–99.
JOHNS, LESLIE, AND RACHEL WELLHAUSEN. 2020. “The Price of Doing Business:
Why Replaceable Foreign Firms Get Worse Government Treatment.”
Economics & Politics 33 (2): 209–43.
KIM, IN SONG. 2017. “Political Cleavages within Industry: Firm-Level Lobbying
for Trade Liberalization.” American Political Science Review 111 (1): 1–20.
LI, QUAN. 2006. “Democracy, Autocracy, and Tax Incentives to Foreign Direct Investors: A Cross-National Analysis.” The Journal of Politics 68 (1):
62–74.
LIU, YONGZHENG, AND JORGE MARTINEZ-VAZQUEZ. 2014. “Interjurisdictional Tax
Competition in China.” Journal of Regional Science 54 (4): 606–28.
LÜ, XIAOBO, AND PIERRE F. LANDRY. 2014. “Show Me the Money: Interjurisdiction Political Competition and Fiscal Extraction in China.” American
Political Science Review 108 (3): 706–22.
MANION, MELANIE. 2016. “Taking China’s Anticorruption Campaign Seriously.” Economic and Political Studies 4 (1): 3–18.
MARJIT, SUGATA, VIVEKANANDA MUKHERJEE, AND ARIJIT MUKHERJEE. 2000. “Harassment, Corruption and Tax Policy.” European Journal of Political Economy
16 (3): 75–94.
MONTGOMERY, JACOB M., BRENDAN NYHAN, AND MICHELLE TORRES. 2018. “How
Conditioning on Posttreatment Variables Can Ruin Your Experiment
and What to Do about It.” American Journal of Political Science 62
(3):760–75.
NATIONAL BUREAU OF STATISTICS. 2015. China Statistical Yearbook 2014. Beijing:
China Statistics Press.
NAUGHTON, BARRY. 2018. The Chinese Economy: Adaptation and Growth. Cambridge, MA: MIT Press.
OI, JEAN C. 1999. Rural China Takes Off: Institutional Foundations of Economic
Reform. Berkeley, CA: University of California Press.
ONG, LYNETTE H. 2012. Prosper or Perish: Credit and Fiscal Systems in Rural China.
Ithaca, NY: Cornell University Press.
PEARSON, MARGARET. 1997. China’s New Business Elite: The Political Results of Economic Reform. Berkeley, CA: University of California Press.
PLÜMPER, THOMAS, VERA E. TROEGER, AND HANNES WINNER. 2009. “Why Is There
No Race to the Bottom in Capital Taxation?” International Studies Quarterly 53 (3): 761–86.
POND, AMY, AND CHRISTINA ZAFEIRIDOU. 2019. “The Political Importance of
Financial Performance.” American Journal of Political Science 64 (1):
152–68.
�
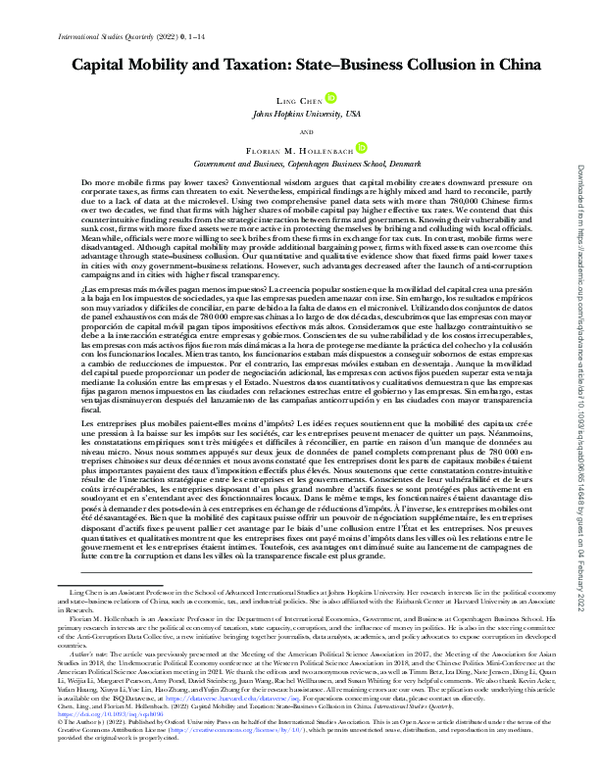
 Ling Chen