
Abstract
To explore the extraction of computer image scene and target information, a nonlinear method based on big data technology is proposed. The method can decompose the computer image into a plurality of components when the SAR computer image is processed such as target extraction and computer image compression, which represent different captured image features, respectively. Selecting the most suitable processing method according to the characteristics of different components can greatly improve the performance. Using nonlinear diffusion method, the computer image is decomposed into structural components representing large-scale structural information and texture components representing small-scale detailed information, and the automatic threshold estimation in the diffusion process is studied. The LAIDA criterion is introduced into the automatic threshold solution of nonlinear diffusion-based computer image decomposition to test and evaluate the diffusion process of various diffusion parameter forms. The results show that the experimental outcome of the diffusion decomposition based on automatic threshold estimation is very close on each index, which shows that using automatic threshold estimation, no matter what diffusion index is used, very close results can be obtained. Specifically, for each algorithm, the parameter estimation threshold l for outliers plays an obvious role. The third is the degree of initiative of the estimation process. The larger the L, the larger the outlier, which will lead to a greater extent of the diffusion process, resulting in a continuous decrease in the structural similarity index and compositional correlation. It is proved that the algorithm has strong global search ability, can effectively avoid premature convergence, has fast convergence speed, and good long stability. It can be widely used for optimization of various multimodal functions.
1 Introduction
Due to the rapid development of science and technology, human living standards and quality of life have been improved unprecedentedly, and human civilization has also entered a media information age. At the same time, it is also actively responding to the call of safe city, intelligent transportation, and harmonious society. More and more people are committed to the research of visual information. On the one hand, they have obtained many technologies that benefit mankind, and on the other hand, they have also promoted the rise and development of computer vision. Computer vision is a technology that uses computer intelligence to process video image information and data by simulating biological vision function. Computer vision is an interdisciplinary subject with important research significance and broad research prospects [1]. Video information is the most common and abundant content in the media, which provides a lot of information resources for people’s life, work, and study. With the universality and popularization of smart devices, such as smart phones, digital cameras, and other devices, beautiful moments can be captured and life can be recorded at any time. However, due to the large amount of video format data, it is often difficult to find and locate specific content in the later stage. We transfer our hope to the computer, hoping that the computer can automatically analyze and process it accurately and quickly. Among them, intelligent video surveillance is an important application of computer to process video data. Most of its processes are: video preprocessing, moving target detection, and moving target tracking. We use the original full convolutional networks (FCNs) as the basic network framework and expand it into two branches [2]. As shown in Figure 1, FCN network is widely used in saliency detection tasks to predict the probability of each pixel in the image as a saliency region. Image description generation has very important research value, and it can be applied to all aspects of social life. In social multimedia, image description helps people to quickly understand the content of images, improve the speed of image browsing, and alleviate the information explosion in social networks. Image description generation has very important research value, and it can be applied to all aspects of social life.
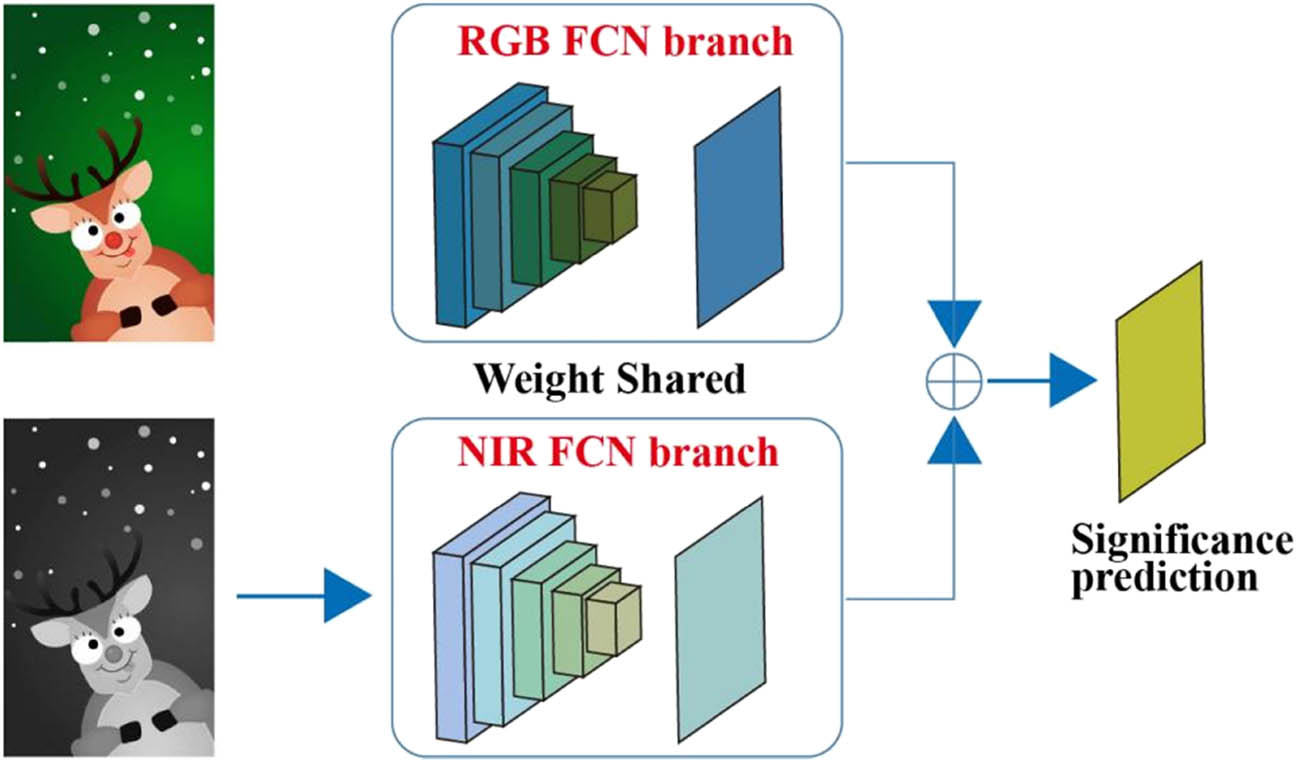
Double branch salient target detection network, input is RGB image and NIR image.
When lonely old people have nothing to do to look through the album, they can find a character at a glance according to the photos in front of them, guess the character’s psychology and predict the next action according to their looks and actions. From the perspective of bionics, we also hope that computers can have human visual function to replace human beings to complete a large number of homework and needs. Although the development level of computer vision theory and technology needs to be improved, it has been widely used in many fields, such as production and manufacturing, national defense technology, space exploration, medical diagnosis, video compression, intelligent monitoring, intelligent transportation, and so on. In these research works and applications, target detection and tracking is the key technology to realize the system function [3].
It is a well-known concept of safety and civilization to be vigilant in times of safety and take precautions. Many residential areas and even households’ rooms, shopping malls, enterprises, public places with a large flow of people, and vehicles have installed a large number of camera monitoring to ensure the safety of people and property. The traditional monitoring method relies on human eyes for real-time monitoring, but due to the fatigue of human eyes, it cannot be monitored for a long time, and when facing multiple monitoring pages, people’s energy and attention are obviously insufficient [4]. This often leads to improper monitoring, especially in public places, once there is a quarrel, fight, and theft of goods, it is often useless to transfer the camera monitoring at that time, so it is impossible to ensure the safety of personal and property in time. In order to overcome the shortcomings of traditional monitoring, researchers have skillfully combined pattern recognition, analysis and processing technology to develop an intelligent monitoring system. The function of intelligent video surveillance is to complete the analysis and understand the video computer images without human participation or with little human cooperation. When a problem behavior or abnormal event is detected, it will give an active alarm and locate and track the interested targets, so as to provide basic services for later higher-level intelligent analysis [5].
2 Literature review
Guo et al. put forward the retina net algorithm, which better improves the effect of feature extraction by combining feature pyramid network and FCN and redefining the standard cross entropy loss [6]. Shen proposed an improved RefineDet algorithm based on SSD. Combined with the advantages of single-stage detection algorithm and two-stage detection algorithm, a two-step cascaded regression method is adopted to realize target detection, which improves the positioning accuracy and classification effect of targets [7]. Yan and Yan proposed a pedestrian detection algorithm based on multiple feature maximum fusion based on RefineDet algorithm, which makes the feature discrimination of the fusion layer stronger and shows better detection performance in the case of small target and target occlusion [8]. Yan and Yan, based on the RefineDet algorithm and combined with the feature enhancement and feature fusion module, better improved the detection ability of small target pedestrians in the auxiliary driving system [8]. Chen et al. proposed a 3D target detection algorithm based on various sensing technologies such as RGBD, laser point cloud, and sensor to study vehicle perception in driverless scene [9]. Aiming at the problems existing in multi-scale target detection, Ma and Chen constructed light-weight featurized image pyramid network, and improved the accuracy of target classification by using lightweight convolution blocks to extract multi-scale feature maps with more discriminant information [10]. In order to enhance the feature extraction ability of the network structure, Ren proposed receptive field block, which enhances the distinguishability of features and the robustness of the model by simulating the relationship between the size and eccentricity of receptive fields in the visual system [11]. Li used the hypergraph theory to construct the hypergraph of feature space and label space respectively, and calculated the feature subspace that retains the hypergraph information. This method makes full use of the relationship between the features and labels to extract features, but ignores the influence of the geometric structure between the samples on the extraction of feature subspaces. Although these algorithms can effectively fuse the relationship between multiple labels to achieve the dimensionality reduction of high-dimensional multi label data to a certain extent, these algorithms ignore the influence of the noise contained in the multi label data and the geometric relationship between the samples on the dimensionality reduction of multi label data feature space, which are very important to improve the performance of multi label feature extraction algorithm [12]. Zhong and Liu proposed a semantic specific graph representation learning framework, which is composed of two key modules: (i) Semantic Decoupling module. The module uses category semantics to guide the learning of specific semantic representation. (ii) Semantic interaction module. The module associates the learned semantic representation with the tag co-occurrence graph based on statistics, and explores their interaction through the graph propagation mechanism [13]. Zhang et al. proposed feature attention network (FAN), which includes feature refinement network and relevance learning network. FAN establishes a top-down feature fusion mechanism to refine more important features and learn the correlation between the convolution features, so as to indirectly learn the dependence between the tags [14].
Based on the current research, this work proposes a nonlinear method based on big data technology. When processing SAR computer image, such as target extraction and computer image compression, the computer image can be decomposed into multiple components, which represent different trapped image features. Selecting the most appropriate processing method according to the characteristics of different components can greatly improve the performance. Using the nonlinear diffusion method, the computer image is decomposed into the structural component representing the large-scale structure information and the texture component representing the small-scale detail information, and the automatic threshold estimation in the diffusion process is studied. The LAIDA criterion is introduced into the automatic threshold solution of computer image decomposition based on nonlinear diffusion, and the diffusion processes in the form of various diffusion parameters are tested and evaluated.
3 Threshold estimation in nonlinear diffusion
The decomposition of computer image can be regarded as an estimation problem. For each point x, the value of the computer image in the neighborhood of the point constitutes an observation sample set. Taking the computer image decomposition as an example, the problem to be solved is how to estimate the value u(x) of the structural component at the point. Let u be the structural component of the computer image. According to the definition of the structural component, u is piecewise smooth. The computer image can be divided into a limited number of non-overlapping regions. The gray values of the points in the same region are the same, which is similar to the piecewise constant model. For this piecewise constant model, it is assumed that when all points in the neighborhood of point x belong to the same region, the corresponding optimal estimation is the mean statistics. However, when the neighborhood falls on the edge of the region, that is, when it contains pixels in different regions, its points no longer conform to the same distribution [15]. When estimating u(x), points that are not in the same area as point x should be regarded as outlier data, and robust estimation method should be used at this time. Computer image decomposition is the process of recovering u from computer image f, so this problem can be solved by robust estimation.
It is proved that the nonlinear diffusion problem is closely related to the robust estimation problem. When establishing the relationship between nonlinear diffusion and robust estimation, a simplified computer image model is adopted, that is, the computer image is regarded as a piecewise smooth computer image polluted by Gaussian noise with mean value of 0 [16]. Computer image decomposition based on nonlinear diffusion can be regarded as the problem of robust estimation of piecewise smooth computer image from noisy computer image, that is, solving a computer image I to meet the following constraints:
where
where
The analysis of robust estimation and nonlinear diffusion shows that the selection of diffusion threshold is equivalent to the determination of outliers in robust estimation, that is, scale threshold
From the principle of computer image decomposition, the selection of diffusion threshold is equivalent to removing the target pixel region from the background to avoid excessive smoothing suppression. Statistically, the selection of diffusion threshold (outliers) is similar to the process of removing outliers from a group of samples. The widely used method in practice is the LAIDA criterion [19].
Definition of LAIDA criterion: when the number of measurements n is enough and the measurements obey the normal distribution, in each measurement value, if the residual error
According to the relationship between the nonlinear diffusion and robust estimation, the automatic threshold estimation method of nonlinear anisotropic diffusion can be obtained, that is, first, the outliers of robust estimation are obtained by using robust statistical method, and then the diffusion threshold is obtained according to the corresponding relationship between diffusion threshold and outliers [20]. The diffusion process based on MAD outlier estimation is as follows:
Select the window area and calculate the median Z of window sequence
Calculate the median d of sequence
Let
Let
During diffusion,
Although Rectified linear unit (ReLU) activation function solves the problem that the gradient of saturated nonlinear activation function disappears, there are problems such as mean shift and neuron death, which affect the convergence of the network model. In this work, the nonlinear activation function PReLU20-21 with learnable parameters is used as the activation function of multilayer neural network. The expression of Parametric rectified linear unit (PReLU) is shown in Eq. (5) as follows:
where i represents the i-th channel. When
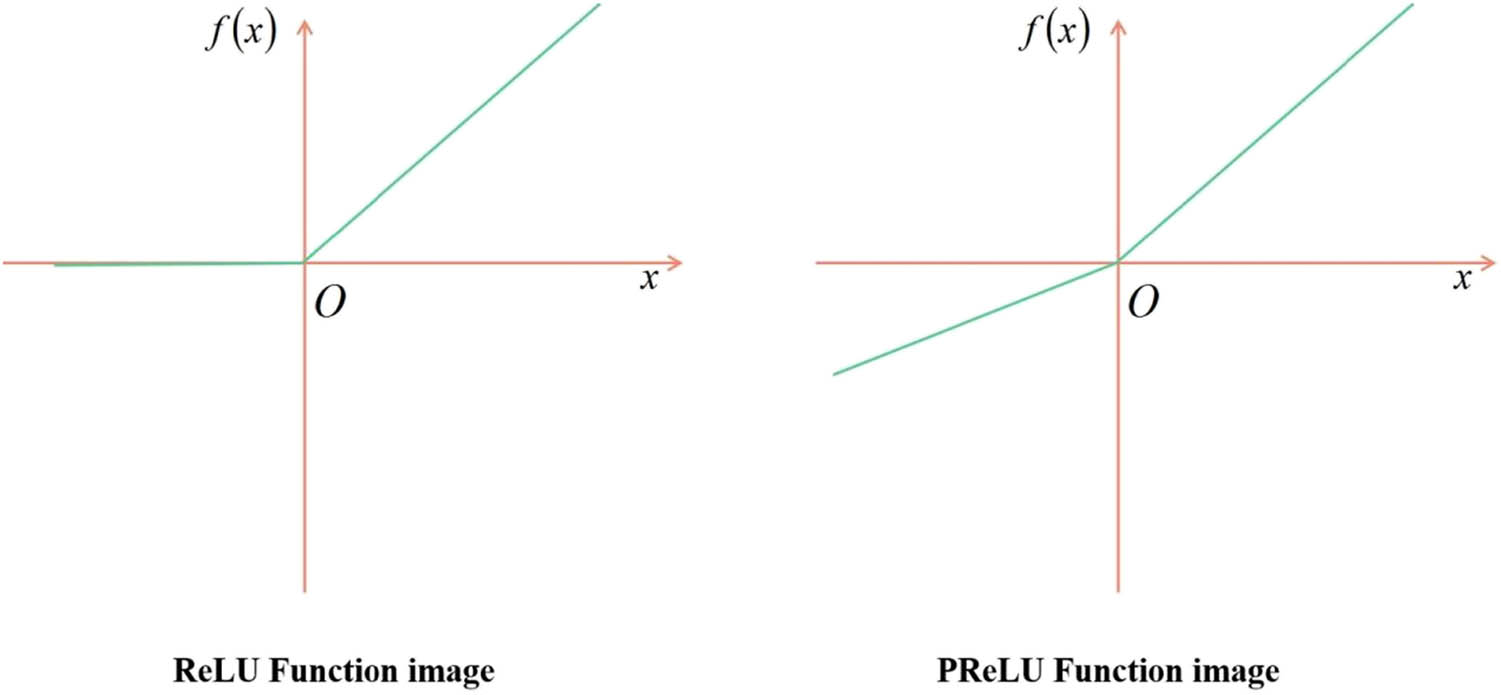
Images of ReLU function and PReLU function.
4 Experiment and analysis
4.1 Experimental platform
This experiment is trained and tested on the hardware platform of 32 GB memory, GeForceGTX 1080 GPU, Intel i7-7700 CPU and Ubuntu 16.04 operating system. This method is based on the nonlinear extraction framework.
4.2 Model training
In this work, the network model is trained end-to-end. The training computer image size is 320 × 320, the mini-set size is 32, the maximum number of iterations is 200,000, and the initial training level base_Lr is 0.01. After 50,000, 100,000, and 150,000 iterations, respectively, the learning rate is reduced to 1/10 of the original, the momentum is set to 0.9, and the weight attenuation is set to 0.0005 [22].
In order to verify that the convergence speed of the network model using PReLU activation function is improved, this work uses ReLU and PReLU activation functions for training in the process of algorithm training, as shown in Figure 3.
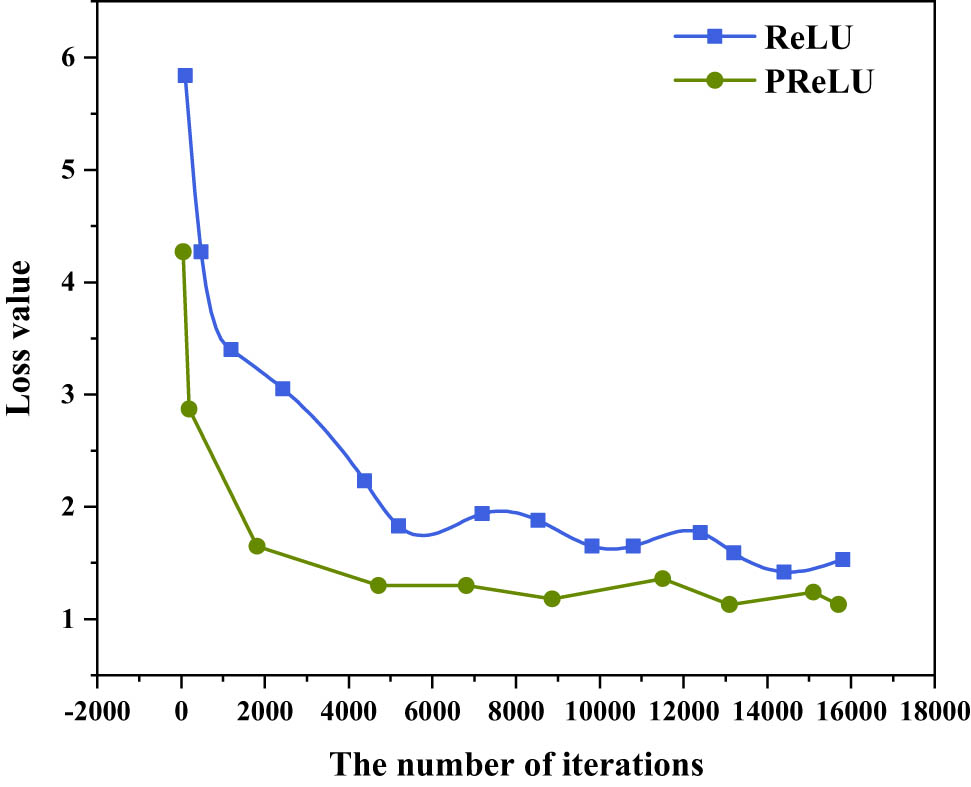
Variation in loss value with iteration times.
With the increase of iteration times and training time, the loss value of the two methods gradually decreases, and the overall trend is relatively stable. Relatively speaking, in the training process of self-built sample set, the convergence speed of the network model using PReLU activation function is accelerated [23].
4.3 Experimental results and analysis
Figures 4–6 show the comparison of several evaluation indexes obtained by selecting different threshold parameters, respectively, in which SCR is the target clutter ratio, RCC is the residual clutter ratio, and CORR is the component correlation. From the data of SCR, the SCR of computer image structure component has been significantly improved, while the RCC indicates that the clutter in computer image structure component is suppressed and reduced; CORR of computer image shows the correlation between the structure component and residual texture component. From the specific data of the above three algorithms, the experimental results of diffusion decomposition based on automatic threshold estimation are very close in various indexes, which shows that using automatic threshold estimation, no matter what diffusion index is used, we can get very close results. Specifically, for each algorithm, the parameter estimation threshold l outliers play a specific role. The third is the degree of initiative in the evaluation process. The larger the L, the more excessive the diffusion process, resulting in a continuous decrease in the structural similarity index and compositional correlation. [24].
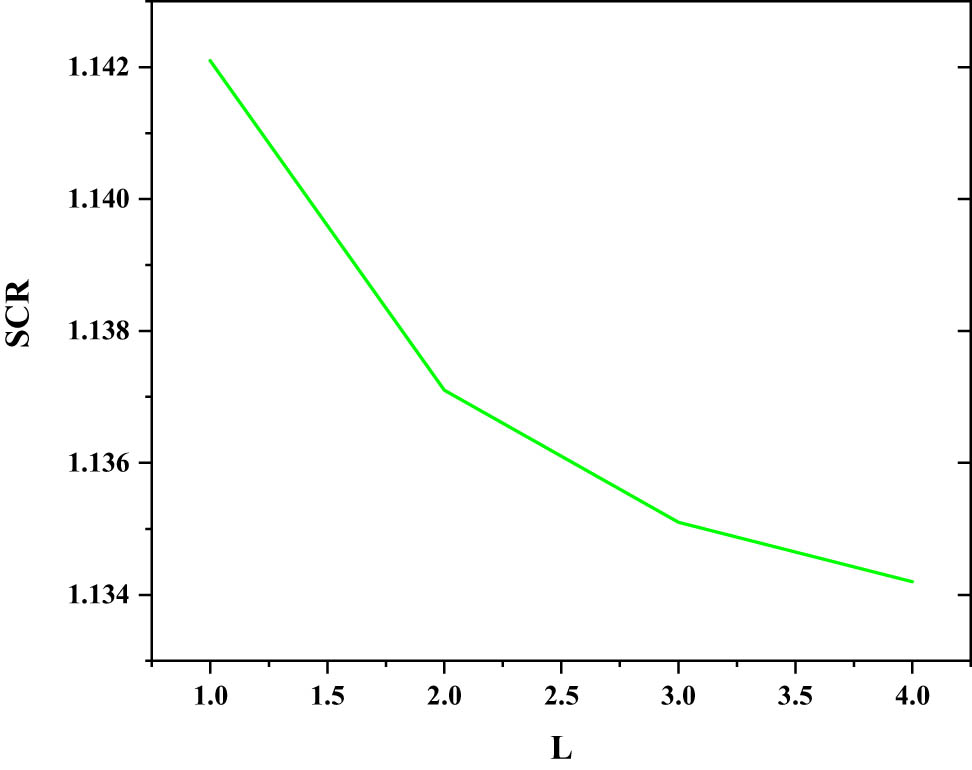
P–M diffusion (SCR) based on gradient automatic threshold estimation.
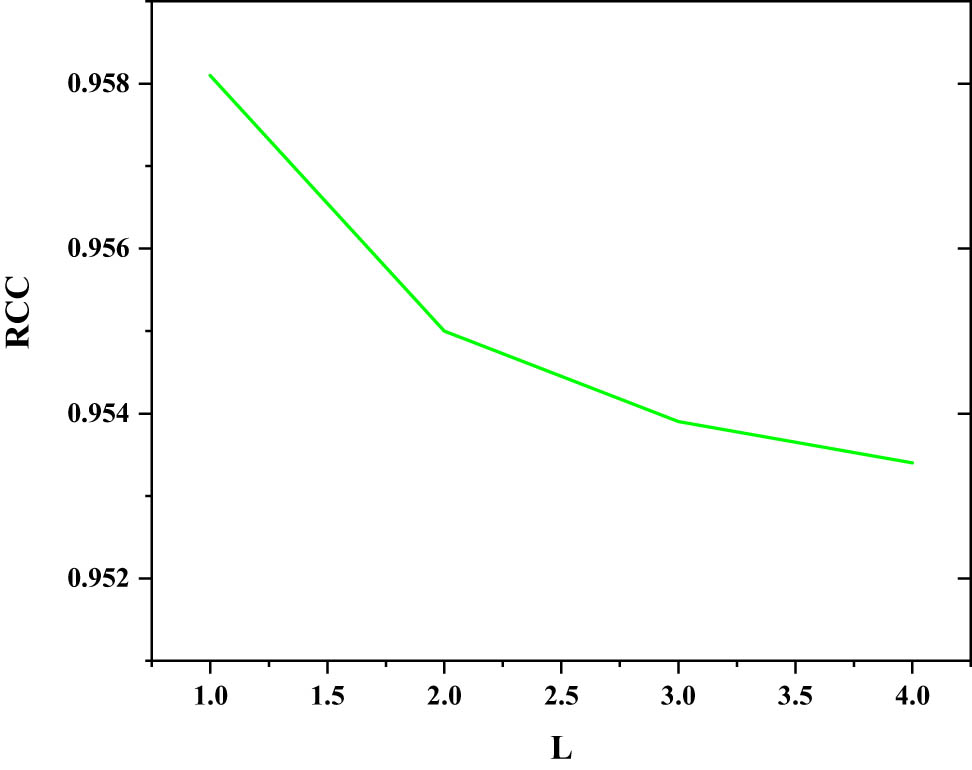
P–M diffusion (RCC) based on gradient automatic threshold estimation.
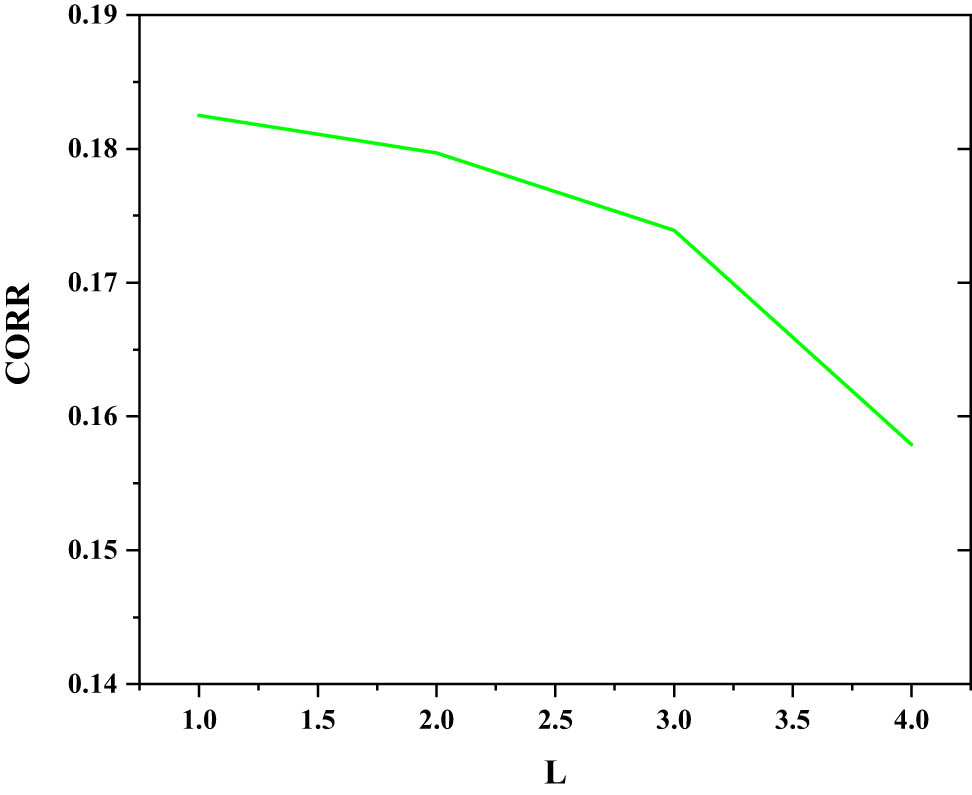
P–M diffusion (CORR) based on gradient automatic threshold estimation.
5 Conclusion
In this work, computer image decomposition based on nonlinear diffusion is studied. According to the relationship between nonlinear diffusion and robust estimation, a general automatic threshold estimation method based on LAIDA criterion is proposed, which can automatically estimate the diffusion threshold of various forms of diffusion parameters. Experiments show that this method has good adaptability and can still achieve good results for different computer images. There is still a lot of room for improvement in the understanding of actions by image caption generation algorithms. The image features used by the existing algorithms cannot accurately represent the motion information of the objects in the images. In fact, there are natural objects and their action labels for image descriptions. Whether we can extract available labels from image descriptions, train action detection networks for image description generation tasks, and extract motion features of objects for image description generation needs further study.
Acknowledgements
This work is supported by the Anhui Natural Science Research Project of Colleges and Universities, No. KJ2020A0933 and No. KJ2020A0990, and the Scientific Research Start-up Fund Project for High-Level Talents Introduction of Hefei Technology College (No. 2021KYQDZ011).
-
Author contribution: The author has accepted responsibility for the entire content of this manuscript and approved its submission.
-
Conflict of interest: The author states no conflict of interest.
References
[1] Cui L. Construction of big data technology training environment for vocational education based on edge computing technology. Wirel Commun Mob Comput. 2022;2022:1–9. 10.1155/2022/1060464.Search in Google Scholar
[2] Xu H, Jiang C, Huang C, Chen Y, Yi M, Zhu Z. Key information extraction and talk pattern analysis based on big data technology: A case study on YiXi talks. Electronics. 2022;11(4):640. 10.3390/electronics11040640.Search in Google Scholar
[3] Wen L. Development analysis of cross-border e-commerce logistics based on big data technology under safety law protection. Int J Inf Syst Serv Sect. 2022;14(2):1–14. 10.4018/IJISSS.290547.Search in Google Scholar
[4] Li H, Manickam A, Samuel R. Automatic detection technology for sports players based on image recognition technology: The significance of big data technology in China’s sports field. Ann Oper Res. (prepublish) 2022. 10.1007/S10479-021-04409-1.Search in Google Scholar
[5] Mohapatra AG, Talukdar J, Mishra TC, Anand S, Jaiswal A, Khanna A, et al. Fiber Bragg grating sensors driven structural health monitoring by using multimedia-enabled IOT and big data technology. Multimed Tools Appl. (prepublish) 2022;81:34573–93. 10.1007/S11042-021-11565-W.Search in Google Scholar
[6] Guo J, Bai Y, Ding M, Song L, Yu G, Liang Y, et al. Analysis of Carotid ultrasound screening of high-risk groups of stroke based on big data technology. J Healthc Eng. 2022;2022:6363691. 10.1155/2022/6363691.Search in Google Scholar PubMed PubMed Central
[7] Shen J. Discussion on agricultural application of big data technology. World Sci Res J. 2022;8(1):54–7. 10.6911/WSRJ.202201_8(1).0008.Search in Google Scholar
[8] Yan M, Yan M. Monitoring and early warning analysis of the epidemic situation of escherichia coli based on big data technology and cloud computing. J Healthc Eng. 2022;2022:8739447. 10.1155/2022/8739447.Search in Google Scholar PubMed PubMed Central
[9] Chen Y, Tian L, Yang L, Zhang L. Design of safety and integrated disaster prevention system based on big data technology. J Phys Conf Ser. 2022;2146(1):012036. 10.1088/1742-6596/2146/1/012036.Search in Google Scholar
[10] Ma T, Chen S. Government data resource sharing application system based on big data technology. Acad J Comput Inf Sci. 2021;4(8):96–101. 10.25236/AJCIS.2021.040818.Search in Google Scholar
[11] Ren J. Pop music trend and image analysis based on big data technology. Comput Intell Neurosci. 2021;2021:4700630. 10.1155/2021/4700630.Search in Google Scholar PubMed PubMed Central
[12] Li X. In vitro detection of nanoparticle cytotoxicity based on big data technology. J Comput Methods Sci Eng. 2021;21(6):1797–808. 10.3233/JCM-215442.Search in Google Scholar
[13] Zhong Q, Liu XM. Monitoring methods of marine pollution range based on big data technology. Nat Environ Pollut Technol. 2021;20(4):1831–6. 10.46488/NEPT.2021.V20I04.050.Search in Google Scholar
[14] Zhang W, Yang C, Cheng Y, Chen H. Production management of professional farmers under the new rural construction based on big data technology. Wirel Commun Mob Comput. 2021;2021:1–11. 10.1155/2021/9539535.Search in Google Scholar
[15] Miao L. Influence of big data technology on enterprise marketing strategy. Ind Eng Innov Manag. 2021;4(2):55–60. 10.23977/IEIM.2021.040209.Search in Google Scholar
[16] Mao Z, Zou Q, Yao H, Wu J. The application framework of big data technology in the COVID-19 epidemic emergency management in local government—A case study of Hainan Province, China. BMC Public Health. 2021;21(1):2001. 10.1186/S12889-021-12065-0.Search in Google Scholar PubMed PubMed Central
[17] Marcum-Dietrich N, Kerlin S, Hendrix A, Sorhagen N, Staudt C, Krauss Z. Model my watershed: An investigation into the role of big data, technology, and models in promoting student interest in watershed action. J Environ Educ. 2021;52(6):384–97. 10.1080/00958964.2021.1979451.Search in Google Scholar
[18] Ren J, Liu X, Wang C, Wang L. Computer mathematical statistics and analysis on automobile HFCs reduction path using big data technology. J Phys Conf Ser. 2021;2083(3):032085. 10.1088/1742-6596/2083/3/032085.Search in Google Scholar
[19] Jin T, Wang L, Zhao Y, Shen L. Variation characteristics mathematical calculation of O3 and its relationship with meteorological factors by big data technology. J Phys Conf Ser. 2021;2083(3):032001. 10.1088/1742-6596/2083/3/032001.Search in Google Scholar
[20] Wang Q. Application of recommendation algorithm and big data technology in computer english corpus database. J Phys Conf Ser. 2021;2083(3):032092. 10.1088/1742-6596/2083/3/032092.Search in Google Scholar
[21] Hui B. Research and application of cloud computing and big data technology. J Phys Conf Ser. 2021;2083(4):042087. 10.1088/1742-6596/2083/4/042087.Search in Google Scholar
[22] Owolabi KA, Adeleke OA, Tella A, Mudasiru YA. A structural equation modeling approach to evaluating library personnel intention to adopt big data technology in Nigerian academic libraries. Internet Ref Serv Q. 2021;25(4):145–67. 10.1080/10875301.2021.1958119.Search in Google Scholar
[23] Yuzhen S. Research on smart agricultural waste discharge supervision and prevention based on big data technology. Acta Agric Scand Sect B Soil Plant Sci. 2021;71(8):683–95. 10.1080/09064710.2021.1939409.Search in Google Scholar
[24] Ye Z, Qian J, Wang W, Shi D, Chen L. Research and practice of big data technology in energy system. IOP Conf Ser Earth Environ Sci. 2021;898(1):012003. 10.1088/1755-1315/898/1/012003.Search in Google Scholar
© 2023 the author(s), published by De Gruyter
This work is licensed under the Creative Commons Attribution 4.0 International License.